
Smart Plug Market Size and Share
Market Overview
| Study Period | 2020 - 2031 |
|---|---|
| Market Size (2026) | USD 5.29 Billion |
| Market Size (2031) | USD 16.58 Billion |
| Growth Rate (2026 - 2031) | 25.70 % |
| Fastest Growing Market | Asia Pacific |
| Largest Market | North America |
| Market Concentration | Medium |
Major Players *Disclaimer: Major Players sorted in no particular order Image © Mordor Intelligence. Reuse requires attribution under CC BY 4.0. | |
Smart Plug Market Analysis by Mordor Intelligence
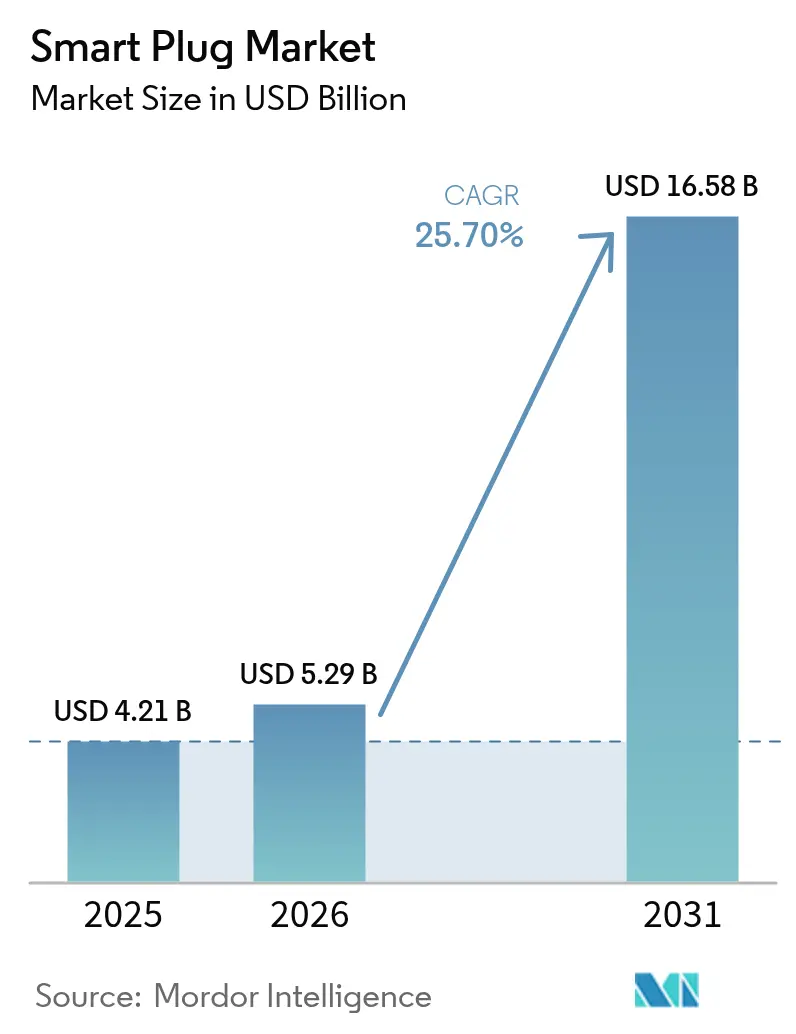
The smart plug market size in 2026 is estimated at USD 5.29 billion, growing from 2025 value of USD 4.21 billion with 2031 projections showing USD 16.58 billion, growing at 25.70% CAGR over 2026-2031. This acceleration stems from mandatory energy-efficiency rules that make plug-load controls a building-code staple, the rapid decline of Wi-Fi chipset prices that brings sub-USD 10 retail tags into play, and the Matter 1.3 interoperability standard that dissolves long-standing ecosystem silos. Voice-assistant ecosystems now anchor purchasing decisions, while ultra-low-power Wi-Fi 6 MCUs shrink standby draw to micro-amp levels and enable multi-year battery use. Rising industrial interest, driven by audits showing up to 36.8 kW in annual plug-load waste per facility, positions smart plugs as a frontline efficiency retrofit. Regional momentum tilts toward Asia Pacific, where Alexa device connections have tripled in India and local chipset suppliers cut bill-of-materials costs for domestic brands.
Key Report Takeaways
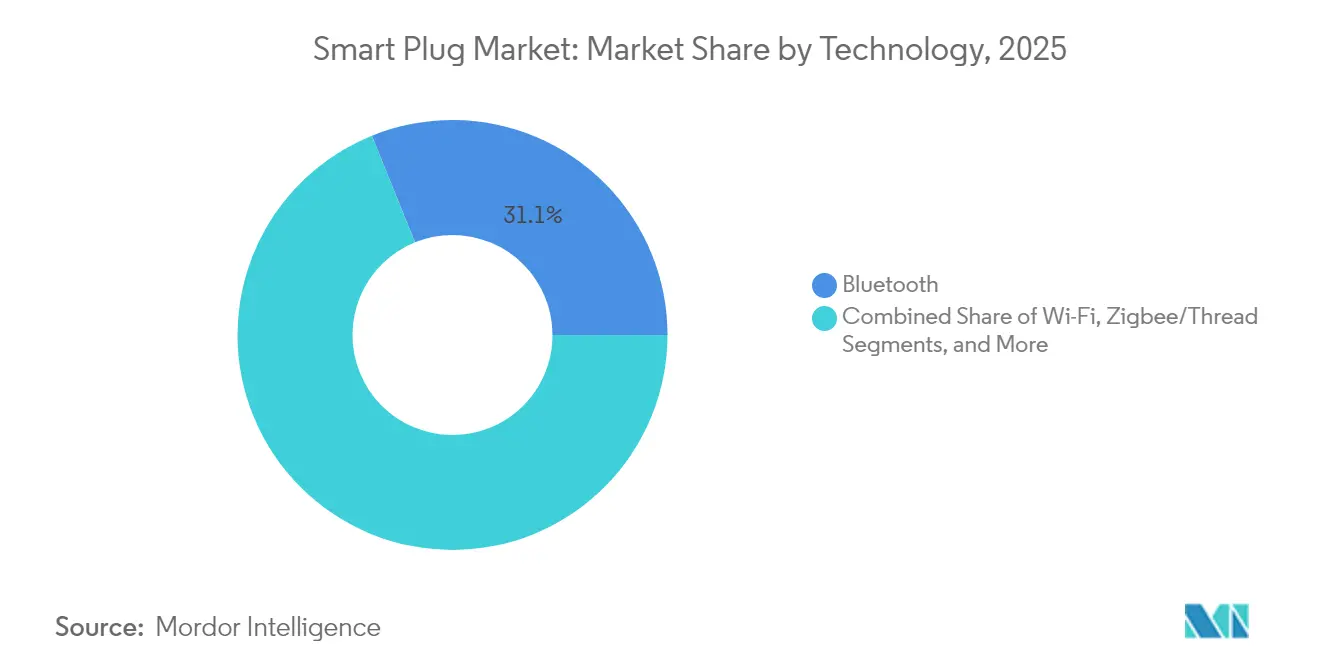
- By technology, Bluetooth held 31.12% of smart plug market share in 2025, while Zigbee/Thread is forecast to expand at 26.15% CAGR through 2031.
- By application, the residential segment accounted for 55.74% of the smart plug market size in 2025; the industrial segment is projected to grow at 27.05% CAGR to 2031.
- By sales channel, online distribution captured 58.92% revenue share in 2025 and is advancing at 24.65% CAGR through 2031.
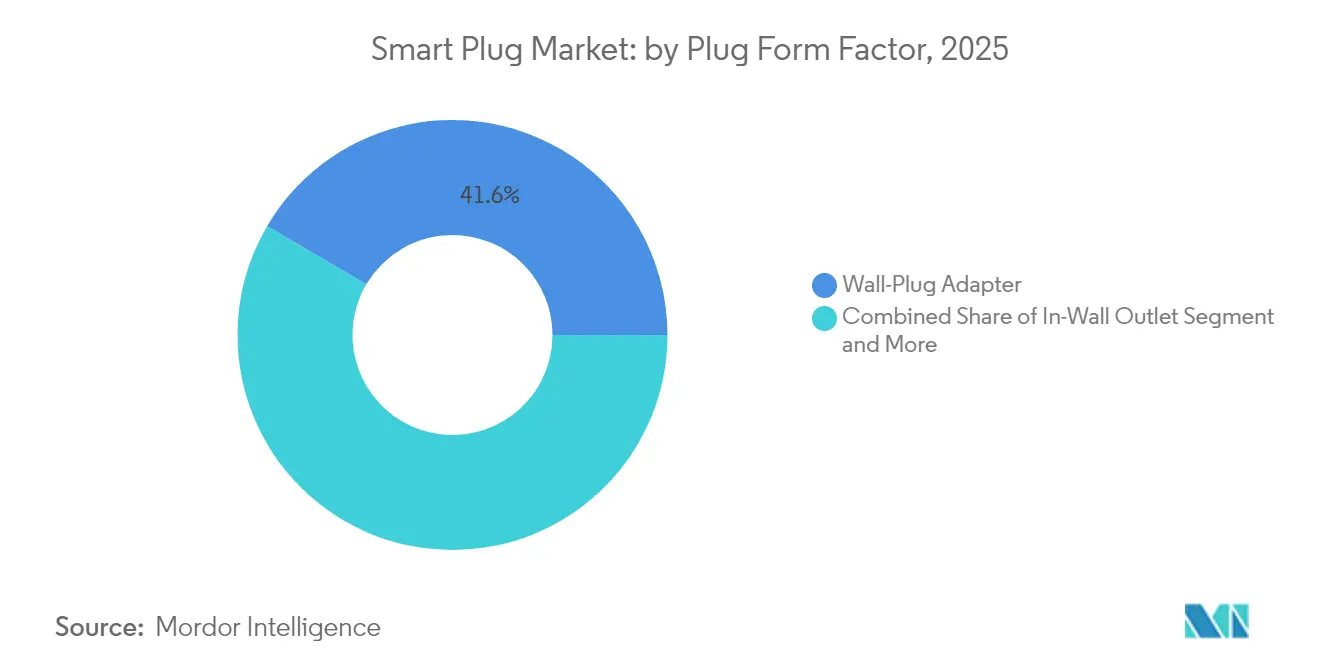
- By plug form factor, Wall-Plug Adapter held 41.55% of smart plug market share in 2025, while In-Wall Outlet is forecast to expand at 26.55% CAGR through 2031.
- By region, North America led with 31.74% share in 2025; Asia Pacific is set to register the fastest 27.60% CAGR to 2031.
Note: Market size and forecast figures in this report are generated using Mordor Intelligence’s proprietary estimation framework, updated with the latest available data and insights as of 2026.
Global Smart Plug Market Trends and Insights
Drivers Impact Analysis*
| Driver | (~) % Impact on CAGR Forecast | Geographic Relevance | Impact Timeline |
|---|---|---|---|
| Soaring adoption of voice-assistant ecosystems | +4.2% | Global, with strongest gains in North America and Asia Pacific | Medium term (2-4 years) |
| Falling ASPs of Wi-Fi chipsets | +3.8% | Global, particularly benefiting emerging markets | Short term (≤ 2 years) |
| Government energy-efficiency mandates for plug-load control | +5.1% | North America, EU, United Kingdom core markets | Long term (≥ 4 years) |
| Matter 1.3 interoperability push | +4.7% | Global, with early adoption in developed markets | Medium term (2-4 years) |
| Subsidy programs for senior-care tele-monitoring | +2.3% | North America and EU, aging population regions | Long term (≥ 4 years) |
| Rising demand for outdoor weather-proof plugs | +1.9% | Global, seasonal demand patterns | Short term (≤ 2 years) |
| Source: Mordor Intelligence | |||
Soaring Adoption of Voice-Assistant Ecosystems
Voice control has shifted from novelty to necessity as Amazon reports a 200% jump in connected smart-home devices in India within three years. The 2025 debut of the USD 19.99-per-month Alexa+ generative-AI service, bundled into Prime, redefines the value proposition from simple on/off switching to multi-device scene orchestration[1]. Subscription economics incentivize deeper engagement, positioning smart plugs as foundational nodes that extend voice-assistant reach to legacy appliances. With more than 140,000 compatible devices in the Alexa catalogue, network effects reduce adoption friction and lift attach rates across income bands. Comparable strategies from Google and Apple reinforce the perception that voice-ready control is now the baseline expectation for every new plug-in device.
Falling ASPs of Wi-Fi Chipsets
Silicon Labs’ SiWx917 MCU trims connected-sleep current to 22 micro amp, slicing component costs and enabling sub-USD 15 retail pricing without sacrificing energy reporting features. Synaptics and Chinese newcomer AIC Micro have entered the USD 3.2 billion ultra-low-power IoT SoC arena, intensifying price competition and widening vendor choice. Mass-market volumes allow ODMs to package dual Wi-Fi/BLE modules inside compact casings while retaining Matter-ready firmware. Emerging economies benefit most, as unit economics now align with middle-income household budgets, expanding the install base beyond early adopters.
Government Energy-Efficiency Mandates for Plug-Load Control
California’s Title 24 Part 6 stipulates demand-responsive controls that react to OpenADR 2.0b signals, effectively mainstreaming smart plugs in commercial retrofits.[2]In the residential arena, the U.S. EPA’s Energy Star SHEMS certification demands inclusion of plug-load monitors, steering builders toward pre-installed smart-home packages. The UK’s 2025 smart-appliance rules require grid-optimized connectivity in products such as heat pumps and EV chargers, broadening the use-case envelope for high-amperage smart outlets. These regulations anchor long-range demand, insulating the smart plug market from discretionary-spend volatility.
Matter 1.3 Interoperability Push
The Connectivity Standards Alliance reports more than 1,000 Matter-certified products just a year after launch, including feature-rich plugs that feed real-time energy data into utility demand-response programs. Thread 1.4 enhances credential sharing and secure commissioning, making low-latency mesh networks viable in large-footprint facilities. Tuya’s ready-to-go Matter-over-Thread modules compress product-development cycles from months to 15 days, lowering barriers for second-tier brands.[3]End-users gain confidence that devices bought today will remain compatible with future ecosystems, accelerating purchase decisions and reducing return rates.
Restraints Impact Analysis*
| Restraint | (~) % Impact on CAGR Forecast | Geographic Relevance | Impact Timeline |
|---|---|---|---|
| Persistent device cybersecurity breaches | -3.2% | Global, with heightened concerns in developed markets | Short term (≤ 2 years) |
| Fragmented RF spectrum in emerging markets | -2.1% | Emerging markets, particularly Asia Pacific and MEA | Medium term (2-4 years) |
| EU WEEE recycling costs hitting margins | -1.8% | EU core markets, with spillover to global manufacturers | Long term (≥ 4 years) |
| Inaccurate energy-metering claims triggering recalls | -2.4% | Global, with regulatory focus in North America and EU | Short term (≤ 2 years) |
| Source: Mordor Intelligence | |||
Persistent Device Cybersecurity Breaches
Smart-device cyberattacks more than doubled in 2024, eroding consumer trust as high-profile flaws surfaced in major brands. TP-Link’s exposure of local-communication vulnerabilities and the Mars Hydro incident that leaked 2.7 billion IoT records underscore systemic risk. The U.S. FCC’s upcoming Cyber Trust Mark, backed by Amazon and Google, promises clearer labeling but final rules are not yet in force. Product recalls such as Emporia Energy’s withdrawal of 80,000 smart plugs due to shock hazards illustrate the financial toll of insufficient security controls. Until certification regimes become mandatory, lingering doubts may slow first-time purchases, especially in professionally managed facilities with stricter IT policies.
Fragmented RF Spectrum in Emerging Markets
Divergent frequency allocations oblige manufacturers to spin multiple SKUs, driving up inventory costs and complicating compliance. Inconsistent test procedures lengthen certification queues, delaying launches by quarters in several Asian and African economies. Thread and Zigbee devices rely on clear 2.4 GHz channels; where spectrum is congested or administratively restricted, performance suffers and customer-support overhead rises. These frictions deter smaller brands from entering less-predictable markets, limiting access and slowing global volumes.
*Our forecasts treat driver/restraint impacts as directional, not additive. The impact forecasts reflect baseline growth, mix effects, and variable interactions.
Segment Analysis
By Technology: Thread Nets Speed and Interoperability Gains
Bluetooth retained the largest 31.12% slice of smart plug market share in 2025, but Zigbee/Thread protocols are accelerating at a 26.15% CAGR on the back of Matter certification momentum. The smart plug market size for Thread-enabled models is projected to swell sharply as enhanced credential-sharing in Thread 1.4 unlocks enterprise-grade deployments. Tuya’s 15-day turnkey module program signals how standardization compresses time-to-market and lowers engineering hurdles. Wi-Fi enjoys cost-led ubiquity and excels in bandwidth-heavy use-cases such as high-resolution energy metering, while Z-Wave remains entrenched in legacy US security systems. Proprietary stacks risk obsolescence as consumers align around cross-platform purchase assurance.
Thread’s real-time energy-reporting offers clear advantages in utility demand-response. Matter 1.3 now lets smart plugs feed instantaneous consumption data to broader home-energy-management dashboards. Consequently, utility rebates are beginning to single out Thread-capable hardware, incentivizing installers to pivot away from Wi-Fi-only SKUs. Vendors that overlay energy analytics atop Thread’s low-latency mesh can charge premium ASPs, cushioning margin erosion in a commoditizing category.

By Application: Industrial Retrofits Outpace Housing Starts
Residential premises still represent 55.74% of the 2025 smart plug market size, buoyed by voice-assistant bundling and DIY convenience. Yet industrial and commercial buildings are set to expand at a 27.05% CAGR as facility managers chase quantified returns; field studies show 36.8 kW of annual plug-load savings per site when IoT scheduling is applied. Honeywell’s plug-load module for enterprise building-management systems exemplifies the pivot to data-driven energy compliance.
In factories and warehouses, skinned industrial-grade smart plugs add thermal-overload protection and over-current analytics that residential units lack. Hospitals and elder-care facilities deploy smart plugs to verify medical-device uptime and prevent unplanned disconnection, aided by subsidy programs for remote monitoring in aging societies. The commercial appetite for SLA-backed hardware supports higher price points, widening the total addressable smart plug market for specialist OEMs.
By Sales Channel: Digital Commerce Tightens Its Grip
E-commerce platforms secured 58.92% of 2025 revenue thanks to expert-review content, compatibility filters, and next-day delivery assurances that reduce buyer anxiety around technical products. Online outlets continue to post 24.65% CAGR as manufacturers integrate QR-code setup wizards that cut installation calls. The pandemic-era shift to contact-free retail set lasting precedents; shoppers now expect live chat support and community forums before committing to a purchase.
Brick-and-mortar chains counter with try-before-you-buy kiosks and bundled installation services, capturing shoppers who demand immediate fulfillment. Best Buy’s embrace of the FCC’s Cyber Trust Mark seeks to position physical stores as trusted advisors in a security-sensitive landscape. Omnichannel strategies that sync store inventory with online configurators are becoming table stakes for brands pursuing share gains across segments.
By Plug Form Factor: Wall Adapters Dominate but Niche Formats Multiply
Universal wall adapters claimed 41.55% of unit shipments in 2025 on account of tool-free installation and low entry cost. TP-Link’s HomeKit-equipped Kasa four-pack at USD 49.99 exemplifies the value push in this segment. In-wall outlets ride renovation cycles; builders embed them in kitchen islands and office cubicles to provide flush-mount convenience and tamper resistance. Power-strip variants satisfy corporate rollouts requiring multi-device control with single-IP address provisioning.
Outdoor-rated plugs are enjoying double-digit growth as consumers automate patio heaters, pool pumps, and holiday lighting. IP64 enclosures and 300-ft Wi-Fi ranges featured in GE Lighting’s CYNC Outdoor Plug illustrate the engineering tweaks that command premiums. Travel-size USB hybrids and smart-breaker modules fill emerging micro-niches but currently lack the scale of mainstream adapters.
Geography Analysis
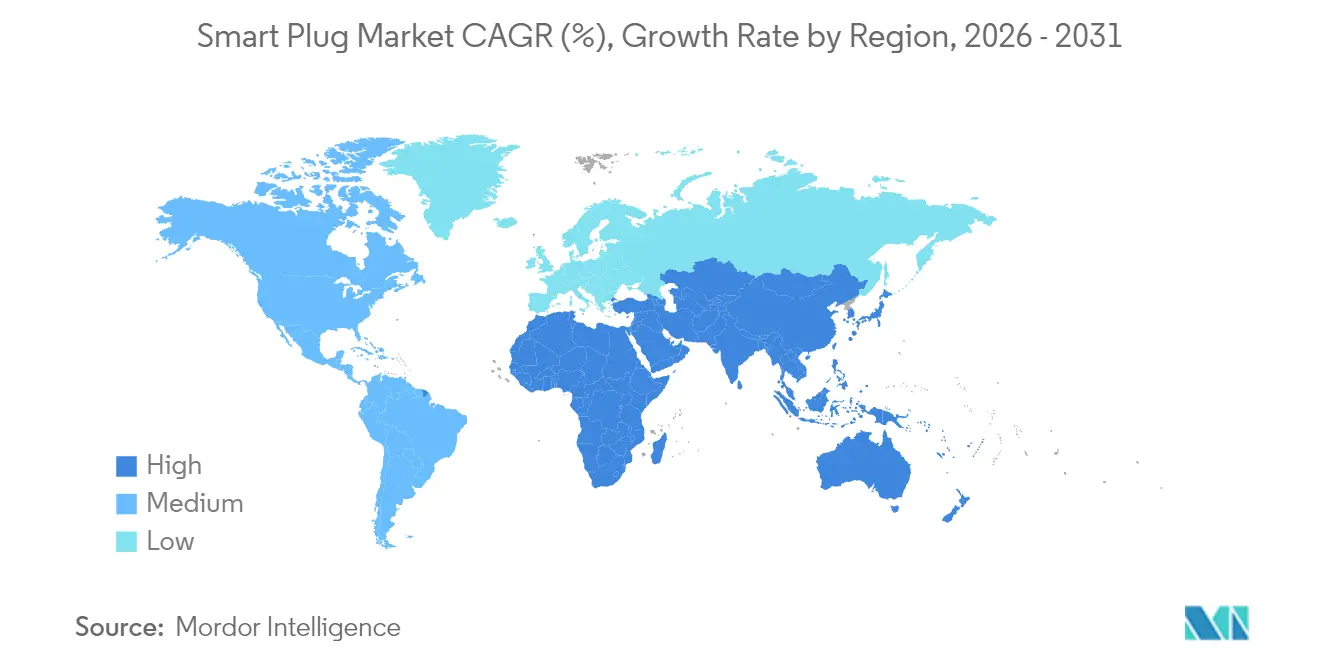
North America retained 31.74% leadership in 2025 on the strength of Energy Star SHEMS rules and broadband ubiquity, with utilities offering rebates for demand-response-certified plugs. The region’s mature voice-assistant penetration fosters ecosystem lock-in that reduces churn and encourages whole-home retrofits. Canada’s updated Energy Efficiency Regulations mirror U.S. standards, giving manufacturers a unified North American certification roadmap.
Asia Pacific is projected to clock a 27.60% CAGR, making it the fastest-expanding territory of the smart plug market. Localized voice-assistant dialect support and competitive pricing have tripled the Alexa device count in India since 2022. China’s domestic chipset output curbs BOM volatility and allows white-label brands to proliferate. Government-funded smart-city pilots in Japan and South Korea integrate plug-level energy monitoring into district-wide carbon dashboards, seeding institutional demand for Thread-mesh deployments.
Europe presents a mixed picture. WEEE Directive 2024/884 places full end-of-life costs on manufacturers, pressuring gross margins. Conversely, the UK’s 2025 smart-appliance rules require grid-aware functionality, widening the pool of devices that can benefit from retrofitting with Matter-ready smart plugs. Tuya’s London retrofit forum underscored the role that low-cost plugs play in hitting net-zero targets for aging housing stock.
South America and the Middle East-Africa trail in installed base but register double-digit growth as 5G rollouts improve latency and coverage. High import duties remain a hurdle, prompting local assembly joint ventures that leverage regional free-trade zones. Developers tapped into hotel chains in the Gulf Cooperation Council to trial centralized energy dashboards, illustrating how smart plugs serve as a gateway product for broader IoT infrastructure.
Regulatory Landscape
Cybersecurity and safety compliance are tightening across core smart plug markets, pushing vendors toward standardized documentation, labeling, and incident handling. In the United States, the FCC IoT Labeling Program (Cyber Trust Mark) became effective on 29 August 2024 as a voluntary consumer security label, while in the EU the Radio Equipment Directive cybersecurity requirements for internet-connected radio equipment apply from 1 August 2025. Australia also moved with Cyber Security (Security Standards for Smart Devices) Rules 2025, adding requirements around passwords, security reporting, and support periods for covered consumer smart devices.
Competitive Landscape
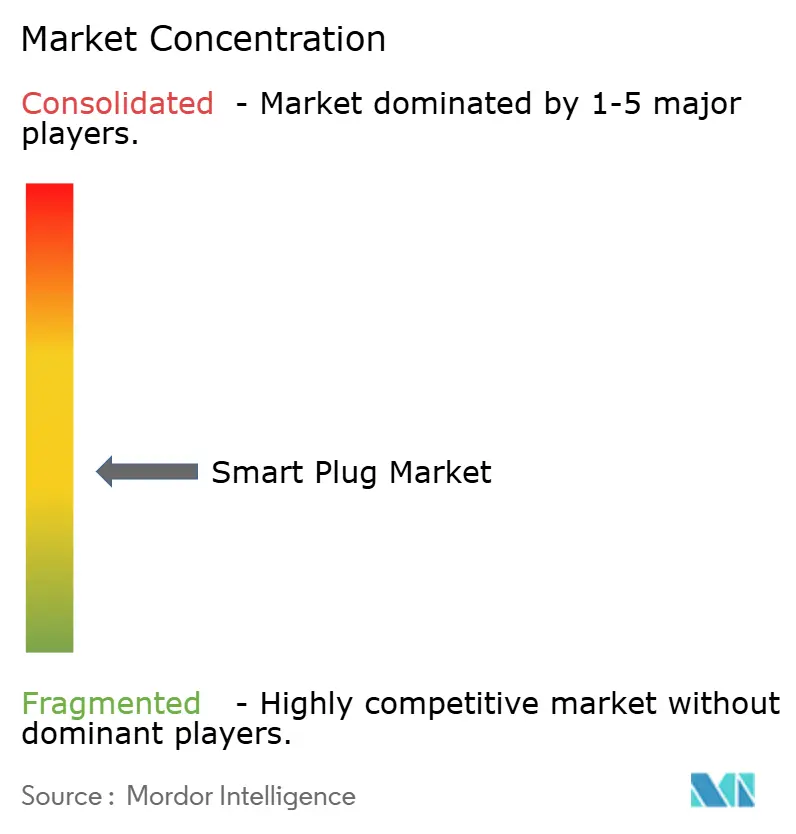
More than 21 active vendors jostle across consumer, prosumer, and industrial tiers, rendering the smart plug market moderately fragmented. TP-Link, Belkin, and Xiaomi defend share through brand familiarity and shelf dominance, while Tuya and SONOFF leverage cloud platform licensing to multiply third-party SKUs rapidly. Matter certification introduces new technical hurdles that may catalyze consolidation toward R&D-rich players capable of absorbing test-lab cycles and firmware-update overhead.
Differentiation now hinges on cybersecurity hardening, energy-monitoring granularity, and seamless voice-assistant provisioning. TP-Link’s investment in Wi-Fi 7 APs that double as IoT hubs showcases vertical integration aimed at lock-in. Amazon’s Alexa+ subscription poses both an opportunity for hardware upticks and a risk of commoditizing standalone value, pressuring OEMs to bundle services or analytics capabilities.
White-space remains in industrial and outdoor applications where temperature tolerance, over-current shutters, and IP-rated enclosures let suppliers command ASP premiums. Thread Group participation, evidenced by 670+ certifications, acts as a trust proxy for buyers and a moat for incumbents able to navigate ever-evolving SDKs. Market entrants that specialize in vertical niches such as EV-charger adapters or hydroponic grow-lights capitalize on tailored firmware but must scale cautiously to avoid R&D dilution.
Smart Plug Industry Leaders
-
TP-Link Technologies
-
Panasonic
-
Xiaomi
-
D-Link
-
Amazon (First-Party)
- *Disclaimer: Major Players sorted in no particular order
Market Opportunities and Future Outlook
The most actionable whitespace is shifting from basic remote switching toward standardized energy visibility and orchestration. Matter 1.3 formalized energy monitoring clusters (watts and kWh), which increases the need for compliant device firmware and host ecosystem support, creating room for vendors that can deliver accurate metering plus reliable integrations across multi-admin environments, including home-energy dashboards and utility-facing demand-response workflows referenced in current market dynamics. Schneider Electric has commercialized Matter-certified home energy products under its ecosystem, indicating that electrification players are using interoperability to connect plug-level control into broader energy management portfolios.
Regulatory and standards pull-through also supports region-specific, compliance-forward SKUs and services. The UK consultation draft for the Energy Smart Appliances Regulations 2026 proposes interoperability requirements (including maintaining key functions when switching energy suppliers) and cybersecurity provisions aligned to ETSI EN 303 645, while Singapore SS 702:2024 specifies requirements for smart plugs as integrated 3-pin units. Vendors that pair compliant hardware with longer support periods, security update tooling, and auditable documentation can differentiate in enterprise and channel procurement, particularly as the EU cybersecurity timetable advances toward the Cyber Resilience Act reporting obligations from 11 September 2026 and as the EU Radio Equipment Directive cybersecurity requirements (effective 1 August 2025) increase the burden on importers and retailers to verify technical files.
Recent Industry Developments
- June 2026: Amazon expanded its Prime Day smart plug promotions with broad discount bundles across major markets. This reinforced Alexa-enabled home control adoption and deepened plug-level integration into wider smart home ecosystems.
- May 2025: TP-Link launched the Tapo P316M Matter-compatible Smart Wi-Fi Power Strip. This added Matter interoperability to a power-strip form factor, broadening cross-ecosystem control and reinforcing interoperability as a buying criterion.
- November 2024: Xiaomi started construction of a 751-acre smart home appliance factory in Wuhan to scale production of IoT-enabled devices. Operational status for 2026 was referenced, and expanded in-house manufacturing capacity should support Xiaomi's supply at scale and its ability to manage bill-of-materials and quality control across its ecosystem.
Research Methodology Framework and Report Scope
Market Definition and Coverage
This market covers the revenue generated from smart plugs that add connected control to an electrical outlet, letting users switch power on or off, schedule usage, and in some cases track energy consumption through an app or hub.
Scope exclusions: We exclude basic mechanical timers, non-connected adapters, industrial power connectors, and DIY relay boards that are not sold as finished consumer smart plug products.
Segmentation Overview
- By Technology
- Wi-Fi
- Bluetooth
- Zigbee / Thread
- Z-Wave
- Others
- By Application
- Residential
- Commercial
- Industrial
- Others (Hospitality, Healthcare)
- By Sales Channel
- Online
- Offline
- By Plug Form Factor
- Wall-Plug Adapter
- In-Wall Outlet
- Power Strip
- Others
- By Geography
- North America
- United States
- Canada
- Mexico
- South America
- Brazil
- Argentina
- Rest of South America
- Europe
- Germany
- United Kingdom
- France
- Italy
- Rest of Europe
- Asia-Pacific
- China
- Japan
- South Korea
- India
- Rest of Asia-Pacific
- Middle East and Africa
- GCC
- Turkey
- South Africa
- Rest of Middle East and Africa
- North America
Data Sources, Market Sizing, and Validation
Desk Research
Desk research starts with building a clean view of how the smart home and connected electrical accessory space is measured in public data. We used sources such as the US Census and USITC trade statistics, Eurostat, UN Comtrade, and energy and efficiency publications from agencies such as the IEA to understand device demand direction and pricing pressure.
After that, we reviewed manufacturer websites, product catalogs, and filings, along with investor presentations and reputable press coverage, to understand feature shifts such as energy monitoring, outdoor ratings, and connectivity changes. We also referenced paid subscriptions used for company financials and news, patent databases, and a shipment-level import and export database to sanity-check supplier footprints and channel movement. These sources are illustrative, and we consulted additional public and paid references to collect data, validate assumptions, and clarify gaps.
Primary Interviews and Surveys
Primary conversations were held with stakeholders across the value chain, including product and channel managers, distributors, and smart home ecosystem participants, so we could confirm what is actually selling and at what typical price bands. Since this is a global market, we balanced input across major demand regions, and we used follow-up checks when desk signals and interview feedback did not align.
The discussions also helped refine how buyers distinguish between single plugs, connected strips, and outlet-style products in retail catalog terms.
Distribution of primary research fieldwork respondents
| Company type | Respondent position | Region |
|---|---|---|
| Top tier: 32% | CXOs: 14% | APAC: 45% |
| Mid tier: 52% | Functional/Unit leaders: 27% | EMEA: 31% |
| Smaller Players: 16% | Managers: 59% | Americas: 24% |
Market-Sizing & Forecasting
The sizing model uses a top-down approach, reconstructing smart home device adoption and connected accessory shipments from production, trade flows, and channel availability by region, and then translating those totals into smart plug demand pools. To keep the output realistic, we corroborate the results with selective bottom-up approximations, such as sample vendor revenue roll-ups, channel checks, and a simple ASP times unit volume build for key countries.
Key inputs include household smart home penetration, broadband and Wi-Fi router base as a practical installation proxy, pricing bands for single plugs versus strips, the attach rate of energy monitoring features, and regional e-commerce share, which affects discounting and ASP progression. When bottom-up visibility is incomplete, gaps are handled through conservative share allocations based on interview guidance and the observed breadth of distribution, then reviewed again at the regional sum level.
For forecasting, we rely mainly on scenario analysis supported by regression-style checks that link demand to smart home adoption growth and pricing trends, followed by adjustments using what interviewees expect for connectivity transitions and retail promotions. The final forecast is kept repeatable, so any analyst can update it when new shipment, trade, or pricing signals appear.
Data Validation & Update Cycle
Outputs are validated through triangulation across independent signals, where the model is compared against trade movement, pricing direction, and smart home device adoption indicators to check whether growth is plausible. Large variances are flagged, worked back to the assumption level, and corrected only after the logic holds together across regions and channels.
A second analyst review is done before sign-off, and we re-contact sources when a key input changes, such as a sudden ASP shift, a connectivity standard transition, or a demand shock tied to housing or energy costs. Reports are refreshed annually, with interim updates for material events, and a final pre-delivery check is done so clients receive the latest view available at release time.
Mordor Intelligence's Smart Plug Market Size Compared Against Other Published Estimates
Published values for smart plug market size can differ quite a lot, even when the product seems straightforward, because the counting rules are not always the same. The biggest drivers are usually what product forms are included, what price point is assumed for mass retail versus premium models, and whether the study is updated after major pricing changes.
In this study, the gap mainly comes from counting connected plug adapters, in-wall outlets, and connected strips at factory-gate values, and excluding non-connected timer sockets, which keeps the 2026 total tied to the same revenue definition used by Mordor Intelligence.
Benchmark comparison
| Source | Market Size | Gaps in Research Methodology |
|---|---|---|
| Mordor Intelligence | USD 5.29 B (2026) | |
| Global Consultancy A | USD 3.67 B (2025) | Uses a different base year and may narrow the definition to app-controlled plug adapters, which can undercount in-wall smart outlets and connected power strips, and it may also apply more conservative near-term ASP progression. |
| Industry Publisher B | USD 3.02 B (2024) | Starts earlier and may rely more heavily on historic shipment signals, which can lag fast retail expansion, and it does not clearly state whether energy-monitoring variants and multi-socket strips are fully included in the value build. |
Taken together, the spread is explained less by math and more by scope choices and how price is treated across channels. By keeping the inputs traceable to adoption, pricing bands, and channel breadth, we end up with a number that can be rechecked and updated without changing the underlying logic.
Key Questions Answered in the Report
What is the 2026 value of the smart plug market?
The smart plug market is valued at USD 5.29 billion in 2026.
How fast is the smart plug market expected to grow?
It is projected to expand at a 25.70% CAGR, reaching USD 16.58 billion by 2031 over 2026-2031.
Which region is growing the quickest?
Asia Pacific is forecast to post the fastest 27.60% CAGR through 2031, driven by smart-city projects and lower hardware prices.
What technology segment currently leads smart plug sales?
Bluetooth held the top technology segment share at 31.12% in 2025.
Why is Matter 1.3 important for smart plugs
Matter 1.3 resolves interoperability barriers, enabling cross-brand integration and real-time energy reporting that utilities can leverage for demand-response programs.