
Smart Packaging Market Size and Share
Market Overview
| Study Period | 2020 - 2031 |
|---|---|
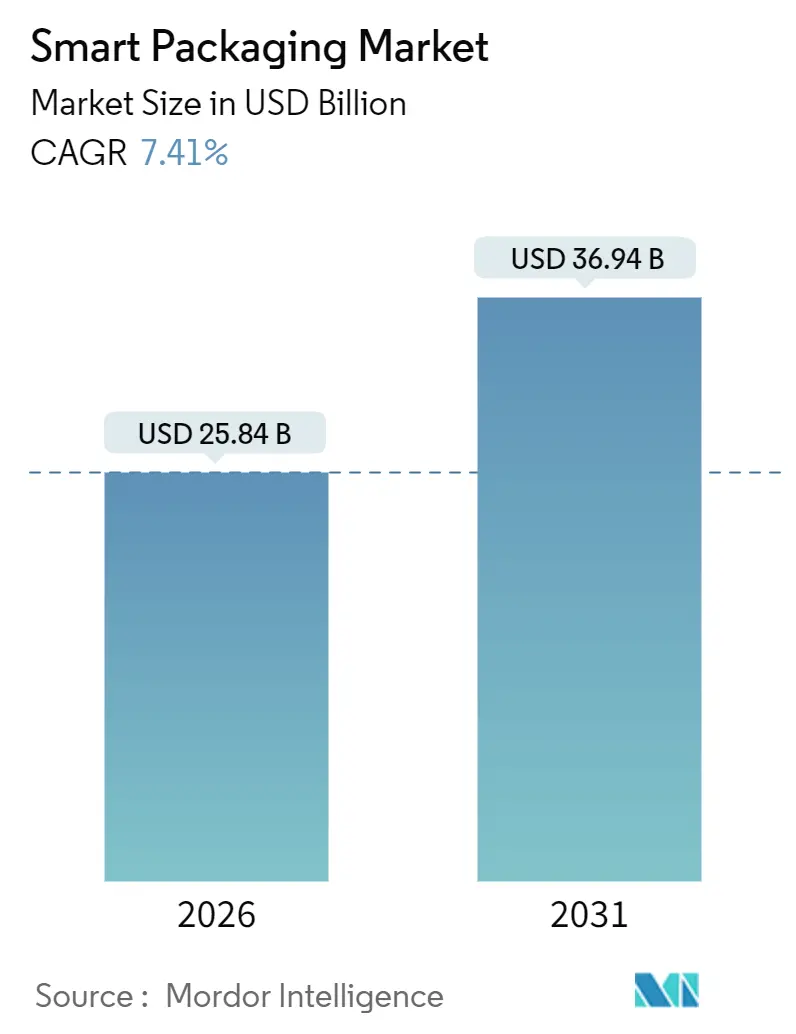
| Market Size (2026) | USD 25.84 Billion |
| Market Size (2031) | USD 36.94 Billion |
| Growth Rate (2026 - 2031) | 7.41 % |
| Fastest Growing Market | Asia Pacific |
| Largest Market | North America |
| Market Concentration | Medium |
Major Players *Disclaimer: Major Players sorted in no particular order Image © Mordor Intelligence. Reuse requires attribution under CC BY 4.0. | |
Smart Packaging Market Analysis by Mordor Intelligence
The smart packaging market size stood at USD 25.84 billion in 2026 and is projected to reach USD 36.94 billion by 2031, reflecting a 7.41% CAGR over the forecast period. The current smart packaging market size demonstrates how printed electronics, antimicrobial coatings, and IoT connectivity are redefining packages as active data points across digitized supply chains. Steady demand for shelf-life extension films in online grocery, falling RFID tag costs, and serialization mandates in pharmaceuticals jointly reinforce growth momentum. In parallel, European circular-economy rules, China’s cold-chain modernization, and item-level inventory strategies in North American retail are widening the addressable base for technology vendors. Brands also view connected packs as a gateway to first-party consumer insights, an advantage that gains importance as browser cookies fade.
Key Report Takeaways
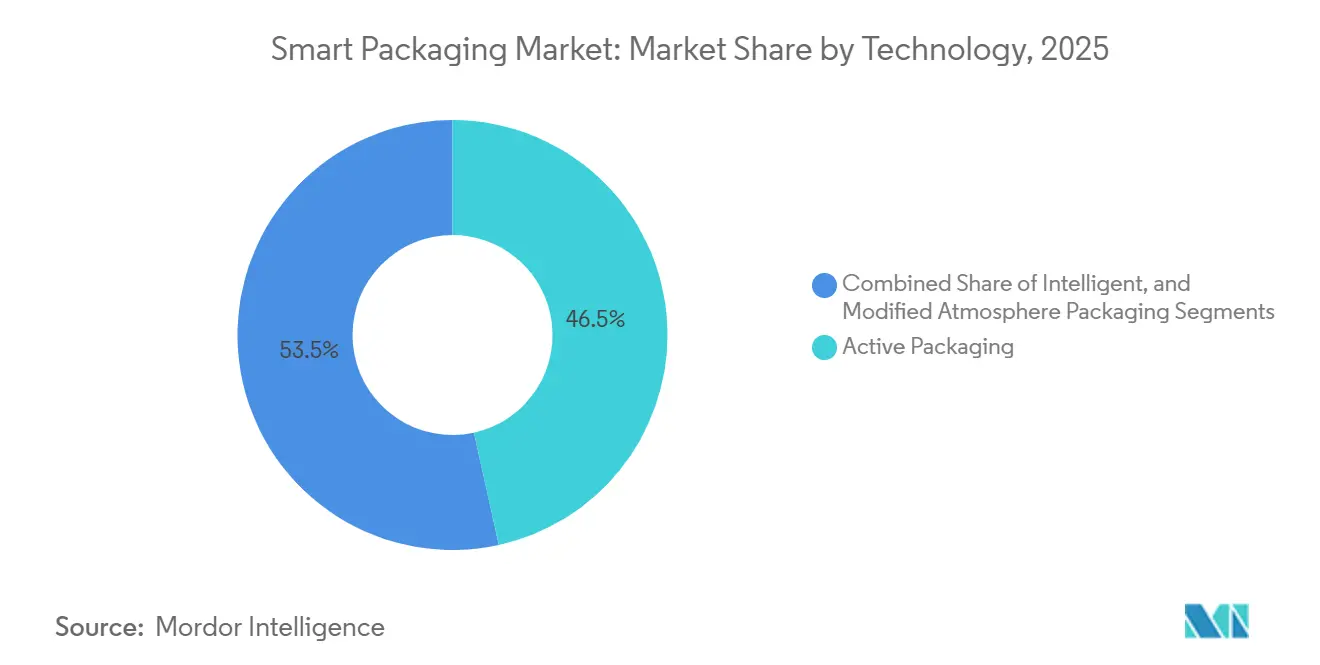
- By technology, active formats led with 46.54% smart packaging market share in 2025, while intelligent formats are on course for the fastest 9.23% CAGR through 2031.
- By material, plastics commanded 42.43% share of the smart packaging market size in 2025; biodegradable polymers are forecast to post the strongest 8.43% CAGR between 2026 and 2031.
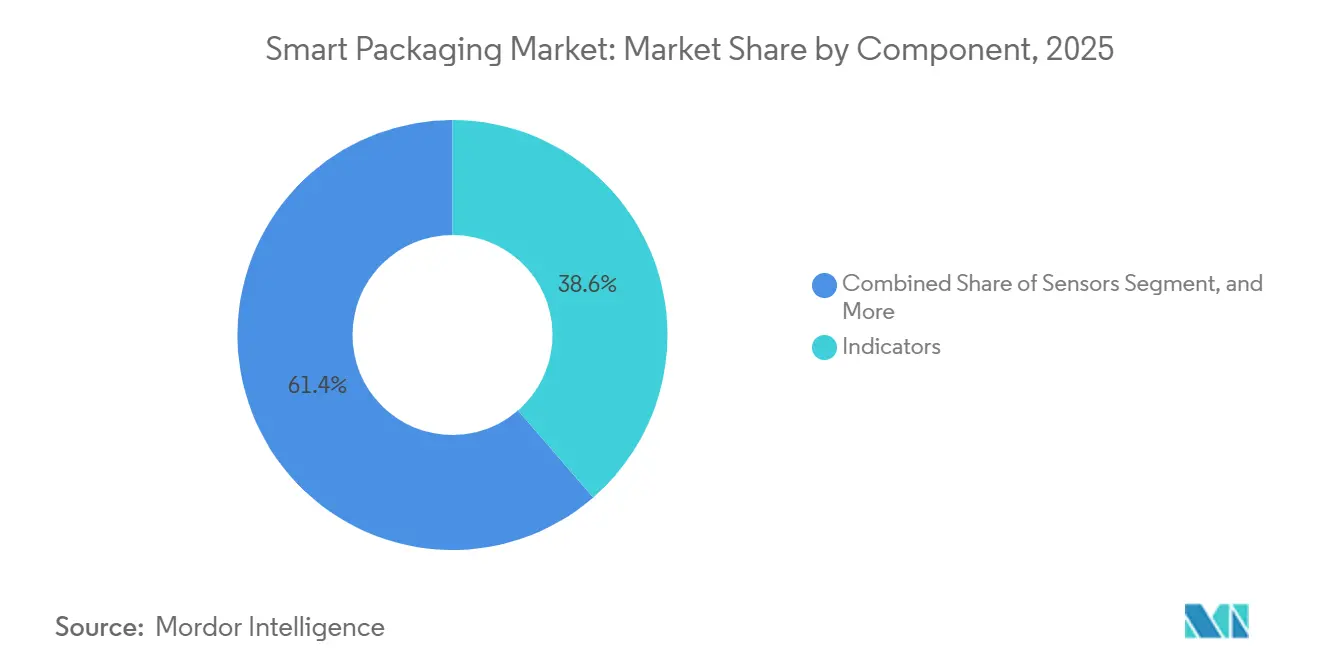
- By component, indicators contributed 38.64% revenue in 2025, and sensors are tracking an 8.83% CAGR through 2031.
- By end-user, food accounted for 28.76% of demand in 2025, whereas pharmaceuticals are set to expand at an 8.76% CAGR to 2031.
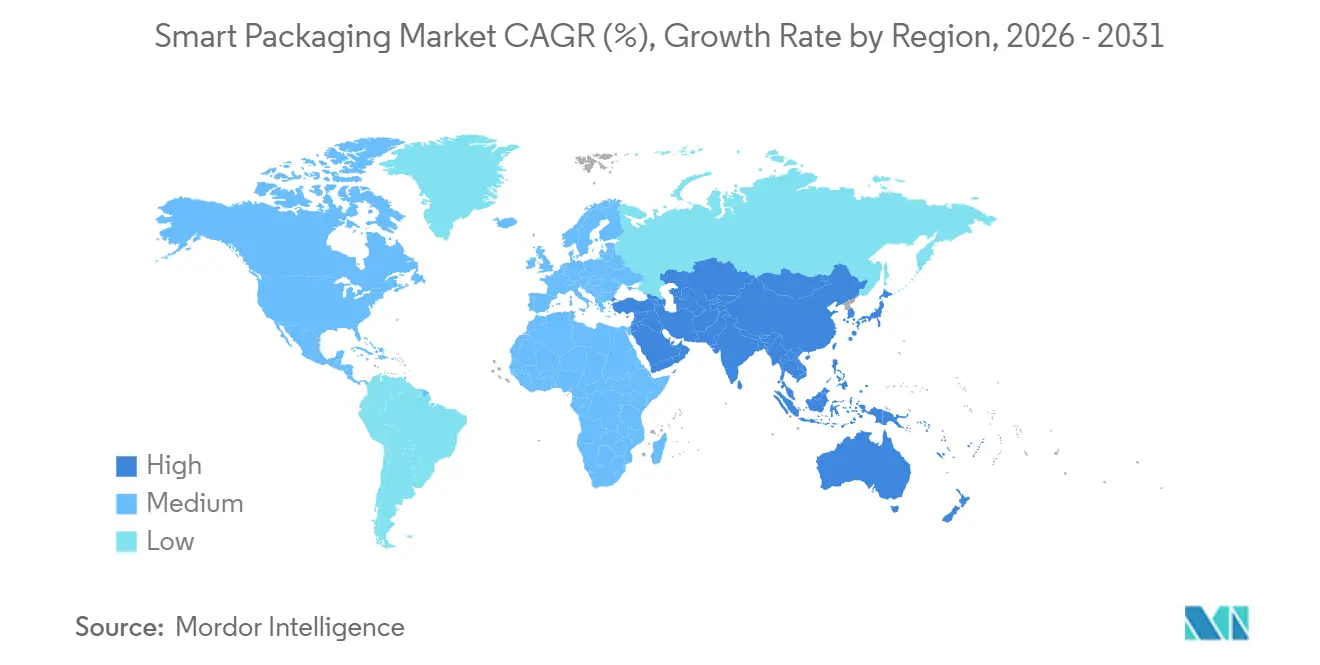
- By geography, North America remained the largest regional contributor with 39.74% revenue share in 2025; Asia-Pacific is poised for the fastest 9.76% CAGR out to 2031.
Note: Market size and forecast figures in this report are generated using Mordor Intelligence’s proprietary estimation framework, updated with the latest available data and insights as of January 2026.
Market Trends and Insights
Drivers Impact Analysis of Smart Packaging Market*
| Driver | (~) % Impact on CAGR Forecast | Geographic Relevance | Impact Timeline |
|---|---|---|---|
| Advancement in Printed Electronics Enabling Cost-effective RFID and NFC Tags | +1.2% | Global, with early adoption in North America and Asia-Pacific | Medium term (2-4 years) |
| Growing Demand for Real-time Food Quality Monitoring in E-commerce Cold Chains | +1.5% | North America, Europe, and urban Asia-Pacific | Short term (≤2 years) |
| Stringent Anti-counterfeiting Regulations in Pharmaceutical Supply Chains | +1.3% | North America, Europe, with spillover to South America and Middle East | Long term (≥4 years) |
| Consumer Preference for Sustainable Packaging with Integrated Freshness Indicators | +0.9% | Europe, North America, and Australia | Medium term (2-4 years) |
| Adoption of IoT-enabled Packaging by CPG Brands for Direct-to-Consumer Engagement | +1.0% | North America, Western Europe, and Japan | Medium term (2-4 years) |
| Rapid Growth of Smart Retail Shelves Requiring Embedded Intelligent Packaging | +0.8% | North America, Europe, and select Asia-Pacific metros | Long term (≥4 years) |
| Source: Mordor Intelligence | |||
Advancement in Printed Electronics Enabling Cost-effective RFID and NFC Tags
Roll-to-roll printing of conductive inks on flexible plastic has reduced the per-tag cost by roughly 60% since 2024, pushing passive RFID below the USD 0.05 threshold that retailers deem viable for item-level tracking.[1]Pragmatic Semiconductor, “FlexIC Platform,” pragmaticsemi.com The resulting economics allow apparel, cosmetics, and even mid-priced fast-moving goods to carry unique identifiers that feed real-time inventory dashboards. Printed circuits now survive standard flexographic temperatures, so converters add antennas during the same press pass that applies graphics, eliminating a secondary assembly stage. NFC tags, which harvest power from smartphones, are being integrated into pharmaceutical blister packs to authenticate origin and trigger dose-reminder apps, an approach that will be scaled across several EU markets in 2025.[2]Avery Dennison Corporation, “Intelligent Labels Solutions,” averydennison.com Luxury spirits producers also embed encrypted batch data in NFC chips, providing consumers with a direct verification path that deters diversion and enhances brand engagement.
Growing Demand for Real-time Food Quality Monitoring in E-commerce Cold Chains
Doorstep grocery delivery revealed gaps in last-mile temperature control. A 2025 study showed 12% of refrigerated shipments exceeded 4 °C for more than 30 minutes, accelerating spoilage risks.[3]U.S. Department of Agriculture, “Food Safety and Cold Chain,” usda.gov Color-change time-temperature labels now let shoppers reject compromised items, curbing liability for retailers and cutting waste. One solution embeds CO₂ sensors in modified-atmosphere trays and transmits alerts to warehouse systems, letting operators reroute at-risk inventory to nearby stores. Cold-chain providers increasingly back these sensors with blockchain ledgers, creating immutable temperature records that assist regulators and insurers. The approach, proven in biologics distribution, is migrating to high-margin proteins and organic produce.
Stringent Anti-counterfeiting Regulations in Pharmaceutical Supply Chains
Full enforcement of the U.S. Drug Supply Chain Security Act requires every prescription package to carry a unique serialized code verified at each hand-off. Europe’s Falsified Medicines Directive established a parallel framework, and over 9 billion packs had been authenticated via a centralized hub by late 2025.[4]European Medicines Agency, “Falsified Medicines Directive,” ema.europa.eu India amended its Drugs and Cosmetics Rules to mandate track-and-trace for Schedule H drugs, pushing local manufacturers toward RFID-enabled cartons. Compliance demands foster steady demand for converters that can print 2D barcodes, embed RFID, and add tamper-evident closures on the same line. Technology vendors supplying readers and cloud platforms report rising revenue from life-science clients.
Consumer Preference for Sustainable Packaging with Integrated Freshness Indicators
A 2025 survey found that European consumers are willing to pay a 7% premium for packs that combine biodegradability with visual spoilage cues. Solutions include polylactic acid films infused with pH-sensitive dyes and paperboard trays bearing water-based freshness inks that meet the EN 13432 compostability standards. By eliminating multi-material laminates, these packs glide through industrial composting lines without manual separation, advancing circular economy targets. Brands are adding QR codes that link to carbon-footprint dashboards, a transparency feature piloted on ice cream products in 2025. The forthcoming EU Packaging and Packaging Waste Regulation, scheduled for adoption in 2026, will make recyclability or compostability mandatory by 2030, thereby reinforcing investment in single-substrate intelligent labels.
Restraints Impact Analysis of Smart Packaging Market*
| Restraint | (~) % Impact on CAGR Forecast | Geographic Relevance | Impact Timeline |
|---|---|---|---|
| High Initial Capital Expenditure for Smart Packaging Production Lines | -0.7% | Global, with acute impact in emerging Asia-Pacific and South America | Short term (≤2 years) |
| Limited Recycling Infrastructure for Multi-material Active Packaging | -0.5% | Global, particularly acute in North America and developing Asia | Medium term (2-4 years) |
| Privacy Concerns Over Consumer Data Collected via Connected Packaging | -0.3% | Europe, North America, and Australia | Medium term (2-4 years) |
| Absence of Global Interoperability Standards for Sensor-based Packaging | -0.4% | Global | Long term (≥4 years) |
| Source: Mordor Intelligence | |||
High Initial Capital Expenditure for Smart Packaging Production Lines
Retrofitting extrusion lines with sensor deposition and chip-placement stations often exceeds USD 15 million per site, a cost that sidelines small and mid-size converters. Payback periods lengthen when order volumes fluctuate seasonally, pushing breakeven beyond six years in some emerging markets. Rapid innovation also triggers technology-obsolescence risk; equipment installed in 2024 may face write-offs before full depreciation if next-gen flexible circuits dominate. Equipment-as-a-service contracts from machinery makers reduce upfront cash demands, yet adoption remains limited where commercial-lending ecosystems are thin and currency volatility is high.
Limited Recycling Infrastructure for Multi-material Active Packaging
Hybrid constructions bonding barrier films, sensor layers, and paper often confuse optical sorters and end up in residual waste streams, exacerbating extended producer responsibility fees in France and Germany. Pilot enzymatic delamination projects show promise; one process dissolved adhesive layers in PET films carrying RFID tags, but commercial roll-out lags outside a handful of cities, pending municipal-industry partnerships. Asia-Pacific faces a sharper infrastructure gap, with informal picker networks unable to separate intelligent layers, leading to landfill leakage. Some brands now adopt mono-material polyethylene pouches with printed sensors, trading barrier performance for recyclability.
*Our forecasts treat driver/restraint impacts as directional, not additive. The impact forecasts reflect baseline growth, mix effects, and variable interactions.
Smart Packaging Market Segment Analysis
By Technology:
Active Formats Lead, Intelligent Momentum BuildsActive formats held 46.54% of smart packaging market share in 2025, anchored by oxygen scavengers and antimicrobial films that cut spoilage in meat and bakery channels. Intelligent solutions are expected to post a 9.23% CAGR, buoyed by low-cost RFID and demand for real-time inventory insight. Modified-atmosphere packaging bridges the categories, offering shelf-life gains without data capture, and remains popular with mid-tier processors hesitant to overhaul equipment. Dual-function films launched in 2025 that merge scavenging with color-changing ripeness indicators illustrate a convergence that lets converters upsell layered capabilities.
The technology mix reflects end-user priorities. Pharmaceutical shippers favor desiccants and temperature labels that document compliance, while consumer-goods producers chase NFC tags that unlock recipes or loyalty programs. Regulatory hurdles differ: antimicrobial agents require U.S. FDA food-contact clearance, adding six to twelve months to launch cycles, whereas RFID incurs no such review. As a result, RFID adoption outpaces antimicrobial roll-outs in non-regulated categories.


By Material:
Plastic Dominance Faces Biopolymer UptickPlastic brought in 42.43% of material revenue in 2025 thanks to flexible processing windows and compatibility with sensor lamination. Biopolymers are set to expand at 8.43% CAGR, spurred by European single-use rules that steer converters toward polylactic acid and polyhydroxyalkanoate substrates. These resins now match polyethylene in moisture barrier, yet their higher melt index forces extrusion-line upgrades costing USD 2-4 million per unit. Paper still dominates dry-goods packs, backed by well-established recycling loops; one leading fiber company cited an 87% recovery rate for its corrugated formats in 2025.
Glass and metal remain niche but illustrate possibilities: a pilot aluminum can with thermochromic ink signals ideal drinking temperatures without compromising scrap-metal valorization. Material strategy also aligns with supply-chain resilience. Resin disruptions in 2024 pushed converters to diversify feedstocks and invest in fermentation-derived polymers despite a 20-30% cost premium.
By Component:
Indicator Leadership Meets Sensor SurgeIndicators captured 38.64% revenue in 2025 because time-temperature labels piggyback on existing printing lines at minimal cost. Sensors are poised for an 8.83% CAGR as miniaturized gas detectors and pH probes reach cost thresholds palatable for unit-level deployment. Data carriers such as RFID and NFC benefit from serialization laws and omnichannel inventory models, delivering steady double-digit shipment growth to technology suppliers. Antimicrobial agents remain important for produce and ready-meals but face nano-silver migration limits that slow new approvals inside the European Union.
Regional preferences vary. North America leans heavily on RFID for supply-chain visibility, Europe favors compostable indicators aligned with circular goals, and Asia-Pacific values antimicrobial films to combat warm-climate spoilage. Lack of harmonized calibration standards still hampers global sensor deployment, an issue ISO’s Technical Committee 122 is tackling.
By End-user Industry:
Food Leads, Pharma Gains PaceFood held 28.76% of demand in 2025, driven by modified-atmosphere trays that double shelf life for meat and bakery categories. Pharmaceuticals are expected to clock an 8.76% CAGR through 2031, pulled by serialization, cold-chain, and tamper-evidence rules. Beverage brands adopt thermochromic inks on aluminum and glass to flag chill points, enhancing shelf impact. Cosmetics use NFC-enabled bottles to combine anti-counterfeiting with interactive tutorials, as shown in a 2025 foundation launch that sent personalized shade tips to users’ phones.
Outside these anchors, electronics packaging adds RFID to high-value chips for warranty tracking, while small-batch organics trial freshness indicators on premium SKUs. Adoption correlates with margin structure: pharmaceuticals and cosmetics absorb USD 0.10-0.20 unit costs, whereas price-sensitive food brands roll out intelligent layers only on premium lines.
Geography Analysis
North America Smart Packaging Market
North America held a 39.74% revenue share in 2025, underpinned by early RFID mandates from big-box retailers and full DSCSA enforcement, which serialized every prescription pack. Canada’s Safe Food for Canadians Regulations further spurred the adoption of time-temperature tracking by requiring traceability for fresh produce. Mexico’s role as a near-shoring hub accelerated local label capacity as multinational FMCG firms installed smart-label lines to serve U.S. distribution routes.
APAC Smart Packaging Market
Asia-Pacific is projected to deliver the fastest 9.76% CAGR through 2031. China’s 14th Five-Year Plan earmarked CNY 500 billion for refrigerated logistics and mandated real-time temperature monitoring for vaccines. India’s pharmaceutical sector, which is responsible for 40% of global generic output, now utilizes RFID and 2D codes on export cartons to comply with new domestic regulations. Japan pilots NFC-linked adherence packs that alert caregivers to missed doses, while South Korea expands track-and-trace to health supplements. Australia and New Zealand make recyclability a prerequisite, favoring mono-substrate intelligent labels that separate cleanly during sortation.
EMEA Smart Packaging Market
Europe combines sustainability mandates with rigorous anti-counterfeiting measures. The upcoming Packaging and Packaging Waste Regulation aims for universal recyclability or compostability by 2030, encouraging paper-based RFID labels with water-soluble adhesives. Germany’s VerpackG tiers license fees by material complexity, nudging brands toward single-substrate formats. The U.K. plastic-packaging tax penalizes content with under 30% recycled resin, accelerating demand for mechanically recycled films carrying printed sensors. The Middle East and Africa remain small but show promise; United Arab Emirates smart-city pilots and Saudi Arabia’s Vision 2030 diversification plan both include cold-chain smart packs for imported biologics. South Africa now requires serialization on antiretrovirals, creating a beachhead for smart labels.

Regulatory Landscape
Regulation-driven traceability and circular-economy compliance continue to influence smart-packaging design choices and component selection. In the European Union, the Packaging and Packaging Waste Regulation (EU) 2025/40 entered into force in February 2025 and applies from August 12, 2026, tightening requirements around packaging design and labeling, including a push toward harmonized labels with provisions that can accommodate digital labeling. The European Commission also issued implementation guidance in March 2026 to clarify practical topics such as how to handle stocks with PFAS-related considerations, which affects material and coating selection for active and intelligent formats sold into the EU.
In the United States, FSMA 204 (Food Traceability Rule, 21 CFR Part 1 Subpart S) anchors recordkeeping expectations for foods on the Food Traceability List, reinforcing demand for data carriers and connected packaging workflows at key tracking events. FDA issued draft Q&A guidance in February 2026 to help industry interpret traceability record requirements. Federal appropriations language for FY2026 restricted the use of funds to administer or enforce the rule before July 20, 2028, which extends the planning runway for packaging converters and brand owners deploying sensors, indicators, and serialization-ready labeling systems.
Competitive Landscape
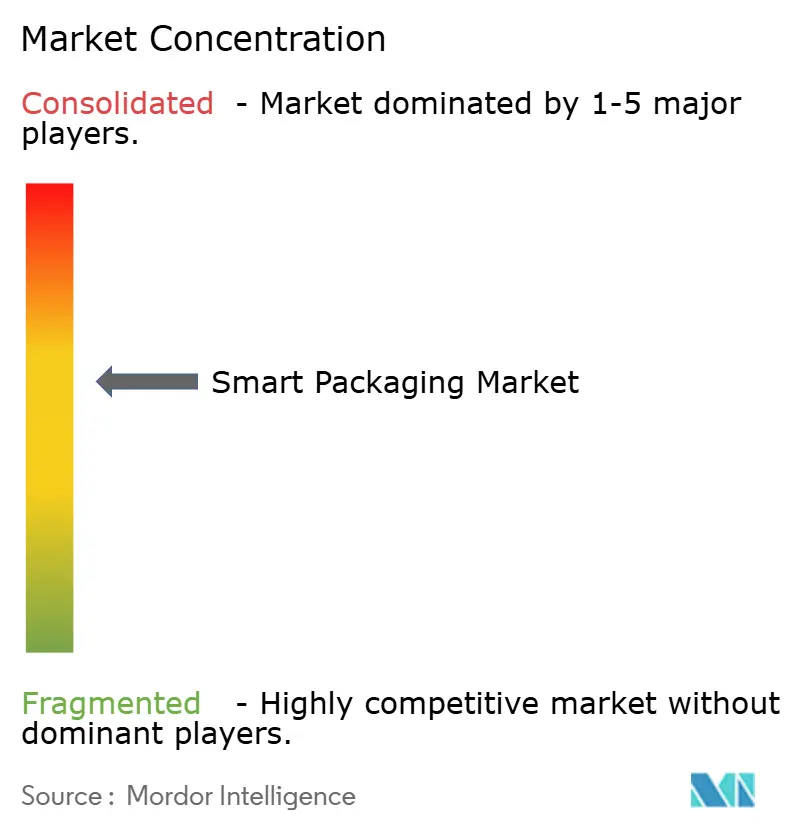
The top ten players accounted for nearly 45% of the revenue in 2025, indicating moderate concentration. Scale converters like Amcor and Sealed Air synchronize oxygen-scavenging know-how with global plant footprints, winning multi-year contracts from food and pharma brands.
Technology specialists such as Pragmatic Semiconductor and Thin Film Electronics push printed IC costs below USD 0.05, unlocking item-level tagging for mass retail. Patent data points to focus areas, including a filing by Avery Dennison for a tamper-evident NFC strip that self-destructs when peeled, targeting drug safety, while a major chemical supplier patented a dual-function film that scavenges oxygen and signals pH shifts.
Biodegradable intelligent packs form a hotly contested niche. Stora Enso and Huhtamaki are piloting paperboard substrates with embedded circuits that meet EN 13432 composting rules. Interoperability remains a hurdle as ISO works toward unified calibration protocols, yet regional divergence in data privacy and waste-handling priorities slows consensus. White space persists in artisan food and emerging-market drug channels, where run lengths are short, and capital is tight, leaving opportunities for modular, lease-based equipment providers.
Smart Packaging Industry Leaders
Sealed Air Corporation
Amcor PLC
Ball Corporation
BASF SE
Huhtamaki Oyj
- *Disclaimer: Major Players sorted in no particular order
Smart Packaging Market Companies Covered in this Report
- Sealed Air Corporation
- Amcor PLC
- Ball Corporation
- BASF SE
- Huhtamaki Oyj
- Stora Enso
- Avery Dennison Corporation
- Zebra Technologies Corporation
- 3M Company
- International Paper Company
- Smurfit WestRock
- Tetra Pak International SA
- R.R. Donnelley and Sons Company
- Mondi Group
- Coveris Holdings S.A.
- Pragmatic Semiconductor
- Thin Film Electronics ASA
- Emerson Electric Co.

Market Opportunities and Future Outlook
A near-term opportunity is emerging where traceability mandates overlap with lower-cost connected-label hardware, particularly for use cases that need item-level identity and condition monitoring without expensive trackers. Identiv’s exclusive manufacturing agreement with IFCO, announced in March 2026, to develop and supply BLE smart labels for a global pool exceeding 400 million reusable containers shows smart packaging expanding from single-use packs into returnable transport packaging and pooled assets. This, in turn, supports recurring demand for ruggedized labels, attachment methods, and cloud data integration across multi-trip lifecycles.
Circular-economy data requirements also create whitespace for intelligent labeling that supports recycling and early digital product passport workflows, especially in Europe. Securikett launched security labels designed for Digital Product Passports in June 2026, while Polytag and Multi-Color Corporation (MCC) partnered in July 2026 to embed invisible UV tag technology into in-mold labeled packaging for traceability. Their initial targeting of frozen food and dairy reflects a focus on segments where packaging performance and end-of-life visibility both matter. Separately, Reelables’ partnership with Hubble Network (July 2026) to connect Bluetooth-enabled smart labels to a large global gateway footprint highlights an operational path toward continuous shipment visibility without dedicated cellular infrastructure, which supports broader adoption of active tracking labels across fragmented logistics lanes.
Recent Industry Developments in Smart Packaging Market
- July 2026: Polytag partnered with Multi-Color Corporation (MCC) to integrate invisible UV tag technology into in-mold labeled (IML) packaging, starting with applications such as frozen food and dairy. The collaboration connects packaging decoration with machine-readable traceability, supporting higher-fidelity sorting and recycling workflows where label-level identification is a bottleneck.
- March 2026: Identiv signed an exclusive agreement with IFCO to develop and supply BLE smart labels for deployment across IFCOs global pool of more than 400 million reusable packaging containers. The deal links active smart-label capability to a scaled returnable-asset network and expands addressable demand beyond unit packs into pooled logistics systems that require standardized, durable identifiers.
- October 2024: Crane NXT acquired the smart packaging assets of TruTag Technologies, adding secure marking and smartphone-based authentication capabilities to its OpSec product security portfolio. The transaction increases competitive intensity in anti-counterfeiting and connected authentication, two demand centers that support intelligent packaging adoption in pharmaceuticals, spirits, and premium CPG.


Smart Packaging Market Report Scope and Research Methodology
Market Definition and Coverage
For this report, smart packaging refers to packaging formats that add a measurable function beyond containment and labeling, such as identification, tracking, condition sensing, or consumer interaction, and the related materials and components needed to enable those functions.
Scope exclusions: We exclude general packaging that only uses standard printing or conventional barcodes without smart, trackable, or sensor-driven functionality.
Segments Covered in This Report
- By Technology
- Active Packaging
- Intelligent Packaging
- Modified Atmosphere Packaging
- By Material
- Paper and Paperboard
- Plastic
- Glass
- Metal
- Biodegradable Polymers
- By Component
- Sensors
- Indicators
- Data Carriers
- Antimicrobial Agents
- By End-user Industry
- Food
- Beverage
- Pharmaceuticals
- Cosmetics and Personal Care
- Electronics
- Other End-user Industries
- By Geography
- North America
- United States
- Canada
- Mexico
- South America
- Brazil
- Argentina
- Rest of South America
- Europe
- Germany
- United Kingdom
- France
- Italy
- Spain
- Rest of Europe
- Asia-Pacific
- China
- Japan
- India
- South Korea
- Australia and New Zealand
- Rest of Asia-Pacific
- Middle East and Africa
- Middle East
- Saudi Arabia
- United Arab Emirates
- Turkey
- Rest of Middle East
- Africa
- South Africa
- Nigeria
- Kenya
- Rest of Africa
- Middle East
- North America
Data Sources, Market Sizing, and Validation
Desk Research
Desk research is used to set the fact base and define what should be counted as smart packaging revenue versus adjacent packaging spend. We refer to public sources such as the United States Census Bureau manufacturing and trade tables, Eurostat production and external trade data, UN Comtrade shipment statistics, and food and drug safety regulators for serialization and traceability requirements.
To connect the market to real adoption signals, we also review patent databases for filings linked to RFID, NFC, printed electronics, and sensing features, followed by peer-reviewed journals that discuss performance limits and typical use cases. Company filings, investor presentations, association websites, and reputable press releases are then used to understand capacity expansion, partnerships, and changes in product mix, while a paid subscription focused on company financials and a separate news and financials feed help cross-check timelines and reported business exposure. These examples are not exhaustive, and many other sources were also used to collect, validate, and clarify data points during the study.
Primary Interviews and Surveys
Primary work is used to pressure-test assumptions that desk research cannot settle cleanly, especially where smart features are bundled into broader packaging contracts. We speak with packaging converters, component and material suppliers, brand owners, and logistics and retail stakeholders, then validate the demand story across APAC, EMEA, and the Americas so one region does not overly shape the model.
Distribution of primary research fieldwork respondents
| Company type | Respondent position | Region |
|---|---|---|
| Top tier: 32% | CXOs: 19% | APAC: 44% |
| Mid tier: 47% | Functional/Unit leaders: 25% | EMEA: 35% |
| Smaller Players: 21% | Managers: 56% | Americas: 21% |
Market-Sizing & Forecasting
Our sizing starts with a top-down build where packaging demand pools are reconstructed by end-use consumption and trade flows, and then filtered by the share of formats that adopt track-and-trace, sensing, or interactive functionality. Once the demand boundary is clear, totals are corroborated with selective bottom-up checks using sampled supplier revenues, channel conversations, and an ASP x volume logic for commonly deployed components.
A few inputs that repeatedly matter in smart packaging are the pace of RFID and NFC tag deployment, labeling and serialization compliance timelines in regulated products, temperature and freshness indicator penetration in cold-chain items, and the mix shift toward connected packs in premium consumer goods. Price progression is handled carefully because smart packaging often has rapid component cost curves. We separately track indicative ASP movement for tags, sensors, and printed electronics before blending it back into packaged solution pricing. For forecasting, we rely on scenario analysis supported by expert views, where adoption rates, regulation intensity, and brand spend on engagement are flexed, and the final path is chosen after checking it against realistic packaging volumes and conversion capacity.
Where data gaps show up in bottom-up validations, we do not force a full roll-up. Instead, we use bounded ranges tied to publicly visible shipments, capacity additions, and repeatable unit economics so the final market total remains explainable.
Data Validation & Update Cycle
Validation is done in layers so that one assumption does not quietly drive the full result. Model outputs are compared with independent signals, including packaging production trends, import and export patterns for key components, and observed adoption in regulated supply chains, and then anomalies are reviewed before sign-off.
If a major variance appears, we revisit the scope boundary, re-check conversion rates, and re-contact relevant interviewees to confirm whether the change reflects real adoption or definition differences. Reports are refreshed annually, with interim updates triggered by material events like regulation changes, large capacity announcements, or sustained pricing shifts. Right before delivery, a final review pass is completed so clients receive the most current view available.
Mordor Intelligence's Smart Packaging Market Size Versus Other Published Estimates
Published market sizes for smart packaging often vary because the same term is used to cover different things, and because pricing and adoption assumptions can move the total quickly. The spread usually comes from how far the scope extends into active packaging, whether component sales are double-counted along the value chain, and how each study treats the timing of regulation-driven adoption.
Key gap drivers in this market are the treatment of track-and-trace versus broader packaging upgrades, the way ASP declines for tags and sensors are modeled, and whether forecasts assume a conservative or aggressive ramp in connected-pack programs across consumer goods. By tracking component-level ASP movement and adoption triggers tied to serialization and cold-chain use cases, Mordor Intelligence keeps the 2026 value aligned to a defined smart-function revenue pool rather than a wider packaging innovation spend.
Benchmark comparison
| Source | Market Size | Gaps in Research Methodology |
|---|---|---|
| Mordor Intelligence | USD 25.84 B (2026) | |
| Global Consultancy A | USD 28.27 B (2024) | Uses an earlier base year and appears to rely on a broader revenue boundary, where interactive packaging and general smart-label activity can be counted without tightly separating enabling components from finished-pack revenue. |
| Industry Consultancy B | USD 25.70 B (2023) | Starts from an older point in time and may blend active, intelligent, and smart packaging definitions, which can change what is included when building the total and can also shift results through different currency timing and adoption ramp assumptions. |
Looking across the three estimates, the main takeaway is that year selection and boundary choices drive most of the difference, not a single data point. When scope is held to smart-function revenues and pricing is checked against realistic component cost curves, the market total becomes easier to trace and to update as adoption signals change.


Key Questions Answered in the Report
How large is the smart packaging market in 2026 and what growth is expected?
The smart packaging market size reached USD 25.84 billion in 2026 and is forecast to hit USD 36.94 billion by 2031, delivering a 7.41% CAGR.
Which technology segment is expanding the fastest?
Intelligent formats, driven by low-cost RFID and real-time data needs, are forecast to grow at a 9.23% CAGR through 2031.
What is fueling smart packaging demand in pharmaceuticals?
Unit-level serialization mandates in the United States, European Union, and India push converters to embed RFID or 2D codes and temperature indicators, supporting an 8.76% CAGR through 2031 for pharmaceutical applications.
Why are biodegradable smart packs gaining traction?
EU regulations require all packaging to be recyclable or compostable by 2030, prompting brands to shift to polylactic-acid and paperboard substrates that integrate compostable freshness indicators.
Which region will grow the quickest?
Asia-Pacific is projected to register the highest regional CAGR at 9.76% thanks to China’s cold-chain investments and India’s serialization drive.
What is the chief barrier for new entrants?
High capital expenditure, often topping USD 15 million per line for sensor integration and chip placement, extends payback periods and limits participation from smaller converters.
Page last updated on:


 Your data is secure and never sold or shared.


