
Market Overview
| Study Period | 2020 - 2031 |
|---|---|
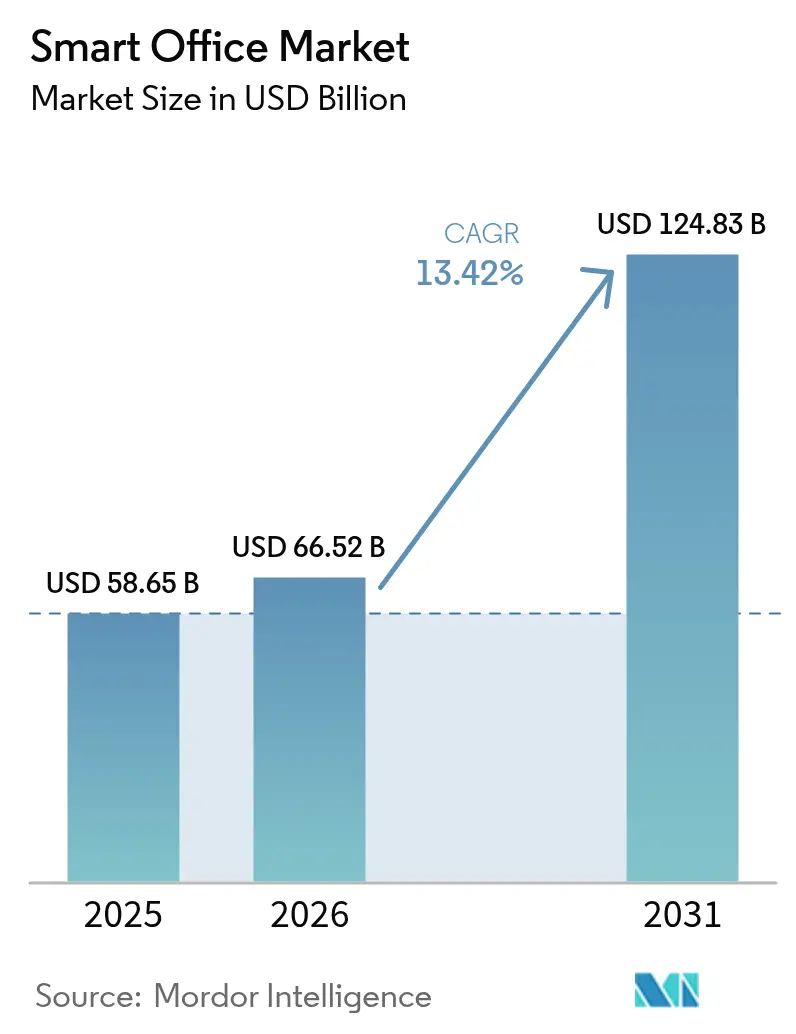
| Market Size (2026) | USD 66.52 Billion |
| Market Size (2031) | USD 124.83 Billion |
| Growth Rate (2026 - 2031) | 13.42 % |
| Fastest Growing Market | Asia Pacific |
| Largest Market | North America |
| Market Concentration | Medium |
Major Players *Disclaimer: Major Players sorted in no particular order Image © Mordor Intelligence. Reuse requires attribution under CC BY 4.0. | |
Smart Office Market Analysis by Mordor Intelligence
The smart office market size in 2026 is estimated at USD 66.52 billion, growing from 2025 value of USD 58.65 billion with 2031 projections showing USD 124.83 billion, growing at 13.42% CAGR over 2026-2031. Growth stems from permanent hybrid work patterns, tightening energy performance mandates, and falling IoT sensor costs, which together shift capital toward sensor networks, cloud platforms, and integration services. Corporate real-estate strategies now emphasize occupancy analytics and demand-responsive systems, redirecting budgets that once went to static fit-outs toward intelligent HVAC, lighting, and energy-management layers.[1]Modular, software-defined architectures are favored over proprietary hardware as the European Union, California, Singapore, and South Korea enact zero-emission or fault-detection standards that compel landlords to retrofit legacy assets with connected controls. Competitive intensity is rising as building-automation incumbents acquire software firms to defend installed bases, while network and cloud vendors bundle building-management features into switching and 5G portfolios. Retrofits dominate near-term spending because they deliver immediate energy savings and avoid the delays and cost inflation facing new construction.
Key Report Takeaways
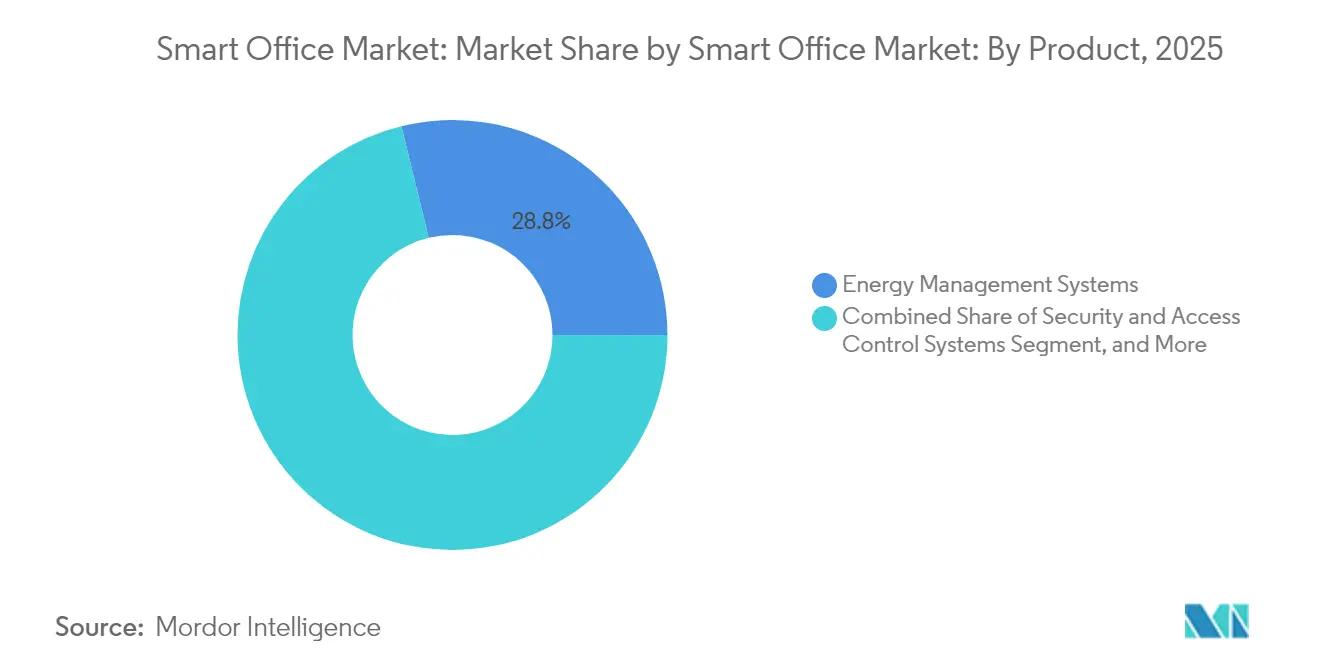
- By product, energy-management systems held 28.82% revenue share in 2025, while smart HVAC control systems are projected to expand at a 14.28% CAGR through 2031.
- By component, hardware led with 45.76% of 2025 revenue, whereas services are forecast to grow at a 14.57% CAGR to 2031.
- By building type, retrofits accounted for 63.72% of the 2025 value and are expected to advance at a 13.88% CAGR during the outlook period.
- By connectivity, Wi-Fi contributed 39.54% of revenue in 2025; however, cellular 4G and 5G are projected to grow at a 15.21% CAGR through 2031.
- By geography, North America accounted for 36.12% of 2025 revenue; the Asia Pacific is forecast to post the fastest CAGR of 14.05% to 2031.
Note: Market size and forecast figures in this report are generated using Mordor Intelligence’s proprietary estimation framework, updated with the latest available data and insights as of 2026.
Market Trends and Insights
Drivers Impact Analysis of Smart Office Market*
| Driver | (~) % Impact on CAGR Forecast | Geographic Relevance | Impact Timeline |
|---|---|---|---|
| Growing hybrid and flexible working models | +2.8% | Global, led by North America and Europe | Medium term (2-4 years) |
| Increasing focus on energy efficiency and sustainability mandates | +3.2% | Europe and Asia Pacific, spillover to North America | Long term (≥4 years) |
| Declining IoT sensor and connectivity module prices | +1.9% | Global | Short term (≤2 years) |
| Workplace wellness and indoor-air-quality regulations | +1.6% | North America and Europe, emerging in Asia Pacific | Medium term (2-4 years) |
| AI-based space utilization optimization | +2.3% | North America and Asia Pacific | Medium term (2-4 years) |
| Government-backed smart-building initiatives | +1.8% | Asia Pacific, Middle East, selective North America | Long term (≥4 years) |
| Source: Mordor Intelligence | |||
Growing Hybrid and Flexible Working Models
Hybrid work is now the default operating model for large employers, raising demand for real-time occupancy analytics that match HVAC and lighting output to headcount. In 2024, 68% of Fortune 500 companies used flexible seating, up from 41% in 2020.[2]Reduced occupancy has pushed landlords to install granular monitoring that demonstrates efficiency to tenants and supports premium rents. Properties with certified smart-building credentials captured lease rates 8-12% above non-instrumented peers. The shift accelerates cloud-based building-management adoption that integrates with collaboration tools to synchronize cleaning, HVAC setpoints, and room availability.
Increasing Focus on Energy Efficiency and Sustainability Mandates
Climate policy has become the most durable demand driver. The EU’s Energy Performance of Buildings Directive recast mandates zero-emission status for new non-residential buildings by 2028 and sets renovation targets for 42% of existing stock by 2033. Germany requires an automation class B for buildings over 1,000 m². California’s 2024 Title 24 update requires fault detection in HVAC systems exceeding 54,000 BTU/h. South Korea’s expanded certification scope covers all commercial properties over 3,000 m². Such rules create a compliance floor that insulates the smart office market from macro cycles.
Declining IoT Sensor and Connectivity Module Prices
Rapid price deflation is democratizing adoption. Bluetooth Low Energy SOCs averaged USD 1.20 in Q1 2024, down from USD 2.10 in 2022.[3] Wi-Fi 6E access points fell below USD 150 in volume buys, enabling whole-floor sensor meshes for buildings as small as 10,000 ft². Newly released 5G RedCap modules cost USD 8-12 per endpoint, half the price of legacy LTE Cat-1 units, allowing direct cloud connectivity without gateways. Lower hardware costs compress payback times from 48-60 months in 2020 to 24-36 months.
AI-Based Space Utilization Optimization
AI shifts space management from reactive scheduling to predictive allocation. Companies using AI-powered analytics reduce their real-estate footprints by 18% while maintaining steady employee satisfaction, saving USD 4,000-6,000 per employee in high-cost cities.[4]Siemens’ Enlighted deployments showed 23-29% energy savings compared to static schedules. Edge inference gains importance as latency-sensitive air-quality adjustments require sub-second response.
Restraints Impact Analysis of Smart Office Market*
| Restraint | (~) % Impact on CAGR Forecast | Geographic Relevance | Impact Timeline |
|---|---|---|---|
| Security concerns relating to IoT devices and data | –1.4% | Global, acute in Europe and North America | Medium term (2-4 years) |
| High retrofit costs for legacy buildings | –1.8% | North America and Europe | Short term (≤2 years) |
| Interoperability gaps across vendor ecosystems | –1.1% | Global | Medium term (2-4 years) |
| Slow decision cycles in commercial real estate | –0.9% | North America and Europe | Long term (≥4 years) |
| Source: Mordor Intelligence | |||
Security Concerns Relating to IoT Devices and Data
Intrusions into building-automation networks increased, with 37 confirmed incidents reported in the United States alone in 2023. The EU’s NIS2 directive classifies large commercial buildings as essential entities, imposing audit obligations that can exceed EUR 200,000 per year. Data-residency rules compel vendors to localize their cloud infrastructure, which can fragment service delivery and increase operating costs, particularly for tenants in financial services and healthcare.
High Retrofit Costs for Legacy Buildings
Buildings erected before 2000 often require extensive rewiring and controller replacement, which can push upgrade costs to USD 15-25 per square foot. A 2024 Urban Land Institute study found internal rates of return below 6% for full smart-retrofit programs in Class B and C offices. Limited access to green-financing instruments further constrains adoption in secondary markets, while rent-control regimes restrict pass-through of capital costs.
*Our forecasts treat driver/restraint impacts as directional, not additive. The impact forecasts reflect baseline growth, mix effects, and variable interactions.
Smart Office Market Segment Analysis
By Product:
Energy Management Leads, HVAC AcceleratesEnergy-management platforms accounted for 28.82% of 2025 revenue, the largest slice of the smart office market share. Demand-response incentives of USD 50-150 per curtailed kilowatt make participation financially attractive, and Johnson Controls reported 2 GW of commercial load enrolled under its OpenBlue platform in 2024. Smart HVAC controls are projected to expand at a 14.28% CAGR, the fastest among all products, aided by refrigerant phasedowns that trigger equipment upgrades compatible with lower global warming potential (GWP) gases. Security and access systems continue to benefit from the adoption of biometric and zero-trust technologies in regulated sectors. Fire and safety controls are incorporating NFPA 72-compliant wireless supervision, while smart lighting gains momentum through utility-backed LED rebate schemes that shorten paybacks to under 18 months.
Incremental demand is now tied to measurable outcomes, not just hardware counts. Energy dashboards that demonstrate kilowatt-hour savings help landlords justify premium service fees, and predictive maintenance modules embedded in HVAC controllers reduce unplanned downtime, which historically eroded tenant satisfaction. Combined, these factors solidify energy management and HVAC as twin growth engines within the larger smart office market.

By Component:
Hardware Dominates, Services SurgeHardware held 45.76% of 2025 revenue as sensors, controllers, and edge gateways remain foundational to any deployment. Services, however, are forecast to grow at a 14.57% CAGR, outpacing hardware as owners pivot toward outcome-based contracts. Schneider Electric’s EcoStruxure crossed 1 million connected devices in 2024, embedding ML models that optimize chiller staging without manual intervention. The smart office market size allocated to managed services is expanding as integrators package hardware, cloud licenses, and continuous commissioning into multi-year agreements.
Complexity fuels this service uptick. A typical enterprise footprint incorporates 8-12 discrete system categories, and few facility teams have the expertise to harmonize protocols across HVAC, lighting, metering, and conferencing. Systems integrators now carry performance risk, guaranteeing kilowatt-hour reductions or uptime, and recuperate costs through recurring fees that convert capex into opex. Meanwhile, hardware commoditization continues, but edge devices that host AI inference locally maintain pricing power due to latency and data-sovereignty needs.
By Building Type:
Retrofit Economics Drive Majority ShareRetrofits generated 63.72% of 2025 revenue and are expected to log a 13.88% CAGR, underscoring the economic logic of upgrading existing stock. New-build projects typically embed connected controls by default; however, they often face longer development timelines, higher interest rates, and material-cost inflation, which limit near-term volume. Legislation such as New York City’s Local Law 97 charges carbon penalties starting in 2024, making energy-wasting buildings financially untenable. The smart office market size tied to retrofits, therefore, dominates budgets because energy savings and demand-response incentives start the moment systems come online.
Technical hurdles remain. Buildings with asbestos-laden ceilings or historic-preservation façades complicate sensor placement and conduit routing. Power over Ethernet offers an elegant retrofit path by combining data and power over existing structured cabling, reducing labor costs by up to 40%. Wireless sensor networks using Zigbee or Thread can bypass shaft drilling but may struggle in environments with dense steel. New buildings benefit from integrated design, yet the 2-4% premium on total construction budgets continues to be a negotiation point between developers and anchor tenants.

By Connectivity Technology:
Wi-Fi Leads, Cellular Gains MomentumWi-Fi accounted for 39.54% of the 2025 value, leveraging the widespread adoption of enterprise LAN infrastructure and the maturity of Wi-Fi 6/6E standards, which provide deterministic latency under 10 ms. Cellular 4G and 5G are forecast to post the fastest 15.21% CAGR as private networks unlock on-premises data processing and guarantee QoS for latency-sensitive tasks. Carrier Global announced that 15% of its new controllers shipped with embedded cellular modems in 2024, a significant increase from negligible levels two years prior.
Bluetooth Low Energy dominates battery-powered sensors, offering multiyear autonomy. Zigbee and Thread, now unified under the Matter 1.2 spec, are winning lighting and shading projects where low power and local control trump cloud reach. Ethernet and Power over Ethernet continue to serve high-bandwidth devices, such as 4K PTZ cameras, aided by IEEE 802.3bt’s 90-watt power budget. As Wi-Fi 7 certification rolls out, multi-link operation that bonds 2.4, 5, and 6 GHz bands promises further gains in latency and reliability.
Geography Analysis
North America Smart Office Market
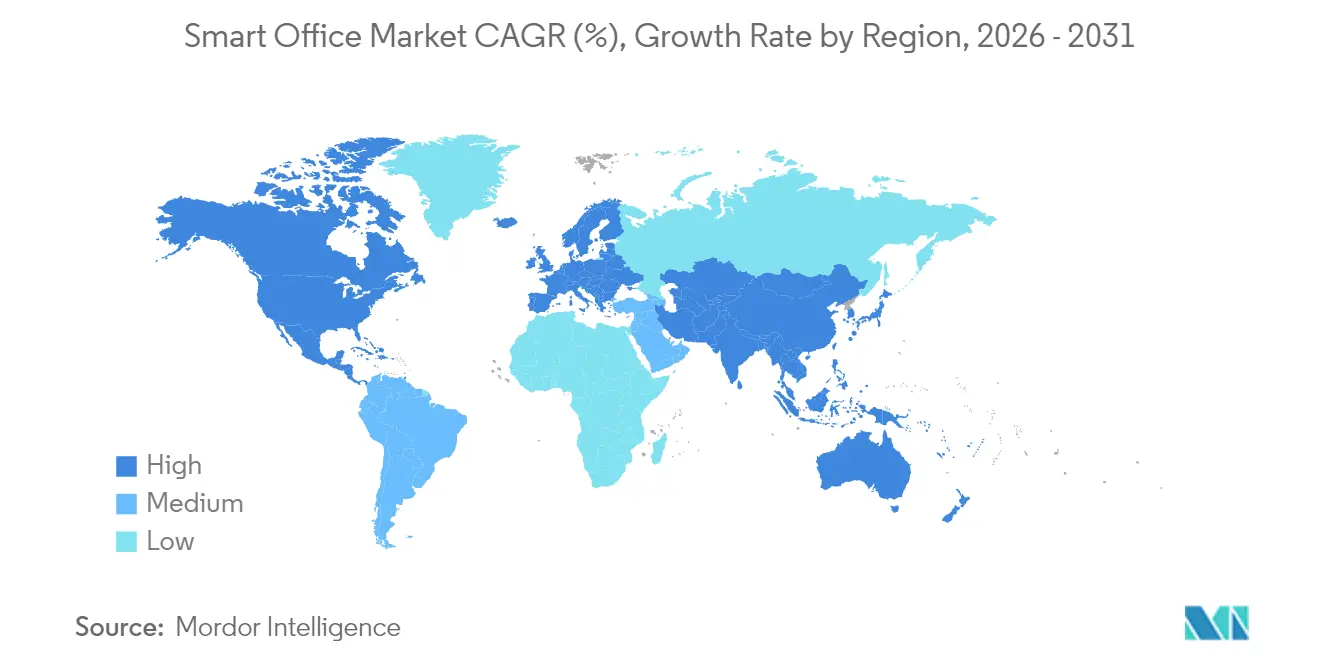
North America generated 36.12% of 2025 revenue and retains the largest smart office market share due to mature commercial real estate inventory, stringent coastal energy codes, and tenant demand for WELL and LEED certifications. Growth moderates to high single digits as the installed base deepens, but retrofit volume remains resilient thanks to New York’s carbon fines and California’s Title 24 updates. Federal tax incentives for high-efficiency HVAC under the Inflation Reduction Act further support ROI models, especially for campuses that pair heat-pump retrofits with solar power purchase agreements.
APAC and Middle East Smart Office Market
Asia Pacific is projected to record a 14.05% CAGR, the fastest regional pace, underpinned by China’s expansion of its Three-Star Green Building Standard to all public buildings over 20,000 m². India’s Smart Cities Mission continues to funnel capital toward connected infrastructure in Pune, Surat, and Ahmedabad, while Japan subsidizes up to 50% of BEMS installations for SMEs. The Middle East follows with gigascale projects, such as Saudi Arabia’s NEOM, which stipulates 100% renewable power and AI-driven building control, creating showcase opportunities for global vendors.
Europe and the Americas Smart Office Market
Europe sits between these poles. The Energy Performance of Buildings Directive imposes binding renovation quotas that pull forward demand for building automation, and Germany’s subsidy programs cover up to 40% of retrofit outlays. However, inflationary pressure and higher cost of capital temper volume, particularly in Southern Europe where real-estate yields remain compressed. South America grows modestly as multinationals enforce corporate sustainability standards on regional headquarters, but financing and technical-skills gaps slow uptake outside São Paulo, Mexico City, and Santiago.
Regulatory Landscape
Smart office deployments are increasingly shaped by energy-performance mandates and cyber requirements that affect connected HVAC, lighting, access control, and workplace platforms. In Europe, the Energy Performance of Buildings Directive (Recast) (Directive 2024/1275) raises the compliance floor for building controls, while the EU Cyber Resilience Act (Regulation (EU) 2024/2847) introduces security-by-design obligations for products with digital elements used in smart buildings. Separately, EU AI Act obligations for high-risk AI systems become binding on 2 August 2026, creating practical requirements around human oversight, logging, and governance for AI-enabled building automation and analytics used by deployers and property owners.
Outside the EU, cyber baselines and labeling programs are tightening procurement specifications. Australia brought the Cyber Security (Security Standards for Smart Device) Rules 2025 into effect on 4 March 2026, and the United States continues to operationalize IoT security guidance through NIST publications, including the April 2026 update to NIST IR 8259 and the June 2026 initial public draft of NIST SP 800-213r1 for federal IoT product cybersecurity guidance. In Asia, Japan updated its JC-STAR IoT security labeling scheme with STAR-3 requirements for network devices and network cameras on 13 July 2026, while China implemented GB/T 46455-2025 (smart system evaluation parameters and methods) on 1 February 2026, reinforcing standardization expectations that influence device selection and integration practices.
Value Chain Analysis
The smart office value chain spans device and subsystem OEMs (sensors, controllers, HVAC and lighting controls, access and video), connectivity and network infrastructure providers (Wi-Fi, Ethernet/PoE, cellular modules), and software layers that aggregate and contextualize signals (building management, energy management, IWMS, and workplace experience applications). Systems integrators, facility-service providers, and cloud partners translate these components into retrofit and new-build deployments through site surveys, commissioning, cybersecurity hardening, and ongoing managed services, with interoperability across protocols (for example, BACnet and IP-based architectures) becoming a key factor in vendor selection.
Upstream dependencies include semiconductor and module supply for IoT endpoints and enterprise networking hardware, while downstream value capture is increasingly concentrated in recurring software and services tied to outcomes such as energy savings and utilization analytics. Platform vendors are using security certifications and faster integration toolchains to reduce deployment friction for multi-site portfolios, as seen with Johnson Controls launching Metasys 16.0 in June 2026 with expanded software integration capabilities and alignment to IEC 62443-4-2 Security Level 2. As buyers standardize procurement around audit-ready cybersecurity and compliance documentation, the chain is shifting from one-off hardware projects toward lifecycle services, continuous monitoring, and upgrade programs that keep buildings aligned with evolving rules and IT security policies.
Competitive Landscape
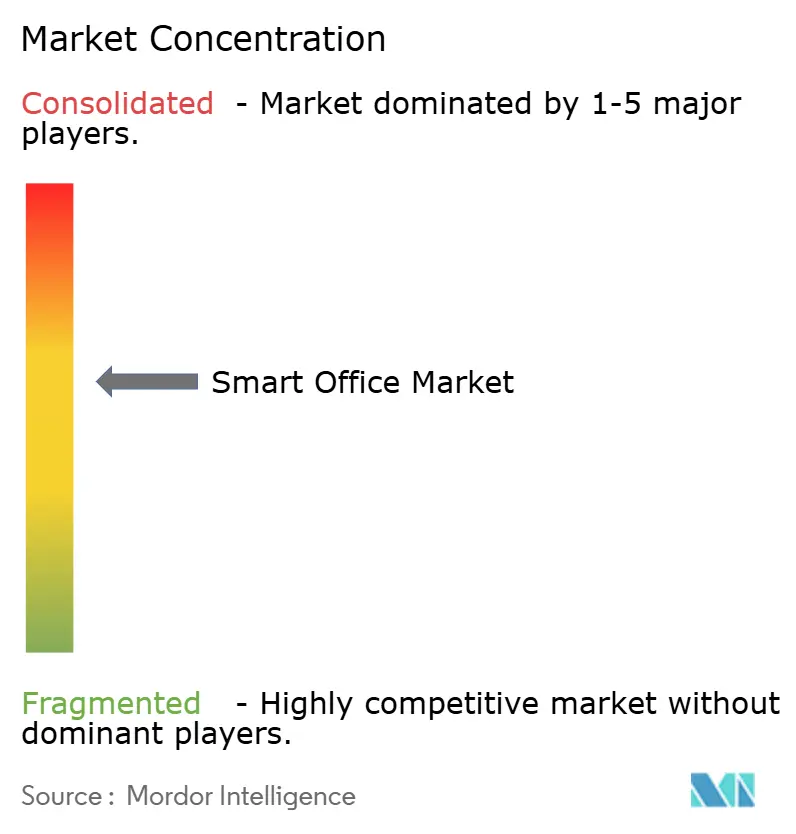
The smart office market remains moderately fragmented, with the top ten vendors holding a significant combined share, leaving room for regional integrators and software-first entrants. Building-automation leaders Johnson Controls, Siemens, Schneider Electric, and Honeywell are acquiring cloud-native firms to embed analytics into legacy controllers. Siemens paid USD 1.575 billion for Brightly Software in January 2024 to enhance its predictive maintenance and asset management features. Cisco and Huawei bundle building-management functions into their switching portfolios, leveraging network dominance to upsell smart-office capabilities.
Lighting specialists, such as Philips and Legrand, extend into occupancy sensing and space analytics, leveraging the ability of PoE to power both fixtures and data links. Smaller players carve niches: PointGrab supplies edge-AI occupancy chipsets, and Telit Cinterion focuses on cellular modules, feeding the broader ecosystem without competing head-to-head on full platforms. Patent filings in occupancy sensing surpassed 200 in 2024, signaling a shift in differentiation from sensor accuracy to software intelligence and multi-vendor interoperability.
Standards development is now a competitive lever. Firms that contribute to Matter, BACnet, and ONVIF gain early insight into protocol road maps that shape product architecture. Cybersecurity has also emerged as a deal-breaker in financial-services and healthcare verticals; Crestron’s XiO Cloud earned UL 2900-2-2 certification in February 2024. Vendors that can prove hardened security stacks win preferential access to risk-averse tenants, reinforcing a bifurcation between consumer-grade and enterprise-grade solutions.
Smart Office Industry Leaders
-
Johnson Controls International PLC
-
Cisco Systems Inc.
-
Siemens AG
-
Schneider Electric SE
-
Honeywell International Inc.
- *Disclaimer: Major Players sorted in no particular order
Smart Office Market Companies Covered in this Report
- Johnson Controls International plc
- Cisco Systems Inc.
- Carrier Global Corporation
- Siemens AG
- Schneider Electric SE
- Koninklijke Philips N.V.
- Honeywell International Inc.
- ABB Ltd.
- Lutron Electronics Co. Inc.
- Crestron Electronics Inc.
- Legrand SA
- CommScope Holding Company Inc.
- Delta Electronics Inc.
- Huawei Technologies Co. Ltd.
- Google LLC (Google Nest for Enterprise)
- Samsung Electronics Co. Ltd.
- Somfy SA
- Hubbell Incorporated
- Eaton Corporation plc
- Axis Communications AB
- Advantech Co. Ltd.
- Telit Cinterion GmbH
- Avnet Inc. (IoT Solutions)
- PointGrab Ltd.
Market Opportunities and Future Outlook
Retrofit-led demand creates whitespace for solutions that compress design-to-commission timelines and reduce wiring disruption in occupied buildings, especially where energy mandates and carbon-penalty regimes influence capital plans. Procurement is also moving toward security and governance artifacts (device assurance, logging, and lifecycle patching), creating room for vendors and integrators that package compliance-ready architectures aligned to NIST IoT guidance updates, including the NIST IR 8259 Revision 1 released in April 2026, and region-specific device security rules such as Australia’s smart-device security standards that commenced in March 2026.
A second opportunity area is the convergence of workplace experience software with building operations data, driven by platform consolidation and IT-OT integration. Ricoh's April 2026 follow-on investment in Butlr Technologies to integrate occupancy sensing into the RICOH Spaces platform indicates continued interest in translating occupancy telemetry into space planning and operational workflows, while LumApps' move to acquire Comeen (announced April 2026) points to consolidation around unified workplace platforms that blend space management, visitor services, and digital signage. On the services side, large-scale enterprise commitments to AI-enabled digital workplace operating models, including HCLTech's July 2026 deal for an AI-driven workplace operating model, reinforce a growing spend pool for integration, managed services, and analytics that connect employee experience tools with building systems and network data.
Recent Industry Developments in Smart Office Market
- June 2026: Johnson Controls launched Metasys 16.0, updating its building automation platform with new software integration tools and cybersecurity alignment to IEC 62443-4-2 Security Level 2. The release emphasizes faster implementation through low-code style integration workflows, which supports multi-site standardization for owners managing complex retrofit portfolios.
- November 2025: Johnson Controls introduced Metasys 15.0, extending its building automation system roadmap ahead of the next major platform cycle. The update strengthened the company's ability to refresh installed bases with newer software and security capabilities while maintaining continuity with existing building control deployments.
- August 2024: Honeywell and Cisco announced a collaboration to link Honeywell Forge Sustainability+ for Buildings with Cisco Spaces to use occupancy intelligence for adapting HVAC operation. The pairing connects IT network-derived location context with building systems, supporting integrated energy-management use cases that many enterprises pursue in hybrid-work office environments.
Smart Office Market Report Scope and Research Methodology
Market Definition and Coverage
This market includes solutions used to automate, monitor, and manage office buildings and workplaces using connected devices, software platforms, and related services. The scope is the spending that supports better energy use, safety, and employee experience in commercial facilities.
Scope exclusions: We do not count consumer smart-home-only devices unless they are deployed as part of an office or commercial workplace system.
Segments Covered in This Report
- By Product
- Security and Access Control Systems
- Energy Management Systems
- Smart HVAC Control Systems
- Audio-Video Conferencing Systems
- Fire and Safety Control Systems
- Other Products
- By Component
- Hardware
- Software Platforms
- Services (Integration, Managed, Consulting)
- By Building Type
- Retrofits
- New Buildings
- By Connectivity Technology
- Wi-Fi
- Bluetooth Low Energy (BLE)
- Zigbee and Thread
- Wired Ethernet / PoE
- Cellular (4G/5G)
- By Geography
- North America
- United States
- Canada
- South America
- Brazil
- Mexico
- Rest of South America
- Europe
- Germany
- United Kingdom
- France
- Spain
- Italy
- Rest of Europe
- Asia Pacific
- China
- India
- Japan
- Australia
- South Korea
- Rest of Asia Pacific
- Middle East and Africa
- Middle East
- Saudi Arabia
- United Arab Emirates
- Qatar
- Turkey
- Rest of Middle East
- Africa
- South Africa
- Nigeria
- Kenya
- Rest of Africa
- Middle East
- North America
Data Sources, Market Sizing, and Validation
Desk Research
Desk research is where the market boundary and the initial demand picture are built, before assumptions are tested with real-world feedback. We review public sources such as the US Energy Information Administration (EIA) for energy indicators, the US General Services Administration (GSA) and similar public building agencies for building modernization signals, and standards bodies such as ISO and NIST for security and interoperability context.
To anchor the model in measurable activity, we also use sources such as the US Census Bureau construction and building statistics, International Energy Agency (IEA) publications for building energy trends, and peer-reviewed papers on occupancy sensing, building automation, and indoor environmental quality. In addition, company filings, investor presentations, association websites, and credible business press were used to map solution adoption patterns and typical pricing logic. A paid subscription covering company financials and news intelligence and a patent database were referenced selectively to cross-check supplier momentum and product direction. These desk research sources are not exhaustive, and many other public references were also used for data collection, validation, and clarification.
Primary Interviews and Surveys
Primary work was used to confirm what is actually being deployed in offices, how budgets are split across hardware, software, and services, and how retrofit activity differs from new buildings. Interviews and surveys covered solution suppliers, system integrators, facility teams, and large enterprise users across major regions, so gaps from desk research could be closed and assumptions could be stress-tested before totals were finalized.
Distribution of primary research fieldwork respondents
| Company type | Respondent position | Region |
|---|---|---|
| Top tier: 35% | CXOs: 16% | APAC: 43% |
| Mid tier: 49% | Functional/Unit leaders: 37% | EMEA: 36% |
| Smaller Players: 16% | Managers: 47% | Americas: 21% |
Market-Sizing & Forecasting
Sizing starts from a top-down build that reconstructs the addressable smart office spend by tracking commercial building activity, then applying adoption and spend-intensity assumptions by solution type and region. Once the structure is in place, the totals are corroborated using selective bottom-up checks, including sampling typical project value ranges, converting installed volumes into spend using observed price bands, and validating the component mix split.
Key inputs used in the model include smart building retrofit intensity, new commercial building additions, connectivity mix (for example, Wi-Fi versus cellular readiness), office occupancy and space utilization shifts, energy management prioritization, and security and access control upgrade cycles. These indicators help explain why some countries pull forward spending faster, and why services often increase as the installed base matures. For forecasting, we use scenario analysis supported by a simple multivariate regression view on demand drivers (for example, construction activity and energy-cost pressure). The outlook is then adjusted based on what primary respondents expect for budget timing and refresh cycles. Where bottom-up signals are missing for smaller geographies, gaps are handled through regional proxies and penetration-rate ranges that are rechecked during validation calls.
Data Validation & Update Cycle
Validation is done by triangulating the model output against independent signals such as regional adoption narratives, component mix expectations, and price progression checks that match how solutions are sold and renewed. If a country-level output moves outside a reasonable band, the assumptions are revisited, and follow-up primary calls are triggered to confirm whether the change is real or driven by an input issue.
Before sign-off, the work goes through multi-step analyst reviews to look for breaks in logic across regions, unusual growth spikes, and inconsistent component shares. Reports are refreshed annually, with interim updates when material events change demand, pricing, or deployment cycles. Right before delivery, a final pass is completed so clients receive the latest updated view using the newest available public signals and confirmed expert inputs.
Mordor Intelligence's Smart Office Market Estimate Compared With Other Published Estimates
Different published market sizes for smart office usually do not match because the category boundary is not the same across studies, and the timing of what gets counted can vary. In our checks, the biggest differences typically come from how hardware, software, and services are bundled, and whether "smart workplace" tooling outside building systems is included.
Connectivity mix trends, retrofit-led spending signals, and component shares such as hardware weight in the installed base are the practical clues that keep the Mordor Intelligence estimate aligned to office-focused deployments that can be tracked and validated at a regional level. When another estimate leans more on broader workplace transformation spend or uses a different base year and conversion timing, the number can shift even if the growth story sounds similar.
Benchmark comparison
| Source | Market Size | Gaps in Research Methodology |
|---|---|---|
| Mordor Intelligence | USD 66.52 B (2026) | |
| Global Advisory A | USD 62.40 B (2025) | Uses a different base year and can include adjacent workplace wellness and experience spending that is not always tied to building automation deployments, which shifts totals even before forecasting. |
| Industry Publisher B | USD 53.90 B (2024) | Earlier base-year anchoring and a narrower counted spend in some deployments can depress the starting point, and it may apply different price and mix progression for hardware versus services. |
The comparison shows that most of the spread is explained by base-year choice and what is treated as in-scope smart office spend versus adjacent digital workplace programs. By keeping the model tied to measurable deployment signals and a consistent component and building-type boundary, the final number stays traceable to clear inputs and can be repeated during refresh cycles.
Key Questions Answered in the Report
How large is the smart office market in 2026 and what growth is expected?
The smart office market size is USD 66.52 billion in 2026 and is projected to reach USD 124.83 billion by 2031 on a 13.42% CAGR.
Which product category currently generates the highest revenue?
Energy-management systems lead, accounting for 28.82% of 2025 revenue.
Which component is forecast to grow the fastest?
Services are expected to expand at a 14.57% CAGR through 2031 as owners favor outcome-based contracts.
Why are retrofits more attractive than new-build projects?
Retrofits deliver immediate energy savings and help avoid carbon penalties under rules such as New York City’s Local Law 97.