
Smart Mining Market Size and Share
Market Overview
| Study Period | 2020 - 2031 |
|---|---|
| Market Size (2026) | USD 18.77 Billion |
| Market Size (2031) | USD 31.86 Billion |
| Growth Rate (2026 - 2031) | 11.16 % |
| Fastest Growing Market | Middle East |
| Largest Market | Asia Pacific |
| Market Concentration | Medium |
Major Players *Disclaimer: Major Players sorted in no particular order Image © Mordor Intelligence. Reuse requires attribution under CC BY 4.0. | |
Smart Mining Market Analysis by Mordor Intelligence
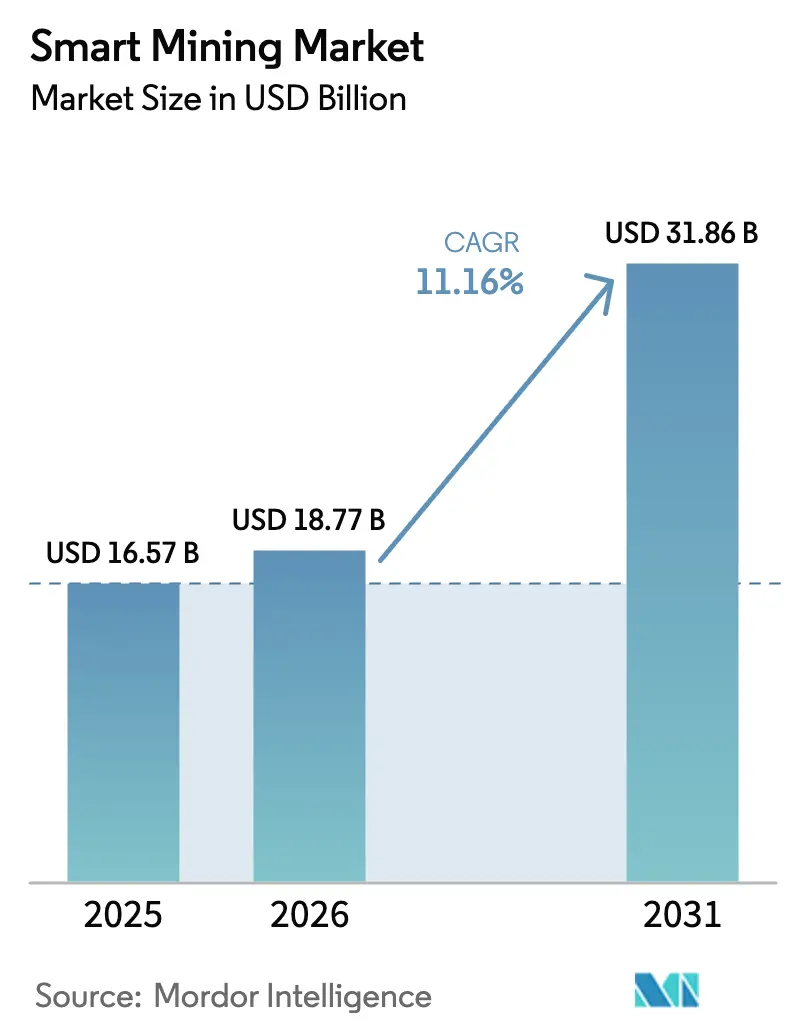
The smart mining market size is projected to be USD 16.57 billion in 2025, USD 18.77 billion in 2026, and reach USD 31.86 billion by 2031, growing at a CAGR of 11.16% from 2026 to 2031. The uptrend is powered by accelerated autonomous-haulage deployments, real-time analytics for predictive maintenance, and the roll-out of private 5G that links thousands of sensors with sub-10-millisecond latency. Demand for battery-grade lithium, cobalt, and rare earths pushes investors toward digitally enabled extraction that trims energy use and water intensity while meeting stricter emissions caps. Original equipment manufacturers expand digital twins and fleet-management software to capture aftermarket service revenue, while pure-play analytics vendors focus on ore-grade prediction and energy optimization. Integration complexity, cybersecurity exposure, and skills shortages still constrain mid-tier operators, who cannot always justify four-year payback cycles.
Key Report Takeaways
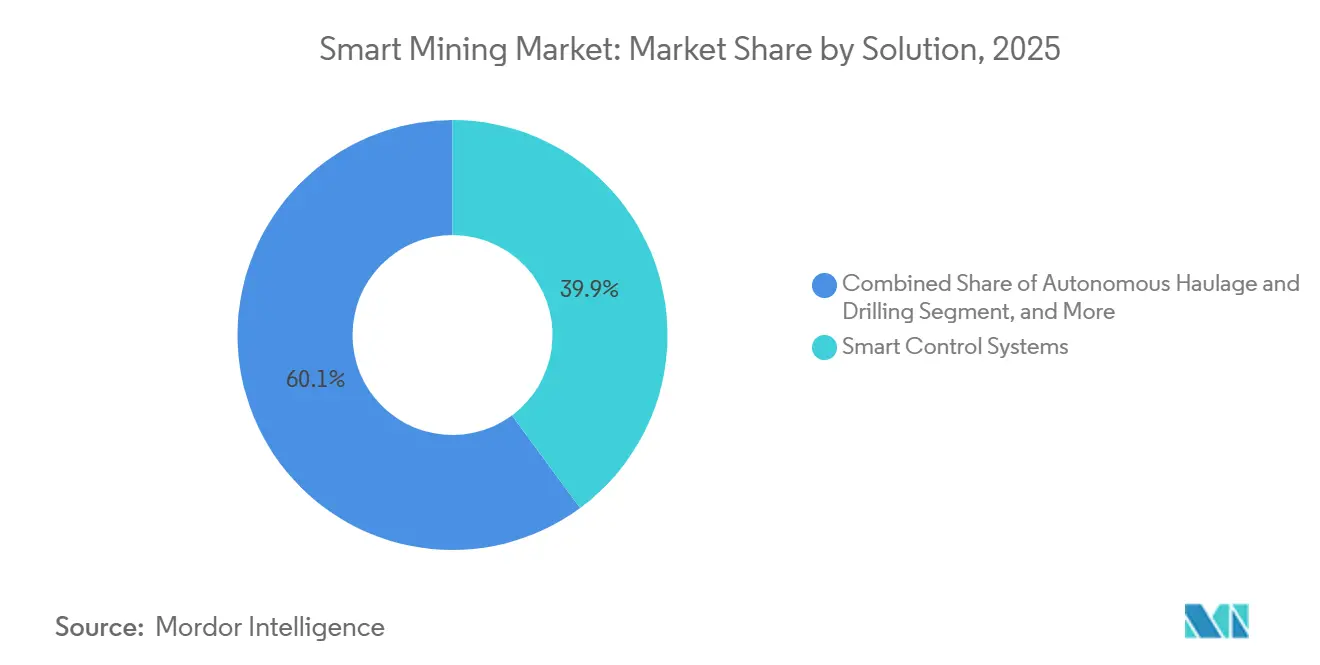
- By solution, control systems accounted for 39.87% of the smart mining market share in 2025, while autonomous haulage and drilling are set to expand at a 12.57% CAGR through 2031.
- By service type, system integration captured 47.63% of the smart mining market share in 2025, whereas managed services are forecast to grow at an 11.93% CAGR through 2031.
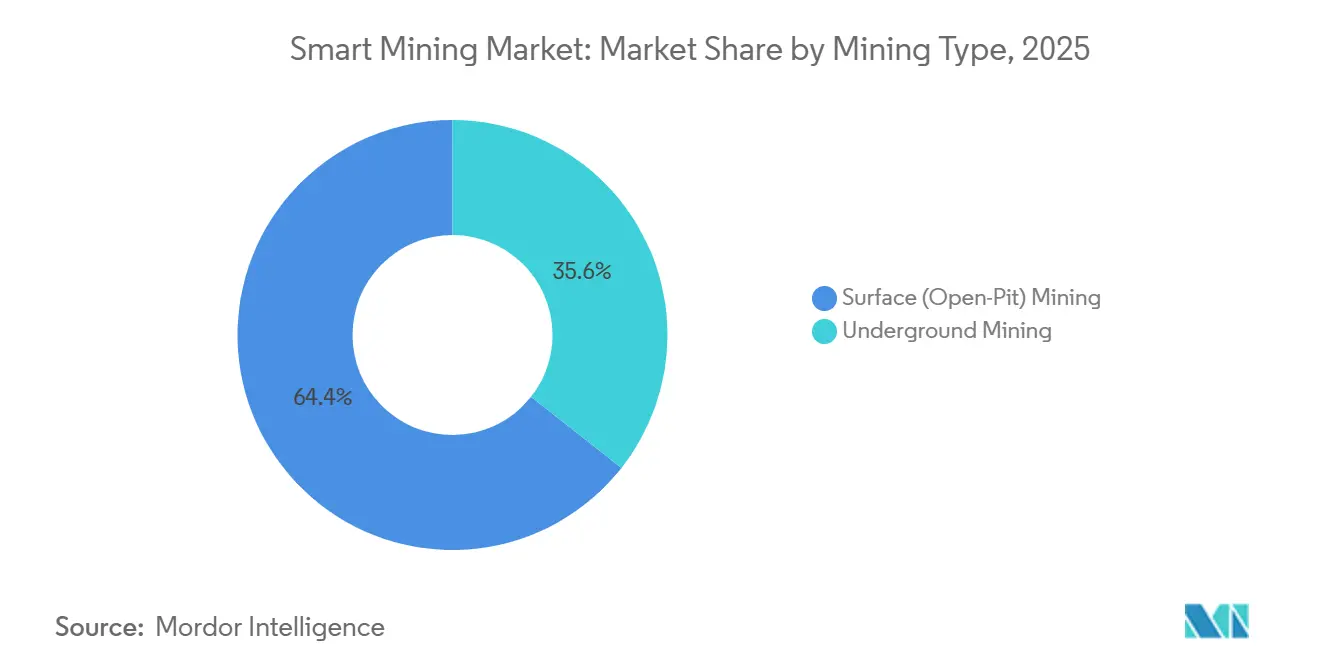
- By mining type, surface operations accounted for 64.39% of the smart mining market share in 2025, but underground automation is advancing at an 11.54% CAGR to 2031.
- By technology, IoT platforms secured a 42.91% share in 2025, yet AI and analytics are the fastest-growing segment, with a 12.14% CAGR through 2031.
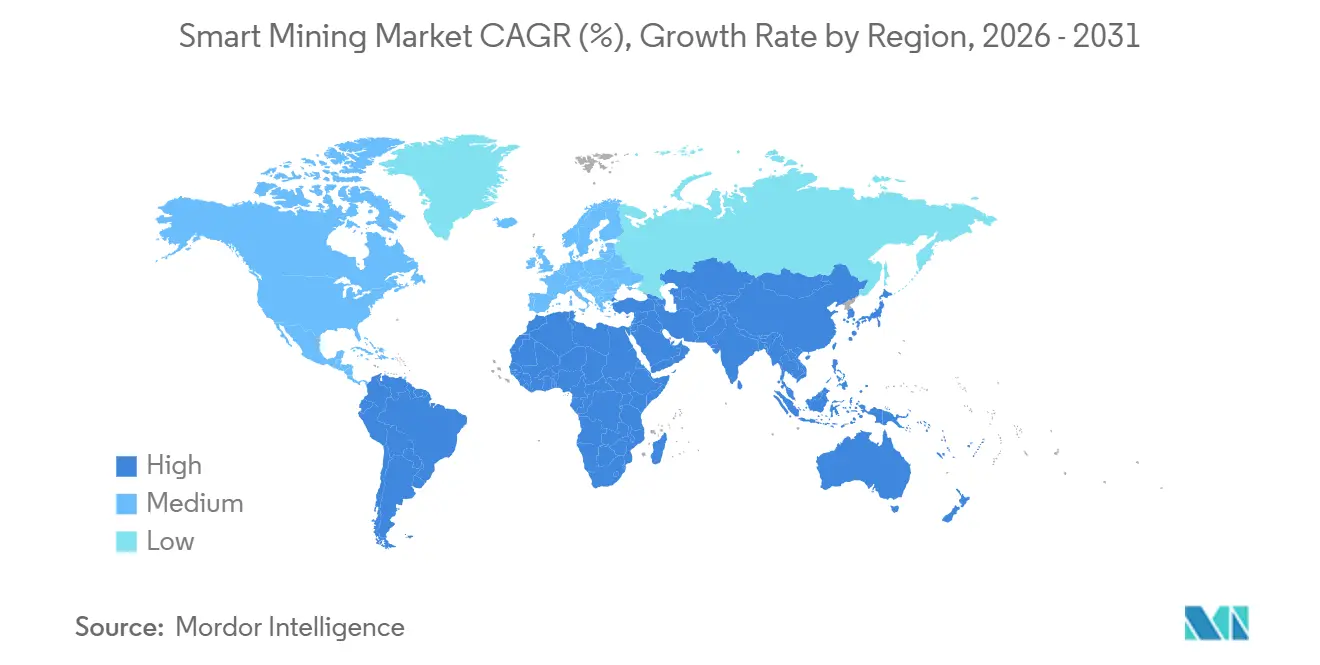
- By geography, Asia Pacific led with 35.24% of 2025 revenue, while the Middle East is on track for a 12.19% CAGR to 2031.
Note: Market size and forecast figures in this report are generated using Mordor Intelligence’s proprietary estimation framework, updated with the latest available data and insights as of January 2026.
Market Trends and Insights
Drivers Impact Analysis of Smart Mining Market*
| Driver | (~) % Impact on CAGR Forecast | Geographic Relevance | Impact Timeline |
|---|---|---|---|
| Autonomous haulage adoption | +2.3% | Australia, Canada, Chile, other global open-pit hubs | Medium term (2-4 years) |
| IoT-AI predictive maintenance | +1.8% | North America and Europe early adopters, global scalability | Short term (≤ 2 years) |
| Safety-driven monitoring demand | +1.2% | North America, China, South Africa | Short term (≤ 2 years) |
| Private 5G roll-outs | +1.6% | Australia, India, Spain and other pilot markets | Medium term (2-4 years) |
| Sustainability-linked financing incentives | +1.4% | Europe and North America core, Asia Pacific emerging | Long term (≥ 4 years) |
| Surge in critical-mineral demand | +2.9% | Australia, Chile, Democratic Republic of Congo, China | Long term (≥ 4 years) |
| Source: Mordor Intelligence | |||
Autonomous Haulage Adoption
Fleet-scale driverless trucks eliminate shift change downtime and feed geospatial telemetry into mine-planning algorithms that refine pit strategy in real time. Rio Tinto operated more than 360 autonomous haul trucks in the Pilbara during 2025 and lifted tonne-kilometers per liter of diesel by 15% compared with crewed fleets.[1]Rio Tinto, “Autonomous Haulage Systems,” riotinto.com Komatsu’s FrontRunner platform now manages mixed fleets at Nevada Gold Mines, targeting around-the-clock utilization rates that manual operations cannot sustain. Retrofitting a 400-ton truck costs USD 500,000-800,000, so miners in low-labor-cost jurisdictions defer purchases until commodity prices stabilize. Fragmented approval processes in Latin America and Africa extend commissioning by up to 12 months, yet operators that move early secure double-digit production gains over peers.
IoT-AI Predictive Maintenance
Sensor networks and edge analytics engines shift unplanned downtime into scheduled work windows, protecting throughput and spare parts budgets. ABB’s Ability platform at 47 mines cut maintenance expense by 12% and raised overall equipment effectiveness by 9% through vibration and oil-quality monitoring that predicts bearing failures weeks in advance.[2]ABB Ltd., “ABB Ability for Mining,” abb.com SAP linked its Asset Intelligence Network with Deloitte models to reduce emergency conveyor repairs by 18% at a Chilean copper site. Industrial accelerometer prices fell from USD 120 in 2020 to USD 35 in 2025, expanding addressable fleets. Legacy supervisory control and data-acquisition systems still resist plug-and-play sensors, and data-science capability remains scarce outside top-tier companies.
Private 5G Roll-Outs
Standalone 5G delivers deterministic latency and guaranteed bandwidth to control autonomous drills, AR-based maintenance, and high-definition video for remote inspection. Vodafone Spain’s 2024 project achieved sub-10-millisecond latency while streaming video from 40 helmets and tele-operating excavators simultaneously.[3]Vodafone, “Standalone 5G in Mining,” vodafone.com Nokia and Boldyn built a millimeter-wave network at an Australian iron-ore mine that sustains 1.2 Gbps across 12 km² pits. Greenfield underground systems cost USD 8-15 million, but operators amortize the spend over multiple smart-mining use cases. Spectrum licensing is straightforward in Australia, Canada, and Germany, but remains ad hoc in many emerging markets, extending timelines by 18-24 months.
Surge in Critical-Mineral Demand
The International Energy Agency projects lithium demand to rise sixfold and cobalt demand to triple between 2020 and 2040, driving miners to raise output without inflating carbon or water footprints. AI-driven blast optimization and real-time ore sorting have lifted throughput 10-15% at Chilean lithium brine and Australian spodumene operations, while trimming waste rock by up to 12%. U.S. and Canadian rare-earth developers use digital twins to simulate flowsheets before construction, cutting time-to-first-production by up to 9 months. Geopolitical anxieties further accelerate adoption as governments update critical minerals lists and incentivize domestic supply.
Restraints Impact Analysis of Smart Mining Market*
| Restraint | (~) % Impact on CAGR Forecast | Geographic Relevance | Impact Timeline |
|---|---|---|---|
| High CAPEX and ROI uncertainty | -1.7% | Africa, South America, Southeast Asia, other price-sensitive regions | Short term (≤ 2 years) |
| Legacy-system integration gaps | -0.9% | North America and Europe facilities with aging infrastructure | Medium term (2-4 years) |
| Cyber-security vulnerabilities | -1.1% | All connected operations, highest exposure in multi-site global networks | Short term (≤ 2 years) |
| Skilled digital-talent shortage | -0.8% | Remote regions of Australia, Canada, Russia | Medium term (2-4 years) |
| Source: Mordor Intelligence | |||
High CAPEX and ROI Uncertainty
Large smart-mining rollouts often top USD 50 million, and volatile commodity cycles stretch payback periods to more than 4 years for copper, gold, and iron-ore producers. McKinsey’s 2024 survey found that 38% of executives are delaying projects due to unclear returns, especially when local currencies depreciate against USD-linked equipment financing. Smaller African and Southeast Asian miners struggle to secure bank credit for intangible assets, relying instead on vendor leasing, which carries higher interest rates. Regulatory uncertainty surrounding carbon-pricing schemes clouds internal valuations because miners cannot yet monetize emissions cuts achieved by autonomous haulage and energy optimization.
Cyber-Security Vulnerabilities
Operational-technology convergence expands attack surfaces across connected trucks, conveyor PLCs, and cloud dashboards. MMG’s Las Bambas mine lost 36 hours of production due to a 2024 cyber incident that cost USD 4.2 million. Insurers now raise premiums by up to 40%, imposing stricter audits that strain mid-tier budgets. CISA flagged unpatched legacy PLCs as a critical risk in a 2024 advisory, urging the adoption of zero-trust architectures and air-gapped networks, which add USD 2-5 million to annual IT spend. The elevated threat landscape pushes some operators to delay wider connectivity until robust defenses are in place.
*Our forecasts treat driver/restraint impacts as directional, not additive. The impact forecasts reflect baseline growth, mix effects, and variable interactions.
Smart Mining Market Segment Analysis
By Solution:
Control Systems Anchor Revenue, Autonomous Haulage AcceleratesControl systems captured 39.87% of 2025 revenue, reflecting their role as the central command layer that orchestrates ventilation, power distribution, and process loops across open-pit and underground sites. The smart mining market size attributed to control systems surpassed USD 7 billion in 2025, confirming the segment’s entrenched status. Operators value real-time visibility into energy load, conveyor performance, and gas levels, all delivered through SCADA frameworks that now integrate digital twins. The rise of open-platform architectures lets miners bolt on analytics and visualization modules without forklift upgrades, preserving capital and enabling incremental modernization.
Autonomous haulage and drilling is the fastest-growing solution category, advancing at a 12.57% CAGR through 2031. Productivity gains of 15-20% per tonne hauled, along with reduced tire wear and lower fuel burn, underpin the economic case. Rio Tinto, BHP, and Fortescue Metals Group each deployed 90-plus autonomous trucks in 2025, pulling the smart mining market toward fully crewless fleets. Safety and security systems, particularly LiDAR-based collision-avoidance systems, saw a surge in demand after the United States Mine Safety and Health Administration tightened proximity-detection mandates in 2024. Data-management software rounds out the stack by turning petabytes of truck, drill, and crusher telemetry into actionable insights that improve strip ratios and optimize crusher choke settings.


By Service Type:
Integration Dominates, Managed Services SurgeSystem integration accounted for 47.63% of 2025 service revenue, as miners depend on specialists who understand proprietary equipment protocols and cloud-native analytics. Smart mining market share for these integrators remains high because they bundle hardware, software, and change management under multi-year contracts. Managed services, however, are advancing at an 11.93% CAGR, fueled by miners that offload 24/7 monitoring and cyber-security liability to vendors with certified control centers. Accenture expanded its mining managed-services headcount by 22% in 2024 to meet this demand.
Consulting retains a core position for greenfield projects that must blueprint future-proof networks, yet as-a-service models shift revenue from one-time engineering to recurring support. Maintenance services adopt predictive models derived from fleet telemetry, moving away from calendar-based schedules. Collectively, services transform the smart mining market by lowering entry barriers for mid-tier operators that lack in-house digital teams.
By Mining Type:
Surface Operations Lead, Underground Automation Gains MomentumSurface mining accounted for 64.39% of the smart mining market in 2025, thanks to simpler GPS connectivity and large fleets that amortize automation costs. Autonomous drills guided by GNSS and radar now achieve centimeter-level precision, driving down explosives spend and improving fragmentation. Open-pit operators also benefit from private LTE, which covers vast pits with fewer base stations than Wi-Fi.
Underground automation is climbing at 11.54% CAGR through 2031 as tele-remote loaders, ventilation-on-demand, and methane sensors mitigate safety hazards. Sandvik’s AutoMine platform cut worker exposure to dust and rockfall by 40% at 15 hard-rock mines by 2024. Newmont’s Tanami shaft, 1.5 kilometers deep, deployed autonomous haul trucks, lowering underground haulage costs by 18% in 2025. The smart mining market for underground solutions is poised for steady growth, as deeper ore bodies and stricter safety codes force operators to automate.
By Technology:
IoT Platforms Prevail, AI Analytics AscendIoT platforms held 42.91% share in 2025, serving as the connective tissue that streams sensor data from trucks, conveyors, and substations to edge gateways. Open-source MQTT and OPC UA protocols encourage multi-vendor interoperability, reducing vendor lock-in. Artificial-intelligence analytics is the fastest-growing technology, with a 12.14% CAGR, driven by edge inference chips that classify seismic, spectral, and video feeds in milliseconds. IBM linked Watson to Rio Tinto's mine-planning workflows in 2024, predicting equipment failures 21 days in advance and eliminating 14% of unplanned downtime.
Robotics and automation cover autonomous drills, robotic samplers, and battery-electric loaders that suit ventilation-constrained underground workings. Connectivity spans private 5G, LTE, and Wi-Fi 6E, while cloud and edge computing converge as miners push latency-sensitive tasks to on-site rugged servers and reserve longer-horizon analytics for hyperscale cloud. Trimble processed 2.3 petabytes of haul-truck telemetry in 2024 to optimize route selection across 140 sites.
Geography Analysis
APAC Smart Mining Market
Asia Pacific commanded 35.24% of 2025 revenue, led by China’s mandate that coal mines above 1.2 million-ton annual capacity install smart-mine systems by the end of 2024. Australia’s Pilbara iron-ore cluster remains a living lab, with state co-funding of USD 8.3 million catalyzing autonomous-haulage pilots across mid-tier operations. The region also benefits from concentrated lithium and rare-earth deposits that attract significant digital investment to secure supply for battery gigafactories.
North America Smart Mining Market
North America follows with robust private-spectrum rules that let miners deploy LTE and 5G without interference risk. Newmont’s Peñasquito site integrated private LTE in 2024, supporting 120 connected devices that enabled remote troubleshooting of drills and shovels. Venture capital is flowing into start-ups developing edge AI chips and emissions-tracking dashboards, widening the technology supply chain.
EMEA and South America Smart Mining Market
Europe’s growth is slower because coal declines and greenfield mine permitting faces social resistance. Scandinavian operators, however, are pioneering battery-electric autonomous trucks to meet carbon-neutrality goals, signaling a niche tech leadership role. South America hosts high-grade copper and lithium belts; Codelco installed autonomous haulage at Chuquicamata underground in 2024 to cut diesel burn by 12%. Select Middle East and Africa markets mature quickly. Saudi Arabia’s Ma’aden awarded a USD 47 million automation contract to Siemens in 2024 to optimize conveyors and crushers for a 15% energy-efficiency gain. The Middle East is the fastest-growing region, with a 12.19% CAGR through 2031, buoyed by sovereign wealth funding and remote operations centers that manage sites hundreds of kilometers away. Africa continues to struggle with grid reliability and limited project finance, yet South African platinum mines are installing ventilation-on-demand systems to comply with revised safety laws.

Regulatory Landscape
Smart mining deployments are increasingly shaped by critical-minerals frameworks and safety digitization mandates that turn connectivity, traceability, and real-time monitoring into compliance requirements. In the European Union, Regulation (EU) 2024/1252 (Critical Raw Materials Act) entered into force in April 2024, reinforcing supply-chain transparency and sustainability data needs that feed demand for ESG dashboards, data management, and auditable sensor-to-report workflows across mining operations.
On safety and domestic-supply policy, national programs and draft legislation influence the pace and architecture of smart mine rollouts. China has advanced national mine-safety IoT standardization through a unified monitoring approach tied to standardized protocols (reported in April 2026), pushing operators and vendors to align equipment telemetry and interfaces with national safety networks. In the United States, 2026 legislative proposals have also emerged related to domestic mineral production certification (for example, S.4251). Australia and Canada have formalized critical-minerals collaboration via a Joint Declaration of Intent that emphasizes alignment around ESG and traceability practices, reinforcing demand for interoperable digital permitting and reporting systems.
Value Chain Analysis
The smart mining value chain starts with sensors, instrumentation, industrial networks (private LTE/5G, Wi-Fi), and edge compute that capture operational data from mobile fleets and fixed assets. This feeds mine-level control and automation stacks (DCS/SCADA, fleet management, drilling automation), followed by higher-order software for analytics, digital twins, and reporting (production optimization, maintenance prediction, energy and emissions tracking).
OEMs and automation majors anchor platforms around installed fleets, while hyperscalers and enterprise software vendors contribute cloud, data, and AI tooling that is increasingly embedded into mining workflows. System integrators and specialist engineering firms connect heterogeneous protocols and legacy supervisory systems, then operate solutions through managed services, remote operations centers, and cybersecurity monitoring, reflecting the integration-heavy nature of site-wide deployments. Recent partnerships illustrate how value is captured through co-development and interoperability: in March 2026 Codelco signed an 18-month memorandum of understanding with Microsoft focused on AI, analytics, and autonomous operations, and in June 2026 Sandvik and Rio Tinto initiated a joint development program to integrate Sandvik i-series surface drill rigs with Rio Tinto Autonomous Drilling System for remote, multi-rig operation via the Perth Operations Centre. Academic and field-validation nodes are also becoming part of the chain, as shown by Mineros S.A. partnering in April 2026 with IIT Kharagpur to establish a living laboratory for AI-enabled mining solutions and help de-risk deployment from prototype to production.
Competitive Landscape
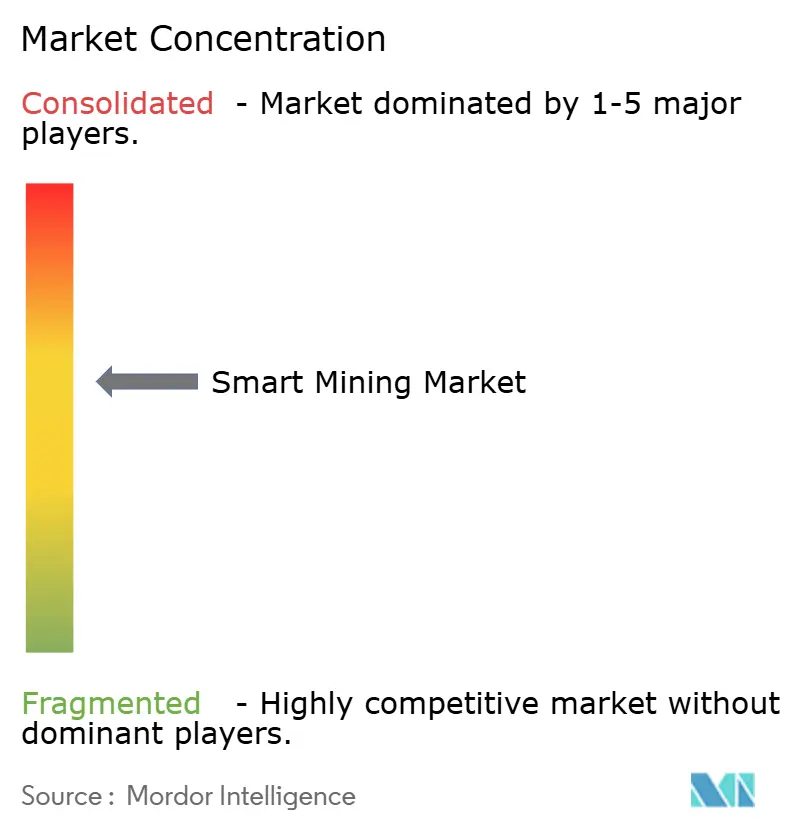
The smart mining arena is moderately concentrated, with heavy-equipment manufacturers anchoring digital ecosystems around their large installed bases. Caterpillar, Komatsu, Sandvik, and Epiroc sell autonomous-ready trucks, drills, and loaders. Their equipment runs proprietary control stacks tied to subscription software. Caterpillar’s MineStar merges collision avoidance, payload tracking, and autonomous dispatch in one interface for mixed fleets. Komatsu’s FrontRunner applies the same model, adding cloud updates and remote operations to haul-truck deliveries. These platform plays raise switching costs, giving incumbents bargaining power when fleets come up for replacement.
Recent deal activity shows incumbents widening their software footprints to secure data pipelines from blast to mill. Hexagon bought MineSense for USD 78 million in 2025. The deal added real-time ore-sorting sensors that divert waste rock and enhance the MinePlan loop. Caterpillar opened a USD 45 million Autonomous Solutions Center in Tucson in mid-2025. The site brings together haulage, dozer, and AI teams to accelerate multi-vehicle coordination algorithms. Komatsu deployed 30 more autonomous trucks at BHP’s Jimblebar mine in 2025. The move lifted the driverless fleet to 95 units and moves the site toward crewless shifts in 2026. Cisco allied with Newmont in 2025 to install private 5G at three North American gold mines. The network promises deterministic connectivity for autonomy and augmented-reality maintenance.
Smaller analytics firms use open APIs to add more modeling, energy optimization, and ESG dashboards to existing control systems, appealing to miners wary of lock-in. Edge-AI chipmakers now embed inference engines inside haul trucks and drills, trimming bandwidth needs and challenging centralized analytics vendors. Patent filings on autonomous swarm coordination climbed 34% in 2024, signaling intense R&D rivalry around multi-agent path planning. The top five vendors account for about 65% of revenue, giving the sector a concentration score of 6 and leaving room for disruptors.
Smart Mining Industry Leaders
ABB Ltd
Cisco Systems Inc.
Rockwell Automation Inc.
SAP SE
IBM Corporation
- *Disclaimer: Major Players sorted in no particular order
Smart Mining Market Companies Covered in this Report
- ABB Ltd
- Caterpillar Inc.
- Cisco Systems Inc.
- Komatsu Ltd
- Epiroc AB
- Hexagon AB
- Sandvik AB
- Rockwell Automation Inc.
- SAP SE
- Trimble Inc.
- IBM Corporation
- Wenco International Mining Systems Ltd
- Symboticware Inc.
- Metso Outotec Oyj
- Siemens AG
- Hitachi Construction Machinery Co., Ltd.
- Honeywell International Inc.
- Schneider Electric SE
- Accenture plc

Market Opportunities and Future Outlook
A key opportunity is scaling autonomy and advanced process analytics beyond flagship mines by using retrofit pathways alongside standardized operating models. Proof points in 2026 include Komatsu commissioning its 1,000th autonomous ultra-class haul truck with the FrontRunner Autonomous Haulage System (April 2026) and Western Australia initiating day-shift autonomous operations with a fleet of six retrofitted Komatsu HD1500 trucks via EACON Mining Technology (July 2026), which highlights routes to automate without replacing entire fleets. Operational milestones also continue to validate autonomy at scale, including Anglo American's Quellaveco copper operation in Peru reaching the 500 million tonnes autonomously hauled milestone using Caterpillar autonomy (June 2026).
Another whitespace area is software-led productivity and compliance, where mines use AI to turn high-volume operational data into faster decisions across maintenance, processing, and reporting. Vale inaugurated an AI-powered processing plant in Minas Gerais, Brazil (June 2026) and reported a 25% productivity gain, supporting continued investment in analytics and control modernization at concentrators and mills. Upstream, BHP partnered with the Government of Canada (March 2026) to digitize large geoscience and drill-core datasets, building a pipeline for exploration-to-development decisioning that can support data platforms, integration services, and governance tooling. As regulatory and insurer scrutiny raise the cost of cyber and audit gaps, managed services and security-by-design architectures also create an expansion path for mid-tier operators that lack 24/7 operational technology security teams.
Recent Industry Developments in Smart Mining Market
- June 2026: ABB launched Grinding Connect, a cloud-based digital service suite for gearless mill drive systems that combines analytics with AI-enabled virtual support. The release expands recurring digital services around critical comminution assets, tightening links between mill reliability programs and automation platforms used at large copper, gold, and iron ore operations.
- May 2026: ABB partnered with POINT.LAZ to integrate the Lazaruss 3D scanner into ABB Ability Smart Hoisting solution 4.0 for shaft inspection and maintenance workflows. The move strengthens condition monitoring and digital inspection capabilities in underground mines, where hoisting uptime and safety compliance are central to production continuity.
- October 2024: BHP strengthened its partnership with ABB to advance technology collaboration across operations. The agreement supports broader deployment of electrification, automation, and digital solutions, reinforcing vendor-miner co-development models that accelerate adoption across multi-site fleets and plants.


Smart Mining Market Report Scope and Research Methodology
Market Definition and Coverage
The smart mining market, for this methodology, covers digital hardware, software, and related integration services that make mining operations connected, automated, and data-driven across surface and underground sites.
Scope exclusions: We exclude conventional stand-alone mining equipment that does not have real-time connectivity or autonomous capability.
Segments Covered in This Report
- By Solution
- Smart Control Systems
- Smart Asset Management
- Safety and Security Systems
- Data Management and Analytics Software
- Monitoring and Visualization
- Autonomous Haulage and Drilling
- Other Solutions
- By Service Type
- System Integration
- Consulting Services
- Engineering and Maintenance
- Managed Services
- By Mining Type
- Underground Mining
- Surface (Open-Pit) Mining
- By Technology
- Internet of Things (IoT)
- Artificial Intelligence and Analytics
- Robotics and Automation
- Connectivity (5G/LTE)
- Cloud and Edge Computing
- By Geography
- North America
- United States
- Canada
- Mexico
- Europe
- Germany
- United Kingdom
- France
- Russia
- Rest of Europe
- Asia-Pacific
- China
- Japan
- India
- South Korea
- Australia
- Rest of Asia-Pacific
- Middle East and Africa
- Middle East
- Saudi Arabia
- United Arab Emirates
- Rest of Middle East
- Africa
- South Africa
- Egypt
- Rest of Africa
- Middle East
- South America
- Brazil
- Argentina
- Rest of South America
- North America
Data Sources, Market Sizing, and Validation
Desk Research
Desk research is used to set the backbone of the model so the numbers stay tied to realistic mining activity and technology adoption. We relied on public and official sources such as USGS mineral production series, World Bank and IMF macro indicators, IEA energy and emissions statistics, International Labour Organization safety and labor data, and national mining ministry publications where available.
To translate those foundations into smart-mining spend, company filings, annual reports, and investor presentations were reviewed for stated digital, automation, and mine technology priorities, along with association websites and reputable industry press for project announcements and technology rollouts. In select places, paid database subscriptions were used for company financials and intelligence and for patent lookups to sanity-check technology intensity and direction. These desk research sources are illustrative and not exhaustive, and many other public documents and datasets were also referred to for data collection, validation, and clarification.
Primary Interviews and Surveys
Primary work was run to pressure-test adoption assumptions and pricing ranges for typical mine-site deployments, where desk sources usually stay high level. We spoke with a mix of mine operators, system integrators, and solution teams, and we covered demand signals across APAC, EMEA, and the Americas so regional maturity gaps could be captured and then normalized in the model.
Distribution of primary research fieldwork respondents
| Company type | Respondent position | Region |
|---|---|---|
| Top tier: 29% | CXOs: 14% | APAC: 45% |
| Mid tier: 50% | Functional/Unit leaders: 33% | EMEA: 29% |
| Smaller Players: 21% | Managers: 53% | Americas: 26% |
Market-Sizing & Forecasting
Sizing was built using a top-down and bottom-up combination, where mining activity and operating spend signals were reconstructed by region and then translated into addressable smart-mining spend through adoption rates for connectivity, automation, and analytics on active mine sites. To keep totals grounded, selective bottom-up approximations were used as cross-checks, such as sampled deal values from public project references, typical system-integration tickets, and volume-by-ASP checks for sensor and connectivity deployments.
Key inputs that shaped the model included active mine counts and production intensity by commodity, the share of operations moving toward autonomous or semi-autonomous fleets, mine-site connectivity build-outs (private LTE or 5G and industrial Wi-Fi), spending patterns for asset health and predictive maintenance, and the mix shift between new deployments versus retrofits. Where some country or commodity inputs were thin, gaps were handled by using proxy mining activity indicators and then validating the implied spend per site with interview feedback.
For forecasting, scenario analysis was used and then anchored with a simple multivariate regression view on variables like commodity price outlook, capex cycles, and digitization adoption pace, followed by expert normalization so short-term swings did not overdrive the long-term curve.
Data Validation & Update Cycle
Model outputs were checked against independent signals such as mining capex commentary, automation program announcements, and regional technology rollout timelines, which helped spot over-counting early. Variances were reviewed in multiple steps, first at assumption level and then at market-total level, before internal sign-off.
If an anomaly showed up, such as an unrealistic spend per mine or a sudden regional jump, we re-checked the driver inputs and re-contacted relevant interviewees to confirm whether the change was real or a data artifact. Reports are refreshed annually, and interim updates are made when material events occur, followed by a final pre-delivery review so clients receive the latest updated view.
Mordor Intelligence's Smart Mining Market Estimate Compared With Other Published Estimates
Published market sizes for smart mining do not always match because the market can be counted in different ways, even when the topic sounds similar. The gaps usually come from what is treated as a qualifying smart-mining deployment, how services are counted, and whether the inputs are refreshed to reflect new site-level rollouts.
Conventional stand-alone mining equipment that is not connectivity-enabled sits outside Mordor Intelligence's scope, which reduces the risk of mixing standard equipment replacement cycles into a digital deployment market total. Differences also show up when other estimates assume faster take-up of private wireless and autonomy across all mines, or when currency timing and inflation assumptions are not aligned to typical contract and implementation cycles.
Benchmark comparison
| Source | Market Size | Gaps in Research Methodology |
|---|---|---|
| Mordor Intelligence | USD 16.57 B (2025) | |
| Global Consultancy A | USD 15.68 B (2025) | Tends to emphasize software-led definitions in some cuts of the market, which can undercount integration and managed support that are bundled into many mine-site rollouts. |
| Industry Publisher B | USD 17.36 B (2025) | Often uses a broader component view and a quicker ramp for automated equipment and services, which can pull in adjacent mining equipment value that is not consistently connectivity-enabled across sites. |
Across the three figures, the spread is mainly explained by what qualifies as smart mining versus general mining equipment modernization, and by how integration and ongoing services are treated in the value stack. By tying totals back to mine-site adoption indicators and then checking implied spend levels with primary inputs, the number stays traceable to repeatable deployment variables rather than only to broad technology narratives.


Key Questions Answered in the Report
What is the projected value of the smart mining market by 2031?
It is expected to reach USD 31.86 billion, growing at an 11.16% CAGR from 2026 to 2031.
Which region currently leads adoption of smart mining technologies?
Asia Pacific commands 35.24% of 2025 revenue, driven by China’s standards and Australia’s Pilbara automation cluster.
Which solution segment is expanding the fastest?
Autonomous haulage and drilling is advancing at a 12.57% CAGR through 2031.
Why are private 5G networks important for mines?
They provide sub-10-millisecond latency that supports real-time control of autonomous vehicles and high-bandwidth video feeds.
What is the main barrier to smart mining investment?
High upfront capital with uncertain ROI, especially when commodity prices are volatile and financing is expensive.
How concentrated is competition among technology vendors?
The top five suppliers hold roughly 65% share, giving the sector a market concentration score of 6.
Page last updated on:





