
Smart Kitchen Appliances Market Size and Share
Market Overview
| Study Period | 2020 - 2031 |
|---|---|
| Market Size (2026) | USD 26.25 Billion |
| Market Size (2031) | USD 43.93 Billion |
| Growth Rate (2026 - 2031) | 10.86 % |
| Fastest Growing Market | Europe |
| Largest Market | North America |
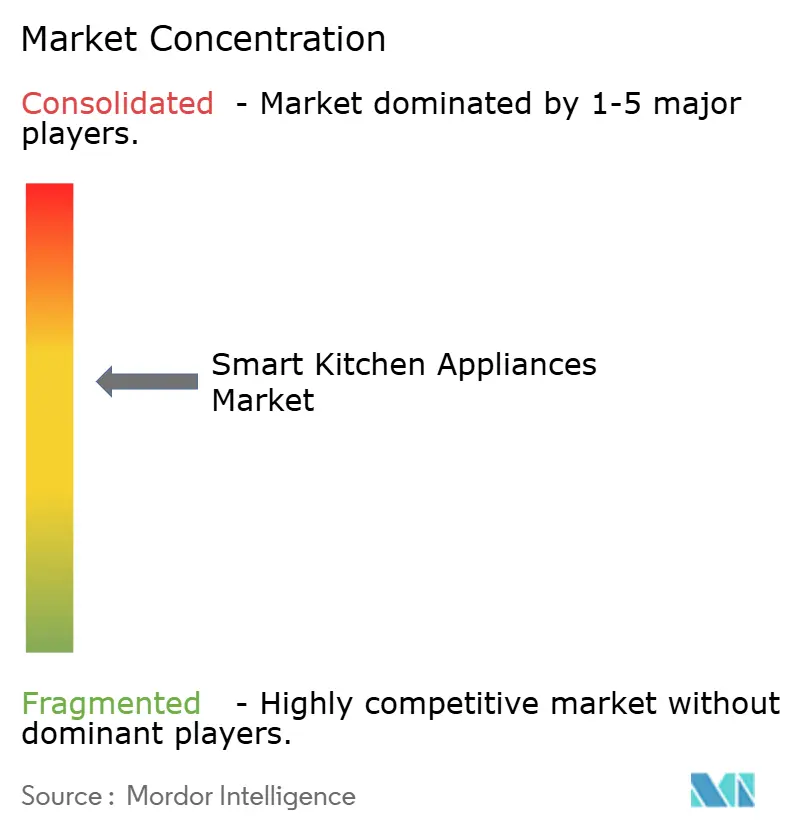
| Market Concentration | Medium |
Major Players *Disclaimer: Major Players sorted in no particular order Image © Mordor Intelligence. Reuse requires attribution under CC BY 4.0. | |
Smart Kitchen Appliances Market Analysis by Mordor Intelligence
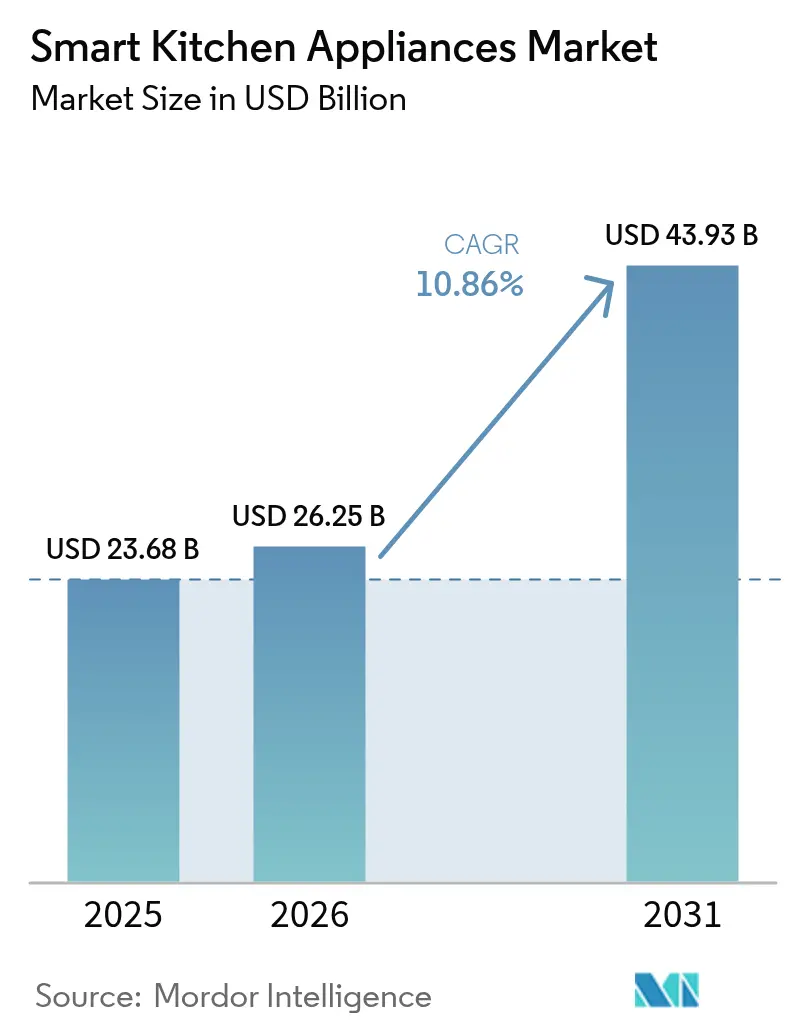
The smart kitchen appliances market size is expected to grow from USD 23.68 billion in 2025 to USD 26.25 billion in 2026 and is forecast to reach USD 43.93 billion by 2031 at 10.86% CAGR over 2026-2031. Heightened household connectivity, tightening energy-efficiency mandates, and rapid AI infusion collectively underpin the upward revenue trajectory. Manufacturers are competing on ecosystem breadth, embedding voice control, in-appliance vision, and predictive maintenance features that raise perceived value and drive replacement demand. Semiconductor shortages remain the primary supply-side risk, yet most tier-one vendors have diversified sourcing strategies that partially insulate production schedules. Platform partnerships between appliance brands and tech giants further amplify consumer switching costs and unlock ancillary revenue through digital services.
Key Report Takeaways
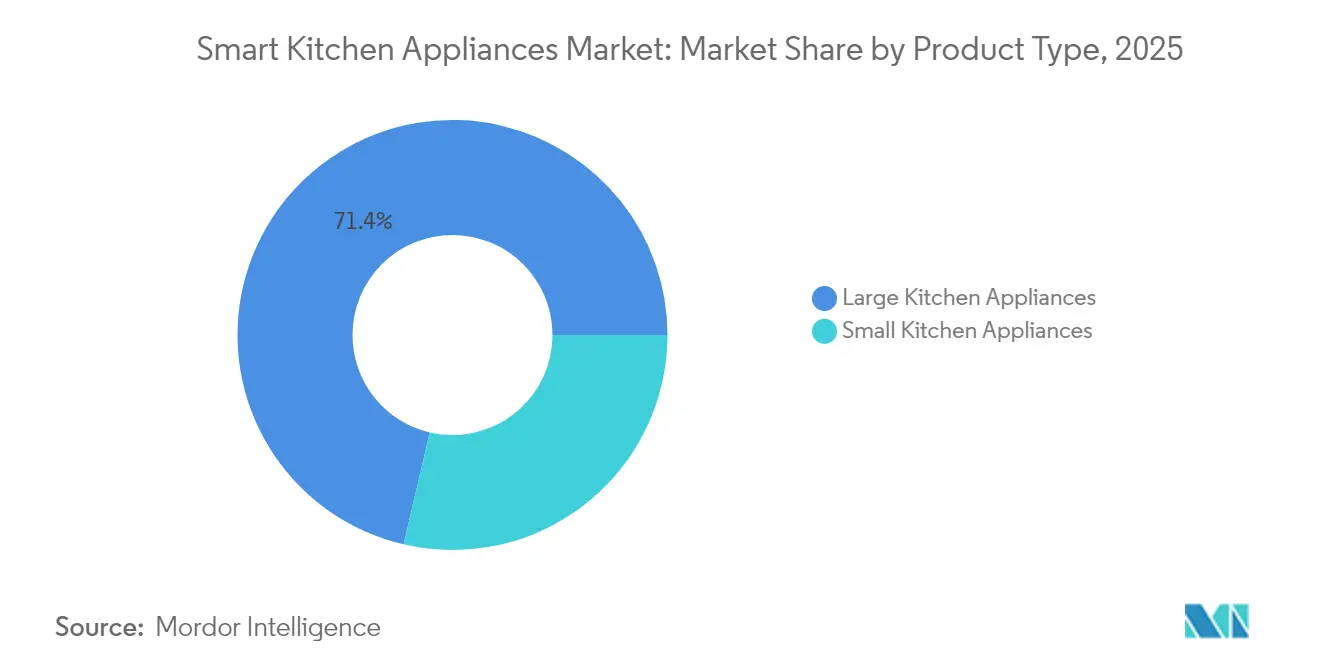
- By product category, large appliances held 71.35% of the smart kitchen appliances market share in 2025, while small appliances are forecast to post a 14.36% CAGR through 2031.
- By end user, the residential segment commanded 80.25% share of the smart kitchen appliances market size in 2025; commercial applications are projected to expand at an 11.42% CAGR to 2031.
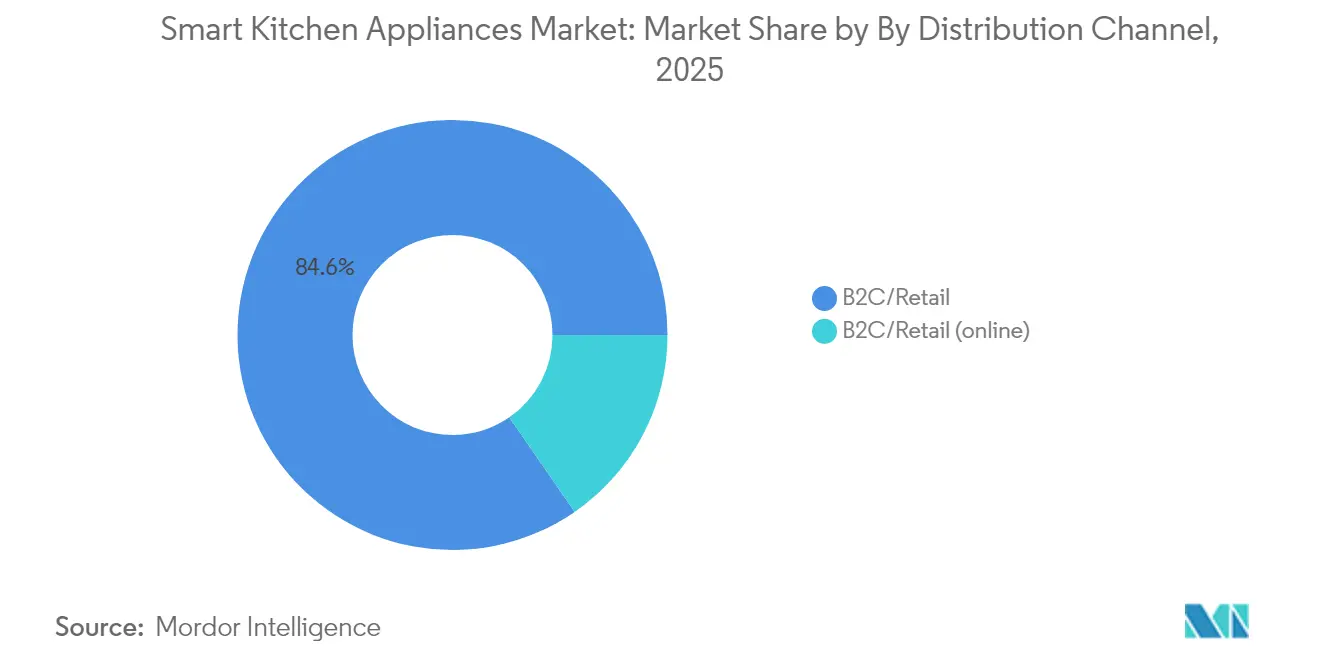
- By distribution channel, B2C retail controlled 84.62% revenue share in 2025, whereas online sub-channels within B2C are advancing at a 14.52% CAGR through 2031.
- By geography, North America led with 33.78% smart kitchen appliances market share in 2025; Europe is expected to record the quickest regional CAGR at 11.98% by 2031.
Note: Market size and forecast figures in this report are generated using Mordor Intelligence’s proprietary estimation framework, updated with the latest available data and insights as of 2026.
Market Trends and Insights
Drivers Impact Analysis of Smart Kitchen Appliances Market*
| Driver | (~) % Impact on CAGR Forecast | Geographic Relevance | Impact Timeline |
|---|---|---|---|
| Rising household adoption of IoT-enabled appliances | +2.1% | Global (North America & Europe lead) | Medium term (2-4 years) |
| Energy-efficiency regulations & incentives | +1.8% | North America & EU, expanding to APAC | Long term (≥ 4 years) |
| Growing e-commerce penetration for appliance sales | +1.5% | Global, strongest in urban markets | Short term (≤ 2 years) |
| Premiumisation in residential renovations | +1.2% | North America & Europe | Medium term (2-4 years) |
| Edge-AI embedded cooking-assist features | +0.9% | Global, early adoption in developed markets | Long term (≥ 4 years) |
| Food-waste-tracking subscriptions bundled with fridges | +0.7% | North America & Europe | Long term (≥ 4 years) |
| Source: Mordor Intelligence | |||
Rising Household Adoption of IoT-Enabled Appliances
High-speed internet ubiquity and affordable sensor modules lower adoption barriers, letting brands embed connectivity as a default rather than a premium add-on. Samsung’s 2024 Bespoke AI launch illustrates how natural-language voice assistants turn complex tasks into casual commands, boosting daily engagement with smart features. Younger demographics treat remote monitoring and recipe automation as baseline expectations, changing the purchase criteria that once revolved solely around capacity and finish. Network effects inside multi-device ecosystems foster repeat purchases and reinforce brand loyalty when expansion or replacement cycles arise.
Energy-Efficiency Regulations & Incentives
The U.S. Department of Energy finalized new cooking-product standards in 2024, with compliance mandated by 2028; connected appliances can algorithmically meet these stringent thresholds more easily than analog counterparts[1]Source: U.S. Department of Energy, “Energy Conservation Program: Cooking Products; Energy Conservation Standards,” energy.gov. New York State’s appliance rules and Canada’s Amendment 18 further widen the regulatory net, compelling manufacturers to prioritize smart controls that fine-tune electricity draw while maintaining performance. Across the Atlantic, Europe’s Eco-design directives tighten minimum efficiency levels, nudging consumers toward products that quantify savings in real time. Because energy bills remain elevated, AI-powered optimization functions resonate financially as well as environmentally, improving willingness to pay premium prices. Vendors that certify early enjoy multi-year first-mover advantages before lagging rivals complete re-tooling.
Growing E-Commerce Penetration for Appliance Sales
Digital storefronts streamline comparison shopping, facilitate user-generated content, and support virtual demonstrations that replicate showroom interactions without high overhead. Pandemic-era comfort with ordering big-ticket items online has persisted, and top brands now allocate disproportionate launch budgets to direct-to-consumer channels. Rich product pages explain connectivity benefits in depth, often bundling extended warranties and installation services that historically required in-store consultants. Data collected post-sale enables appliance makers to upsell subscription features such as recipe libraries or predictive maintenance alerts, diversifying revenue beyond one-time hardware margins. Urban consumers embrace doorstep delivery combined with haul-away of legacy units, removing a key logistical barrier that once favored brick-and-mortar outlets.
Premiumisation in Residential Renovations
The National Kitchen & Bath Association lists connected cooking suites as a leading remodeling priority for 2025, reflecting homeowner desire for future-proof investments[2]Source: National Kitchen & Bath Association, “2025 Design Trends Report,” nkba.org. Built-in smart ranges, refrigerators, and dishwashers integrate seamlessly with cabinetry and raise property resale value, justifying their higher price tags. Brands like BSH and Samsung respond by expanding bespoke finish options while keeping connectivity uniform across the range, ensuring aesthetic cohesion without sacrificing functionality. Renovation cycles span well over a decade, so appliances installed today will anchor brand ecosystems until at least the late 2030s. This lock-in effect encourages vendors to bundle extended service plans and software updates, reinforcing customer retention over multiple product generations.
Restraints Impact Analysis of Smart Kitchen Appliances Market*
| Restraint | (~) % Impact on CAGR Forecast | Geographic Relevance | Impact Timeline |
|---|---|---|---|
| High upfront cost versus conventional appliances | -2.3% | Global (strongest in emerging economies) | Short term (≤ 2 years) |
| Consumer data-privacy & cyber-risk concerns | -1.7% | North America & Europe | Medium term (2-4 years) |
| Inter-brand interoperability gaps | -1.1% | Global, accentuated in mixed-brand homes | Medium term (2-4 years) |
| Supply-chain exposure to SiC/GaN chip shortages | -0.8% | Global, concentrated in high-end segments | Short term (≤ 2 years) |
| Source: Mordor Intelligence | |||
High Upfront Cost Versus Conventional Appliances
Smart models command 20-40% premiums, stretching household budgets in regions where discretionary income remains tight. Installation of induction-based cooking appliances may also necessitate electrical upgrades, amplifying the initial cash outlay. To overcome sticker shock, vendors experiment with low-interest financing, trade-in credits, and modular upgrade paths that spread expenditure over time. Government rebate schemes tied to energy efficiency help but vary widely by jurisdiction, creating uneven global adoption curves. As component costs fall and economies of scale deepen, price gaps are likely to narrow, yet affordability will stay a gating factor in many emerging markets.
Consumer Data-Privacy & Cyber-Risk Concerns
Academic assessments of IoT firmware frequently uncover weak encryption and default credentials that hackers can exploit, heightening anxiety around connected kitchens. Privacy-sensitive shoppers fear that usage patterns and voice recordings could be harvested for targeted advertising or fall into malicious hands. Incidents involving camera-equipped devices intensify scrutiny and prompt calls for mandatory security labeling similar to energy ratings. Industry alliances now promote secure-boot processes, over-the-air patching, and end-to-end encryption as baseline requirements, yet consumer education remains inconsistent. Manufacturers that certify to robust frameworks such as Matter and implement transparent data policies will gain trust advantages over less proactive rivals.
*Our forecasts treat driver/restraint impacts as directional, not additive. The impact forecasts reflect baseline growth, mix effects, and variable interactions.
Smart Kitchen Appliances Market Segment Analysis
By Product:
Large Appliances Sustain Volume While Compact Devices Spark InnovationLarge appliances commanded 71.35% of the smart kitchen appliances market in 2025, anchored by refrigerators, dishwashers, and cooking ranges that integrate deeply with household routines. Samsung’s AI Vision refrigerator, capable of recognizing 37 food items and generating automatic grocery lists, illustrates how core appliances have become digital hubs. Regulatory headwinds accelerate dishwasher replacement, as upcoming efficiency rules in 2027 favor models with adaptive wash algorithms that trim water and electricity usage. Oven innovation centers on embedded cameras such as GE Appliances’ CookCam, which, paired with edge-AI, predicts doneness and prevents over-cooking, reinforcing premium positioning. Because these items carry multi-year warranties and longer lifecycles, brand lock-in is strong, encouraging manufacturers to expand adjacent services like recipe subscriptions.
Small kitchen appliances, although holding a smaller revenue base, are forecast to grow at a 14.36% CAGR through 2031 due to urbanization and demand for multifunctionality. Connected air fryers, smart coffee makers, and countertop ovens introduce features, remote start, automatic ingredient detection, nutritional tracking, that once appeared only in flagship ranges. Lower average selling prices shorten replacement cycles, letting brands iterate software features quickly and test consumer appetite for paid upgrades. Voice-assistant compatibility has become table stakes, while smartphone apps push firmware updates that unlock new cooking modes post-purchase, enhancing perceived value. As a result, compact devices act as entry points, onboarding first-time buyers who may later upgrade to full smart suites.


Segment 2
Residential applications capture 80.25% market share in 2025, reflecting widespread consumer adoption of smart home technologies and increasing comfort with connected appliances that enhance daily cooking and food management experiences. Home kitchens serve as primary testing environments for smart appliance innovations, with consumers driving demand for features like voice control, remote monitoring, recipe assistance, and energy management capabilities that improve convenience and efficiency. The residential segment benefits from declining smart home technology costs, improved internet infrastructure, and growing consumer familiarity with IoT devices that reduce adoption barriers and accelerate market penetration. Smart refrigerators in residential applications increasingly incorporate food waste tracking capabilities, with systems like Enhanced Refrigerator with Quality and Quantity Monitoring (ERQQM) using RFID and sensors to monitor food conditions and alert users about spoilage.
Commercial applications demonstrate faster growth at 11.42% CAGR through 2031, driven by hospitality operators recognizing operational efficiency gains, food safety improvements, and cost reduction opportunities from connected kitchen systems. The hospitality sector leads commercial adoption with smart kitchen implementations projected to grow from USD 18.75 billion in 2023 to USD 60.19 billion by 2030, reflecting industry recognition of technology's role in addressing labor shortages and operational challenges. Restaurant chains leverage smart appliances for standardized cooking processes, inventory management, and quality control across multiple locations, creating operational consistency and reducing training requirements. Commercial smart refrigeration systems provide real-time temperature monitoring, automated alerts for maintenance issues, and energy optimization capabilities that reduce operational costs while ensuring food safety compliance.
By Distribution Channel:
Digital Commerce Reshapes Traditional Retail ModelsB2C retail channels maintain 84.62% market share in 2025, encompassing multi-brand stores, exclusive brand outlets, and online platforms that serve diverse consumer preferences for smart appliance research, evaluation, and purchase experiences. Online channels within B2C retail demonstrate exceptional growth at 14.52% CAGR, reflecting fundamental shifts in consumer purchasing behavior toward digital-first appliance acquisition and manufacturers' direct-to-consumer strategies. Multi-brand stores provide comparative shopping environments where consumers evaluate smart appliance features across manufacturers, though digital integration increasingly supplements physical showrooms with augmented reality demonstrations and connected product experiences. Exclusive brand outlets enable manufacturers to showcase smart appliance ecosystems comprehensively, demonstrating integration capabilities and providing specialized sales support that justifies premium pricing for connected devices.
B2B distribution directly from manufacturers represents smaller market share but provides essential channels for commercial customers requiring specialized smart appliance configurations, bulk purchasing arrangements, and integrated system solutions. Commercial customers increasingly prefer direct manufacturer relationships for smart appliances due to complex integration requirements, customization needs, and ongoing service support that traditional distributors cannot provide effectively. B2B channels enable manufacturers to capture higher margins while building direct customer relationships that inform product development and create opportunities for comprehensive smart kitchen system sales. The B2B segment benefits from commercial customers' willingness to invest in smart appliances for operational efficiency gains, regulatory compliance benefits, and competitive differentiation in food service markets.
Geography Analysis
North America Smart Kitchen Appliances Market
North America held 33.78% of the smart kitchen appliances market in 2025, reflecting consumers’ readiness to pay for premium connected suites and the region’s mature smart-home backbone. The U.S. Department of Energy’s 2024 cooking-product standards strengthen replacement demand as households shift to compliant models that surpass the new thresholds. Retailers blend in-store demos with virtual consultations, while subscription add-ons such as recipe libraries gain traction among tech-savvy households. Canada follows a parallel path: Amendment 18 to its Energy Efficiency Regulations broadens the appliance categories under mandatory limits beginning in 2026, rewarding suppliers that already ship AI-optimized unit. Mexico’s urban middle class gravitates toward mid-range smart ranges and refrigerators as cross-border e-commerce raises product visibility, propelling vendors to tailor bilingual apps for broader appeal.
Europe Smart Kitchen Appliances Market
Europe is forecast to advance at a 11.98% CAGR through 2031, the fastest among major regions, driven by stringent eco-design directives and elevated energy costs that highlight the payback of intelligent load-management features. Germany and the Nordic countries spearhead adoption of A-rated smart ovens and dishwashers that display real-time consumption dashboards, reinforcing the region’s sustainability ethos. BSH’s EUR 15.3 billion turnover in 2024 underscores manufacturer success in aligning AI cooking assistance with eco-labels. Southern Europe, historically price-sensitive, now receives lower-capacity smart refrigerators tailored for compact apartments, widening addressable demand. Retailers increasingly bundle extended service plans that guarantee software updates for at least five years, boosting buyer confidence and long-run satisfaction.
APAC Smart Kitchen Appliances Market
Asia-Pacific presents sizable upside as rising disposable incomes intersect with government smart-city programs. Chinese brands such as Haier leverage scale advantages to export AI-equipped refrigerators under aggressive pricing, challenging incumbents in Southeast Asia. Japan and South Korea maintain high per-capita penetration yet still upgrade to edge-AI cooking solutions that integrate with home-energy management panels. India shows early momentum in metros, where developers of premium condominiums pre-install smart ranges and app-linked hoods as value-adds. Regional heterogeneity persists: while urban consumers prioritize multifunctionality due to space constraints, rural adoption hinges on improved broadband and financing options.
Regulatory Landscape
Energy efficiency and connected-product compliance are increasingly shaped by appliance performance rules alongside horizontal cybersecurity requirements. In the United States, the Department of Energy has continued to refine its appliance standards framework through Federal Register rulemaking, building on the 2024 cooking-product standards with compliance timelines that extend into the late 2020s, and with updated procedures and interpretations issued in July 2026.
In parallel with federal actions, ENERGY STAR connected criteria and related guidance continue to influence how manufacturers market and verify connected functionality alongside efficiency claims. In Europe, the EU Cyber Resilience Act (Regulation (EU) 2024/2847) entered into force in December 2024, creating mandatory cybersecurity obligations for products with digital elements, including smart home and connected appliance categories. Its staged applicability introduces earlier 2026 milestones for the conformity assessment ecosystem (including provisions on notifying conformity assessment bodies), followed by additional manufacturer obligations later in 2026. Together, these requirements make security-by-design and documentation readiness prerequisites for connected kitchen portfolios sold in the EU.
Value Chain Analysis
The smart kitchen appliances value chain begins with inputs such as compressors, motors, heating elements, sensors, connectivity modules (Wi-Fi/Bluetooth), and control boards, with semiconductor availability and pricing continuing to influence bill-of-materials stability for premium, AI-enabled models. Manufacturing is concentrated among global OEMs and a broad network of component suppliers and ODM/contract design partners, especially across Asian appliance clusters such as Shunde (Foshan, China), where vertically integrated ecosystems support faster iteration of housings, glass panels, electronics, and sub-assemblies.
Downstream, brands add software (apps, cloud services, OTA updates) and platform integrations on top of hardware, then distribute through B2C retail (including online channels), brand stores, and direct-to-business channels for commercial installations. Interoperability initiatives increasingly sit in the development and certification node of the chain: the Connectivity Standards Alliance released Matter 1.4 in November 2024, reinforcing the role of standards compliance, security validation, and firmware lifecycle management as differentiators for otherwise similar hardware reference designs.
Competitive Landscape
The competitive field is moderately fragmented, with a cohort of global majors, Samsung, LG, BSH, Whirlpool, and GE Appliances, commanding significant revenue but leaving ample room for regional specialists and software-centric entrants. Leadership increasingly rests on ecosystem depth rather than isolated hardware innovation. Samsung’s Instacart-enabled refrigerator bridges appliances with grocery e-commerce, expanding revenue beyond the initial sale. Whirlpool and Samsung’s early certification on Matter 1.3 underscores a strategic pivot toward open-standard interoperability that reassures multi-brand households. GE Appliances, meanwhile, differentiates through CookCam AI and the EcoBalance platform that pairs devices with ABB’s smart panel for unified energy orchestration.
Chinese challengers, notably Haier and Midea, capitalize on cost leadership and rapid feature rollouts to penetrate emerging markets and value tiers in developed economies. Their cloud-based service layers, such as Haier’s Smart Home Experiential Cloud, collect usage data that informs agile firmware updates and personalized promotions. European premium labels focus on design aesthetics paired with resource-saving credentials, exploiting consumer willingness to invest in long-lasting, eco-certified goods. Start-ups targeting single categories—smart cooktops, AI sous-vide sticks—employ software-as-a-service pricing to monetize continuous algorithm improvements, pressuring incumbent margin structures.
Strategic alliances blur industry boundaries. Appliance makers court semiconductor suppliers to secure SiC and GaN allocations, while partnering with voice-assistant providers to streamline UX. Cross-industry deals, such as Samsung’s integration with Instacart, suggest that future differentiation will stem from data partnerships and commerce tie-ins more than from incremental thermal-efficiency gains. As platforms mature, industry watchers anticipate selective M&A that consolidates firmware stacks, ensuring consistent user journeys across the full kitchen suite.
Smart Kitchen Appliances Industry Leaders
Samsung Electronics Co. Ltd
Whirlpool Corporation
LG Electronics Inc.
BSH Hausgeräte
Haier Smart Home
- *Disclaimer: Major Players sorted in no particular order
Smart Kitchen Appliances Market Companies Covered in this Report
- Samsung Electronics Co. Ltd.
- LG Electronics Inc.
- Whirlpool Corporation
- BSH Hausgerate GmbH (Bosch-Siemens)
- Haier Smart Home Co. Ltd. (GE Appliances)
- Electrolux AB
- Panasonic Corporation
- Midea Group
- Breville Group
- Philips Domestic Appliances
- SharkNinja Operating LLC
- Xiaomi Corporation
- Sub-Zero Group Inc.
- SMEG SpA
- Groupe SEB (Tefal, Krups)
- Arcelik A.S (Beko)
- Gorenje d.d.
- Dacor (Subsidiary of Samsung)
- Kenmore (Transformco)
- Instant Brands Inc.

Market Opportunities and Future Outlook
Interoperability and ecosystem control remain a practical whitespace for vendors looking to reduce multi-brand friction and capture more value after purchase. Matter continues to mature as a unifying layer for smart home device control, and the Connectivity Standards Alliance released Matter 1.4 in November 2024, extending the standard across additional device categories relevant to kitchens. Companies that emphasize open interoperability can build opportunities around multi-brand control experiences, installer-friendly onboarding, and services spanning refrigeration, cooking, dish care, and ventilation, rather than siloed apps.
Energy and product-compliance roadmaps are also driving redesign and refresh cycles that favor connected control architectures. EU ecodesign requirements tighten off-mode and standby limits to 0.3 W from January 1, 2027, pushing low-power electronics design and smarter power management into routine product planning, while Great Britain has updated its ecodesign framework via SI 2026/750. On the product side, manufacturers are using embedded intelligence as a purchase driver: GE Appliances introduced a GE Profile smart refrigerator with a built-in barcode scanner and kitchen assistant in January 2026, and it expanded SmartHQ-connected wall ovens in February 2026. Samsung highlighted Bespoke AI kitchen appliances in April 2026, and it added new cooking-format products such as slide-in ranges and an over-the-range microwave with Air Fry Max in July 2026.
Recent Industry Developments in Smart Kitchen Appliances Market
- July 2026: Samsung launched new slide-in ranges and over-the-range microwave models featuring Air Fry Max. The releases extended connected cooking options across more price points and formats, supporting broader ecosystem attachment for households already using SmartThings-linked appliances.
- February 2026: Whirlpool introduced a 36-inch wide French door refrigerator with an integrated in-door nugget ice maker, positioned as an industry-first, and also highlighted a dishwasher featuring AI Intelligent Wash sensors and a 360-degree spinning lower rack. These launches reinforced feature-led differentiation in core large appliances where replacement cycles are longer, helping justify smart-premium pricing.
- January 2024: Panasonic expanded its collaboration with Fresco by rolling out an AI cooking assistant for the HomeCHEF 4-in-1 multi-oven. The rollout strengthened software partnerships as a way to accelerate feature delivery and supported guided-cooking experiences in countertop and compact cooking formats.


Smart Kitchen Appliances Market Report Scope and Research Methodology
Market Definition and Coverage
This market covers connected kitchen appliances and smart cooking tools that can be controlled, monitored, or automated through apps, voice assistants, or built-in sensors, and they are counted by their sales value across residential and commercial use.
Scope exclusions: We exclude non-connected conventional kitchen appliances and standalone smart home hubs that do not perform a kitchen function.
Segments Covered in This Report
- By Product
- Large Kitchen Appliances
- Refrigerators & Freezers
- Dishwashers
- Range Hoods
- Cooktops
- Ovens
- Other Large Kitchen Appliances
- Small Kitchen Appliances
- Food Processors
- Juicers and Blenders
- Grills and Roasters
- Air Fryers
- Coffee Makers
- Electric Cookers
- Toasters
- Electric Kettles
- Countertop Ovens
- Other Small Kitchen Appliances
- Large Kitchen Appliances
- By End User
- Residential
- Commercial
- By Distribution Channel
- B2C/Retail
- Multi-brand Stores
- Exclusive Brand Outlets
- Online
- Other Distribution Channels
- B2B (directly from the manufacturers)
- B2C/Retail
- By Geography
- North America
- United States
- Canada
- Mexico
- South America
- Brazil
- Peru
- Chile
- Argentina
- Rest of South America
- Europe
- United Kingdom
- Germany
- France
- Spain
- Italy
- BENELUX
- NORDICS
- Rest of Europe
- Asia-Pacific
- India
- China
- Japan
- Australia
- South Korea
- South East Asia
- Rest of Asia-Pacific
- Middle East and Africa
- United Arab Emirates
- Saudi Arabia
- South Africa
- Nigeria
- Rest of Middle East and Africa
- North America
Data Sources, Market Sizing, and Validation
Desk Research
Desk work starts by setting the demand context and the product boundary using public sources such as US Census Bureau retail and housing indicators, Eurostat household and energy statistics, UN Comtrade trade flows for appliance categories, and International Energy Agency efficiency and electrification signals. We also review standards and policy notes from agencies such as the US Department of Energy, plus peer reviewed articles on connected appliances and in-home IoT adoption to keep feature definitions consistent.
To ground company presence and pricing logic, we use annual reports, earnings decks, and product specification sheets, then cross-check them with reputable press coverage and association websites tied to home appliance manufacturing and consumer electronics. When needed, a paid subscription for company financials and a patent database are referenced to verify product roadmaps and relative scale by category. These examples are not exhaustive, and many other public sources were used for data collection, validation, and clarification during analysis.
Primary Interviews and Surveys
Primary work is used to pressure-test what we saw in public data by discussing unit shipment patterns, price bands, and attach rates for connectivity features with manufacturers, distributors, retailers, and service partners. Since this is a global market, inputs are validated across APAC, EMEA, and the Americas so that adoption differences, warranty behavior, and channel mix can be reflected in the final assumptions.
Distribution of primary research fieldwork respondents
| Company type | Respondent position | Region |
|---|---|---|
| Top tier: 27% | CXOs: 18% | APAC: 50% |
| Mid tier: 55% | Functional/Unit leaders: 33% | EMEA: 31% |
| Smaller Players: 18% | Managers: 49% | Americas: 19% |
Market-Sizing & Forecasting
Sizing is built mainly through a top-down approach where smart-appliance demand is reconstructed from the broader kitchen-appliance spending pool and then filtered by smart-home penetration, Wi-Fi enabled product availability, and category-level adoption rates. To keep the totals realistic, we corroborate outputs with selective bottom-up approximations, such as sampled average selling prices times estimated unit volumes for key products, plus channel checks on online versus offline share.
Inputs that matter in this market include connected-home adoption rates, replacement cycles for large appliances, the price premium for smart variants, promotion intensity in e-commerce, and energy-efficiency feature uptake (which often drives upgrades). Where primary inputs show uneven availability by country, we handle gaps by using proxy indicators like household broadband reach and appliance import trends, and then adjust with expert feedback. For forecasting, scenario analysis is used around key variables, and the final curve is chosen after aligning it with what interviewees expect for smart feature penetration and price normalization over the period.
Data Validation & Update Cycle
Validation is done by triangulating the model against independent signals, including regional appliance demand indicators, trade patterns, and observed pricing bands, and then checking whether implied penetration rates look reasonable by product type. Outliers are reviewed in multiple steps, and if a number moves too far from what channels or experts indicate, we re-check the underlying assumption and may re-contact sources to confirm.
The report is refreshed annually, and interim updates are triggered when material events occur, such as large pricing resets, supply constraints, or policy shifts tied to energy efficiency. Before delivery, we run a fresh review pass so the latest available public indicators and interview inputs are reflected in the published view.
Mordor Intelligence's Smart Kitchen Appliances Market Sizing Compared With Other Published Estimates
Published market values for smart kitchen appliances often do not match because teams count different product groups, use different base years, and apply different assumptions for smart feature penetration and pricing over time. Differences also show up when one estimate is built from a short forecast window versus a longer outlook that assumes faster adoption.
The main gap comes from the year used for the starting value and how quickly smart penetration is allowed to rise by product type, and Mordor Intelligence ties the 2025 to 2026 step to category-level adoption checks across smart refrigerators, smart ovens, smart dishwashers, and smart cookware and cooktops instead of applying one blended uplift across all kitchen appliances.
Benchmark comparison
| Source | Market Size | Gaps in Research Methodology |
|---|---|---|
| Mordor Intelligence | USD 23.68 B (2025) | |
| Global Consultancy A | USD 18.75 B (2023) | Uses an earlier base year and a higher stated growth run-rate into 2030, which can amplify totals if price premiums and adoption are assumed to rise uniformly across regions. |
| Industry Analyst B | USD 22.39 B (2028) | Reports a single end-point value for 2028 with a stated CAGR, but the base-year value is not clearly disclosed in the public summary, making the implied starting pool and penetration path harder to reconcile. |
Reading the three figures together, the spread is mostly explained by base-year selection, how product coverage is grouped, and whether penetration and pricing are stepped by category or applied as a broad average. Our approach keeps assumptions visible through simple drivers like adoption, price premium, and replacement cycle, which makes the total easier to repeat and to challenge with new evidence.


Key Questions Answered in the Report
What is the projected value of smart kitchen appliances worldwide by 2031?
The category is poised to reach USD 43.93 billion by 2031, expanding at an 10.86% CAGR from its 2026 baseline.
Which region shows the fastest revenue growth for connected cooking devices?
Europe is expected to record a 11.98% CAGR through 2031, outperforming other major regions due to strict energy rules and eco-conscious consumers.
How large is the connected refrigerator segment relative to other large appliances?
Refrigerators dominate large-appliance revenue due to features such as AI Vision item recognition, making them the anchor of many smart-kitchen ecosystems.
What factors restrain adoption of AI-enabled ovens in emerging economies?
High upfront pricing and concerns over cyber-security deter buyers, even though long-term energy savings are significant.
How are brands addressing interoperability anxieties among multi-brand households?
Leading manufacturers are adopting the open Matter 1.3 standard, enabling cross-brand control from a single app or voice assistant.
Why are commercial kitchens investing in connected dishwashers and ranges?
Restaurants pursue smart units to cut labor time, standardize cooking quality, and use predictive maintenance data to curb unplanned downtime.
Page last updated on:


 Your data is secure and never sold or shared.


