
Smart Home Safety Market Size and Share
Market Overview
| Study Period | 2020 - 2031 |
|---|---|
| Market Size (2026) | USD 41.69 Billion |
| Market Size (2031) | USD 90.93 Billion |
| Growth Rate (2026 - 2031) | 16.88% CAGR |
| Fastest Growing Market | Asia Pacific |
| Largest Market | North America |
| Market Concentration | Low |
Major Players *Disclaimer: Major Players sorted in no particular order Image © Mordor Intelligence. Reuse requires attribution under CC BY 4.0. | |
Smart Home Safety Market Analysis by Mordor Intelligence
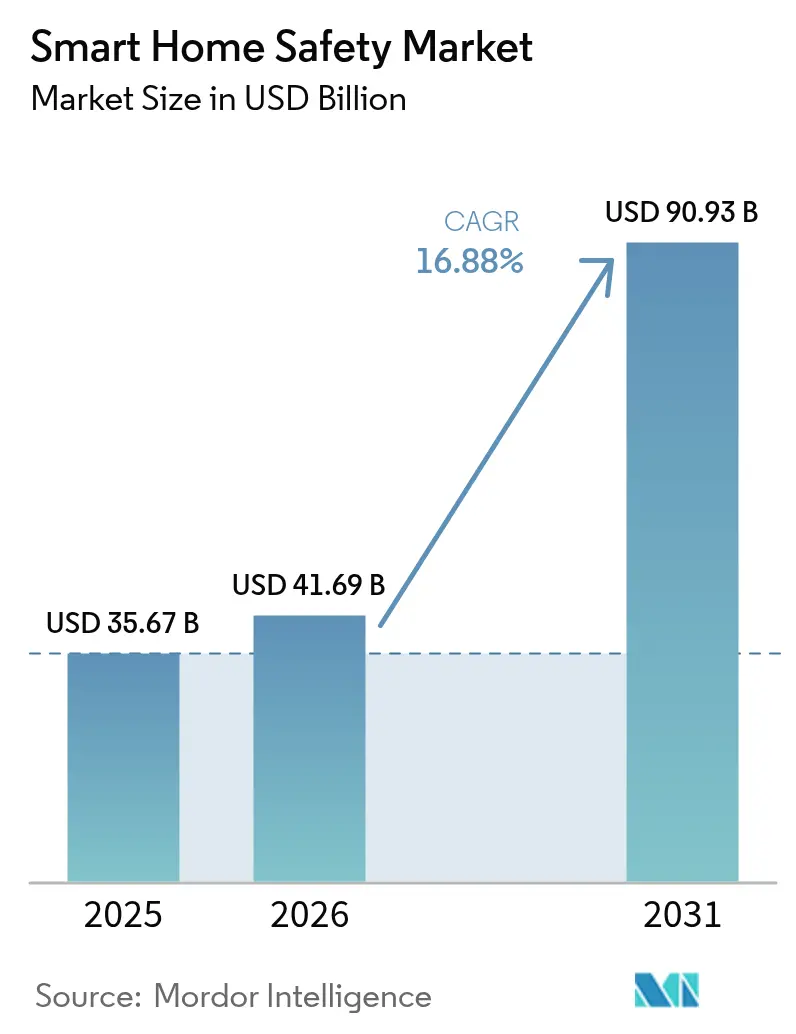
Smart Home Safety market size in 2026 is estimated at USD 41.69 billion, growing from 2025 value of USD 35.67 billion with 2031 projections showing USD 90.93 billion, growing at 16.88% CAGR over 2026-2031. Rising insurance incentives that lower premiums for connected homes, declining sensor prices, and EU retrofit programs that bundle safety devices with energy-efficiency upgrades remain decisive growth catalysts. Technology ecosystems continue to unify around Matter-compatible platforms, enabling cross-brand interoperability that accelerates multi-device adoption. Strategic acquisitions—such as Resideo’s purchase of Snap One—signal an accelerating race to control vertically integrated distribution and installation networks. Meanwhile, privacy-by-design requirements in the EU and California are prompting vendors to embed on-device analytics that minimize cloud exposure, a move that widens addressable demand among privacy-sensitive households.
Key Report Takeaways
- By device type, smart sensors and detectors led with a 29.78% share of the Smart Home Safety market in 2025, while integrated safety hubs are projected to advance at a 18.74% CAGR through 2031.
- By connectivity technology, Wi-Fi retained a 56.85% share in 2025, whereas Thread is forecast to grow at an 18.21% CAGR to 2031.
- By installation type, DIY solutions commanded a 67.62% share in 2025, yet professional installation services are expanding at a 18.96% CAGR during the same period.
- By sales channel, online platforms generated 58.15% revenue share in 2025 and are expected to record an 17.76% CAGR through 2031.
- By geography, North America accounted for a 39.25% share in 2025, while Asia-Pacific is the fastest-growing region with an 18.45% CAGR to 2031.
Note: Market size and forecast figures in this report are generated using Mordor Intelligence’s proprietary estimation framework, updated with the latest available data and insights as of 2026.
Global Smart Home Safety Market Trends and Insights
Drivers Impact Analysis*
| Driver | (~) % Impact on CAGR Forecast | Geographic Relevance | Impact Timeline |
|---|---|---|---|
| Rapid decline in sensor and camera ASPs | +3.2% | Global, strongest in APAC manufacturing hubs | Medium term (2-4 years) |
| Surge in insurance-partnered discounts | +2.8% | North America and EU, expanding to APAC urban centers | Short term (≤ 2 years) |
| Integration with voice assistants and home hubs | +2.1% | Global, led by North America and Western Europe | Medium term (2-4 years) |
| Rising burglary and fire incidents in urban areas | +1.9% | Global urban centers, particularly emerging market cities | Long term (≥ 4 years) |
| Mandated remote home-care monitoring in ageing nations | +1.7% | Japan, Germany, South Korea, with spillover to other developed markets | Long term (≥ 4 years) |
| EU energy-efficiency retrofit funds bundling safety IoT | +1.5% | European Union, potential replication in other developed regions | Medium term (2-4 years) |
| Source: Mordor Intelligence | |||
Rapid Decline in Sensor and Camera ASPs
Due to oversupply in legacy semiconductor lines, component costs for motion, smoke, and CO sensors continue to fall, letting manufacturers position full entry-level kits below USD 200 while preserving margins through subscription monitoring. Platform vendors respond by bundling predictive analytics subscriptions that lift lifetime customer value. These dynamics broaden the Smart Home Safety market beyond premium households, with emerging-economy retailers now offering starter kits through micro-financing models. Hardware commoditization is simultaneously pushing incumbents toward software differentiation and service revenues. The resulting deflationary pressure remains a decisive tailwind for the Smart Home Safety market.
Surge in Insurance-Partnered Discounts
Property insurers increasingly treat real-time sensor data as actuarial gold. State Farm, Liberty Mutual, and other carriers provide equipment subsidies or 5%-20% premium reductions in exchange for data feeds that verify device status. These programs shorten payback periods to as little as three years and create recurring sales funnels for device makers and professional installers. The virtuous cycle deepens as lower claim ratios validate actuarial modeling, prompting insurers to expand incentives to new product classes such as water-leak sensors and aging-in-place monitors.
Integration with Voice Assistants and Home Hubs
Voice platforms have matured into safety orchestrators that fuse data from cameras, door locks, and environmental sensors. Amazon’s Alexa+ introduces generative AI routines that autonomously call emergency services when correlated anomaly thresholds are met. Thread 1.4’s low-latency mesh further reduces reliance on cloud relays, enabling sub-second alarm triggers within the home. [1]Thread Group, “Thread 1.4 Paves The Path For Smart Devices To Work Together,” threadgroup.org As vendors bake privacy-preserving edge analytics into hubs, adoption among EU consumers—historically wary of surveillance risk—has started to climb.
Rising Burglary and Fire Incidents in Urban Areas
Municipal crime statistics show persistent upticks in property offenses in dense metros, while fire departments report rising kitchen-related incidents as households cook more frequently post-pandemic. Insurers estimate that 60% of burglars bypass homes displaying visible smart alarms, supporting demand for deterrence-oriented installations. Governments now pilot neighborhood crime-mapping projects that crowd-source sensor alerts, positioning the Smart Home Safety market as a public-private lynchpin for urban resilience.
Restraints Impact Analysis*
| Restraint | (~) % Impact on CAGR Forecast | Geographic Relevance | Impact Timeline |
|---|---|---|---|
| High upfront device and installation cost | -2.1% | Global, strongest in emerging markets and price-sensitive segments | Short term (≤ 2 years) |
| Cyber-vulnerability and privacy concerns | -1.8% | Global, notably EU and California | Medium term (2-4 years) |
| Radio-spectrum congestion in dense smart-cities | -0.9% | Urban centers in developed markets, expanding to emerging megacities | Long term (≥ 4 years) |
| Low-income rental regulations limiting fixture changes | -0.7% | North America and EU rental markets, potential expansion globally | Medium term (2-4 years) |
| Source: Mordor Intelligence | |||
High Upfront Device and Installation Cost
Although hardware is cheaper, full-suite smart safety packages with professional installation still start near USD 900, with monitoring fees adding USD 25-USD 50 monthly. Cost sensitivity delays uptake among lower-income homeowners and renters. Tariff-linked price increases on Chinese imports amplify sticker shock, even as insurers partially offset expenditures with premium credits. Vendors respond by offering hardware-as-a-service bundles that spread costs over multi-year contracts—a model emulating mobile phone plans—to keep the Smart Home Safety market accessible.
Cyber-Vulnerability and Privacy Concerns
High-profile IoT breaches have seeded distrust, especially in the EU, where the Cyber Resilience Act mandates secure-by-design features from June 2025. [2]European Commission, “Energy Performance of Buildings Directive,” energy.ec.europa.eu Consumers fear that compromised cameras or smart locks could provide attackers with physical access. Industry standards now require end-to-end encryption, automatic patching, and on-device anonymization. Edge analytics—processing video streams locally—emerges as a key mitigation that reassures privacy-conscious buyers and supports the continued expansion of the Smart Home Safety market.
*Our forecasts treat driver/restraint impacts as directional, not additive. The impact forecasts reflect baseline growth, mix effects, and variable interactions.
Segment Analysis
By Device Type: Sensors Drive Volume, Hubs Command Premium
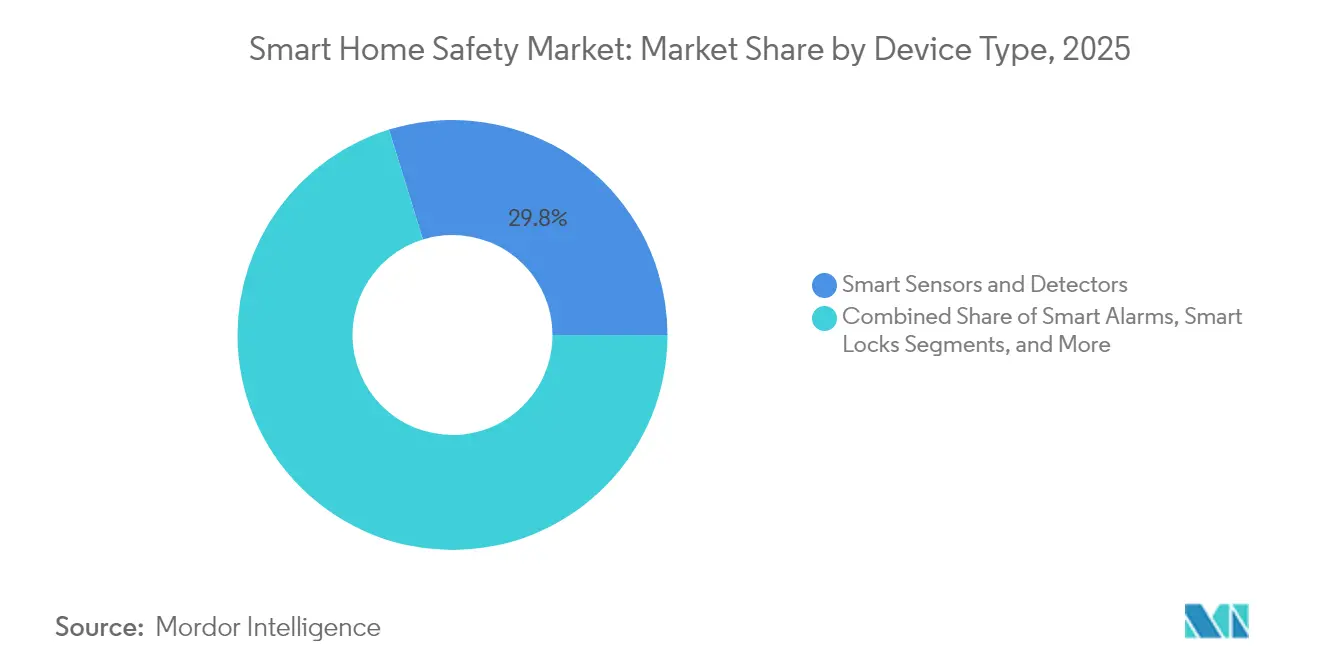
Smart sensors and detectors secured a 29.78% Smart Home Safety market share in 2025, anchored by building-code mandates for smoke and carbon-monoxide alarms. Integrated safety hubs, though smaller in revenue today, exhibit the highest momentum with a projected 18.74% CAGR through 2031 as households favor single-app control. Competitive positioning now hinges on AI algorithms that fuse motion, acoustic, and temperature data into predictive alerts. Vendors diversify revenue by linking hubs to premium cloud analytics, reinforcing service-centric business models in the Smart Home Safety market.
Convergence trends place smart cameras, locks, and environmental monitors behind unified interfaces, expanding hub attach rates. Matter-compliant devices reassure buyers about forward compatibility, encouraging multi-device bundles that lift average selling prices. As hubs relay real-time diagnostics to insurers, claims processing times fall, creating feedback loops that drive further installations. Niche devices—such as smart glass break sensors—remain nascent but gain traction in commercial-residential hybrid properties keen on high security. Overall, resilient volume growth in foundational sensors guarantees baseline demand, while hubs capture disproportionate profit pools within the Smart Home Safety market.


By Connectivity Technology: Wi-Fi Dominance Challenged by Thread Innovation
Wi-Fi accounted for 56.85% of the Smart Home Safety market size in 2025, due to near-universal home router penetration that simplifies onboarding. However, bandwidth contention and power draw limitations spur migration to Thread, which is forecast to expand at an 18.21% CAGR. Thread 1.4 bolsters star-mesh topologies, allowing battery-powered sensors to self-heal network paths without proprietary gateways. Zigbee remains relevant in professionally installed projects that prioritize interference resilience, while Z-Wave's proprietary stack sees diminishing OEM support amid Matter convergence.
Multi-protocol hubs now incorporate Wi-Fi 6 for high-definition video, Thread for low-power peripherals, and cellular failover for redundancy. Vendors emphasize seamless roaming between 2.4 GHz and 6 GHz bands to reduce latency for emergency signals. As broadband providers ship Wi-Fi 7 routers with integrated Thread border routers, interoperability hurdles continue to fall, widening the addressable base of the Smart Home Safety market.
By Installation Type: DIY Popularity Masks Professional Growth
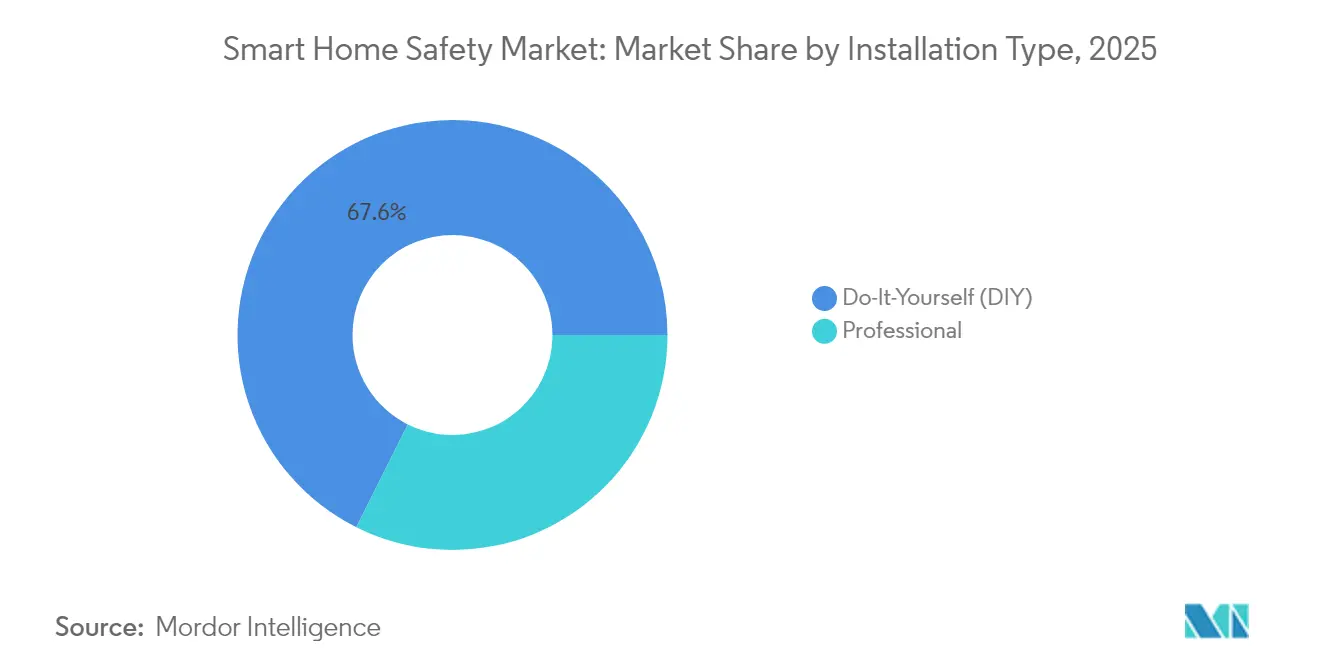
DIY packages captured 67.62% Smart Home Safety market share in 2025 as app-guided setup and drop-in battery designs let homeowners install devices in under 30 minutes. Yet professional services are outpacing overall sector growth at a 18.96% CAGR, powered by insurer requirements for certified installations and by larger multi-sensor deployments in high-value properties. Companies such as Resideo leverage nationwide installer networks acquired through Snap One to upsell monitoring subscriptions.
The bifurcation is likely to persist: entry-level users start with DIY sensors and migrate to professionally integrated systems as they add cameras, smart locks, and water-leak detectors. Professional installers differentiate by offering periodic maintenance, firmware updates, and guaranteed alarm compliance—all features that raise switching costs and deepen customer stickiness in the Smart Home Safety market.
By Sales Channel: Online Dominance Accelerates Across Segments
E-commerce platforms generated 58.15% of 2025 device revenues and continue to gain ground as brands pivot to direct-to-consumer storefronts that bundle hardware with app subscriptions. Online configurators now simulate room layouts, helping buyers optimize sensor placement before checkout. Insurance portals act as emerging sales conduits, issuing coupon codes that link discounted hardware to policyholder IDs when devices come online.
Brick-and-mortar specialty retailers protect their share by hosting live demos and offering same-day professional installation booking, but foot traffic shifts toward click-and-collect models. Big-box chains focus on entry-level kits positioned alongside smart speakers, reinforcing ecosystem lock-in for first-time purchasers. Across channels, unified inventory data and drop-ship logistics improve fulfillment speed, keeping the Smart Home Safety market aligned with broader omnichannel retail evolution.
Geography Analysis
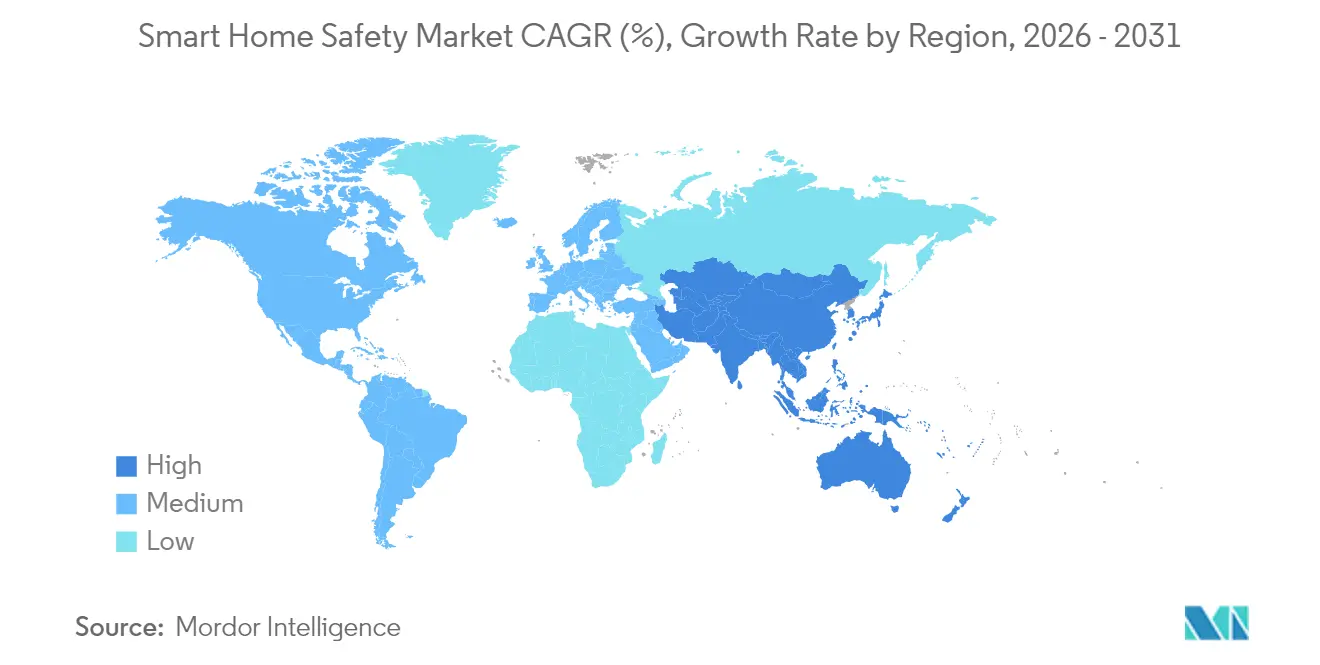
North America retained 39.25% Smart Home Safety market share in 2025, supported by entrenched monitoring subscriptions and aggressive carrier-insurance collaborations that subsidize hardware. Federal energy standards increasingly reference connected safety devices as acceptable paths for compliance, creating indirect regulatory pull. Margins remain healthy despite tariff headwinds because premium service revenues offset hardware inflation. Canada follows similar patterns, while Mexico leverages near-shoring trends to attract device assembly investments that lower domestic prices.
Asia-Pacific is the fastest-growing region, advancing at an 18.45% CAGR through 2031. Japan pioneers aging-in-place programs that reimburse families for AI-equipped monitoring packages. China scales mass-market deployments through municipal smart-city budgets, though global vendors face data-sovereignty regulations that necessitate local data centers. India and Southeast Asia benefit from rising smartphone penetration and fintech-enabled micro-installment plans that spread hardware costs. Australia and Singapore adopt premium biometrics early, setting benchmarks that gradually diffuse regionally.
Europe balances privacy rules with retrofit mandates. The Energy Performance of Buildings Directive ties public funding to the integration of energy-saving and safety technologies, channeling capital toward bundled IoT packages. Germany’s technical standards institution formalizes guidelines for interoperable smoke detectors, whereas the UK deploys community-oriented grants that fund neighborhood camera networks. Southern European markets accelerate late-cycle growth as EU cohesion funds underwrite apartment-block renovations that include connected alarms. Eastern Europe attracts contract manufacturers with competitive labor costs, positioning the sub-region as an export base for the broader Smart Home Safety market.

Regulatory Landscape
Cybersecurity rules for consumer connected safety devices are tightening across major regions. In the European Union, Regulation (EU) 2024/2847 (Cyber Resilience Act), enacted on 23 October 2024, sets horizontal secure-by-design requirements for products with digital elements, explicitly covering categories used in smart home safety such as smart locks, security cameras, alarm systems, and baby monitors. The Act introduces staged obligations, including incident reporting obligations starting 11 September 2026 and broader requirements applying from 11 December 2027.
In the United Kingdom, the Product Security and Telecommunications Infrastructure (Security Requirements for Relevant Connectable Products) Regulations 2023 entered into force on 29 April 2024, setting baseline security requirements for relevant consumer IoT products. Australia added a mandatory compliance layer with the Cyber Security (Security Standards for Smart Devices) Rules 2025, which commenced on 4 March 2026 under the Cyber Security Act 2024. This requires in-scope consumer connectable smart devices manufactured on or after that date to meet prescribed security standards and to be supported by a statement of compliance. In the United States, regulatory expectations still lean on guidance, with NIST publications such as NIST IR 8259A (IoT Device Cybersecurity Capability Core Baseline) and NIST IR 8425 (consumer profile) used as reference controls by vendors and procurement programs.
Value Chain Analysis
The smart home safety value chain begins upstream with sensor, MCU/SoC, camera module, connectivity silicon (Wi-Fi, Thread, Zigbee, Bluetooth, cellular), and power components, then moves to OEM/ODM manufacturing and firmware development. Standards and certification act as a midstream gate: the Connectivity Standards Alliance released Matter 1.4 on 4 November 2024, and in September 2025 launched the Matter Compliant Platform Certification program to validate core platform functions (including commissioning, networking, and security). This lets device makers build on pre-validated stacks and reduce integration risk across multi-brand ecosystems.
Downstream, distribution passes through direct-to-consumer e-commerce, retail, broadband/telecom bundles, insurers, and professional installer channels, while monitoring and subscription software extends the chain into recurring services. Post-market operations are increasingly shaped by lifecycle cybersecurity duties, including vulnerability handling and updates, which map to the EU Cyber Resilience Act timetable (with reporting starting in September 2026 and broader obligations applying from December 2027) and to Australia’s 4 March 2026 commencement of mandatory smart-device security rules. These compliance steps raise the importance of secure firmware supply chains, vulnerability disclosure processes, and audit-ready documentation alongside the traditional hardware-to-installation flow.
Competitive Landscape
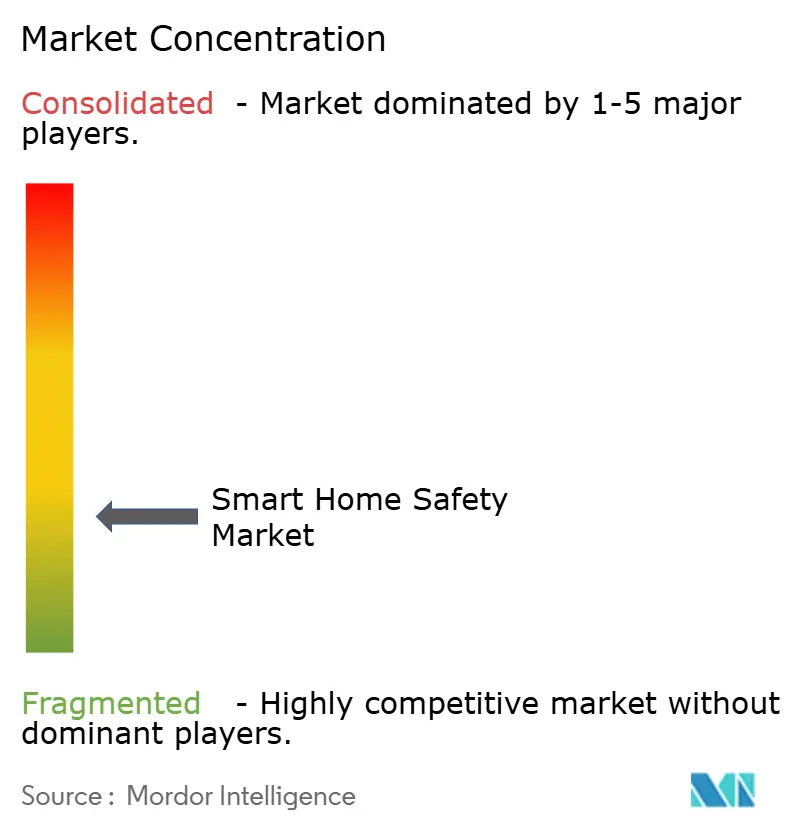
Fragmentation defines today’s Smart Home Safety market, with top five vendors controlling far below 30% of global revenue. Established security incumbents—ADT, Vivint, and Resideo—leverage monitoring subscriber bases to fund R&D in AI-assisted analytics. Tech majors—Amazon, Google, and Apple—bet on ecosystem stickiness by embedding safety features inside voice hubs and wearables. Start-ups focus on hyper-specific use cases, such as palm-vein smart locks introduced by eufy at USD 399.99 that promise 99.99999% authentication accuracy.
Acquisition momentum rose in 2024-2025 as platform owners sought channel depth and proprietary firmware. Resideo’s Snap One purchase expanded its installer reach and private-label catalog, while ADT’s ongoing integration with Google Nest enhances computer-vision precision without heavy hardware redesign costs. Innovation cycles shrink: Thread 1.4 adoption moved from specification to shipping products in fewer than 12 months, forcing laggards into licensing deals or risking obsolescence.
Competitive differentiation now pivots on service reliability, privacy protections, and ecosystem breadth. Vendors integrating end-to-end encryption and local video analytics win contracts in stringent EU markets. Others cultivate insurer alliances that guarantee minimum hardware volumes. As price competition intensifies at the device level, profitable expansion hinges on subscription software lifecycles that extend revenue beyond the initial sale, reinforcing a service-centric trajectory for the Smart Home Safety market.
Smart Home Safety Industry Leaders
ADT Inc.
Amazon Ring LLC
Google Nest Labs LLC
Simplisafe Inc.
Vivint Smart Home Inc.
- *Disclaimer: Major Players sorted in no particular order

Market Opportunities and Future Outlook
Interoperability and platform-level certification are creating whitespace for cross-brand safety bundles that combine sensors, locks, cameras, and hubs without locking households into single-vendor stacks. Matter 1.4 (released 4 November 2024) and the Connectivity Standards Alliance’s Matter Compliant Platform Certification program (announced September 2025) give device vendors and service providers a practical path to ship devices that operate across major ecosystems, while improving visibility around commissioning and other security-critical functions.
Cybersecurity-by-design requirements are also reshaping product roadmaps and opening room for differentiation in privacy-preserving safety capabilities, such as edge analytics and non-camera ambient sensing. Under the EU Cyber Resilience Act (enacted 23 October 2024), which defines device categories relevant to smart home safety and introduces incident reporting obligations starting 11 September 2026, vendors with structured vulnerability management and update commitments can broaden access to regulated channels and insurer-backed programs. In parallel, Australia’s Cyber Security (Security Standards for Smart Devices) Rules 2025, commencing 4 March 2026, increases demand for compliant product lines and for services that help manufacturers and installers manage documentation, statements of compliance, and security update obligations across jurisdictions.
Recent Industry Developments
- June 2026: ADT joined the Board of Directors of the Connectivity Standards Alliance (CSA). The move places a major security provider inside Matter-led interoperability governance, reinforcing cross-brand compatibility as a priority for professionally monitored and app-centric safety ecosystems. It also supports faster alignment between security service requirements and evolving device connectivity standards.
- May 2026: ADT launched ADT Blu, a self-installed home security system sold online, including availability via Amazon.com. This expands ADT more directly into the DIY segment that already dominates unit volumes, while creating a new channel to upsell services and subscriptions beyond traditional professionally installed packages.
- November 2025: Vivint introduced HomeProtect and HomeProtect Pro smart home safety offerings. The launch strengthens product tiering around integrated home safety and monitoring use cases, supporting bundled subscriptions and higher attach rates for multi-device configurations.


Research Methodology Framework and Report Scope
Market Definition and Coverage
For this study, we define smart home safety as connected devices and systems used in homes to detect, deter, and alert for safety and security events, with value measured from product and related monitoring revenue tied to residential use.
Scope exclusions: Excludes non-residential building security systems and industrial safety equipment that are not designed or marketed for home deployment.
Segmentation Overview
- By Device Type
- Smart Alarms
- Smart Locks
- Smart Sensors and Detectors
- Smart Cameras and Monitoring Systems
- Integrated Safety Hubs
- Other Device Types
- By Connectivity Technology
- Wi-Fi
- Bluetooth
- Zigbee
- Z-Wave
- Thread
- Cellular/LTE
- Other Connectivity
- By Installation Type
- Do-It-Yourself (DIY)
- Professional
- By Sales Channel
- Online
- Offline – Specialty Stores
- Offline – Mass Retail and Home-Improvement Stores
- By Geography
- North America
- United States
- Canada
- Mexico
- South America
- Brazil
- Argentina
- Chile
- Rest of South America
- Europe
- Germany
- United Kingdom
- France
- Italy
- Spain
- Russia
- Rest of Europe
- Asia-Pacific
- China
- India
- Japan
- South Korea
- Singapore
- Malaysia
- Australia
- Rest of Asia-Pacific
- Middle East and Africa
- Middle East
- United Arab Emirates
- Saudi Arabia
- Turkey
- Rest of Middle East
- Africa
- South Africa
- Nigeria
- Rest of Africa
- Middle East
- North America
Data Sources, Market Sizing, and Validation
Desk Research
Desk work started by mapping what is counted as a smart home safety offering, then building a consistent view of demand signals across regions. We leaned on public sources such as the US Census Bureau (housing stock and new construction), Eurostat (household and dwelling indicators), the International Telecommunication Union (broadband access trends), and fire and safety publications from agencies such as the NFPA (home incident patterns that shape device adoption).
To keep the numbers grounded, we also reviewed manufacturer filings, investor decks, product catalogs, and reputable news coverage that discusses shipment momentum and subscription attachment. Where needed, we referenced company financials and intelligence and patent databases to cross-check revenue exposure and product focus without depending on any single company narrative. These desk research sources are illustrative, and many other public documents and databases were also used for data collection, validation, and clarification.
Primary Interviews and Surveys
Primary work relied on interviews and short surveys with device brands, channel partners, installers, monitoring service providers, and smart home platform stakeholders, followed by end user and property management perspectives where useful. We used these discussions to verify attach rates, price bands, DIY versus professional mix, and the speed of upgrades when standards (for example, interoperability) reduce replacement concerns across regions.
Distribution of primary research fieldwork respondents
| Company type | Respondent position | Region |
|---|---|---|
| Top tier: 34% | CXOs: 14% | APAC: 46% |
| Mid tier: 52% | Functional/Unit leaders: 34% | EMEA: 29% |
| Smaller Players: 14% | Managers: 52% | Americas: 25% |
Market-Sizing & Forecasting
Sizing begins with a top-down demand pool build that ties household counts, broadband connected homes, and penetration of key safety devices into a value series by region. Once the addressable installed base is shaped, revenues are reconstructed using inputs such as replacement cycles, DIY versus professionally installed mix, typical device bundles (camera, lock, sensors), and subscription attach rates for monitoring where applicable.
We then corroborate totals with selective bottom-up approximations, including supplier and channel checks and sampled ASP timing against unit volumes across major device groups. This approach helps adjust for regions where public disclosure is limited. When gaps appear in smaller countries or newer product lines, the model uses proxy indicators such as housing completions, urban household growth, and connectivity readiness, then normalizes these assumptions using interview-based sanity checks.
For forecasting, scenario analysis is used, since adoption and pricing can move differently by region when regulations, insurance incentives, or interoperability standards shift. The forward drivers we track include new home starts and retrofits, broadband quality, average selling price progression by device type, subscription penetration, and changes in installation preferences, with assumptions pressure tested using the expert inputs collected during fieldwork.
Data Validation & Update Cycle
Model outputs are triangulated against independent signals, such as household connectivity trends, housing stock growth, and category-level shipment or sales commentary seen in public disclosures. Outliers are flagged, and we re-check underlying drivers, for example, pricing jumps, unusually high penetration assumptions, or sudden mix shifts between DIY and professional installs, before internal sign-off.
Each report is refreshed annually, and interim updates are triggered when material events occur, such as regulatory changes, major platform standard rollouts, or sharp macro demand shifts. Before delivery, an analyst runs a final pass to ensure inputs, FX assumptions used in conversion timing, and recent announcements are reflected so clients receive the latest updated view.
Mordor Intelligence's Smart Home Safety Market Size Measured Against Other Published Estimates
Published market values for smart home safety can look far apart, even when the topic sounds similar, because the counted products, revenue types, and years are not aligned. Differences also come from how each study treats subscriptions, bundles, and how quickly device prices change as features become standard.
Commercial building security and access control often gets blended into some estimates, but it sits outside Mordor Intelligence's scope here, which keeps the size tied to residential safety devices and related monitoring signals. Variation also shows up when one publisher uses aggressive subscription attachment, applies a single global ASP, or does not re-check penetration rates with installer and channel feedback in each major region.
Benchmark comparison
| Source | Market Size | Gaps in Research Methodology |
|---|---|---|
| Mordor Intelligence | USD 41.69 B (2026) | |
| Industry Association A | USD 35.00 B (2024) | Often reported as a broader smart home safety solutions value using earlier base-year revenues, and it may rely on high-level category rollups without separating residential-only device revenues from adjacent building security. |
| Trade Journal B | USD 33.20 B (2025) | Typically anchored on a narrower product subset and conservative subscription contribution, with limited transparency on regional penetration assumptions and currency conversion timing across multi-region revenue. |
The spread in the table mainly reflects scope boundaries, year alignment, and how recurring monitoring revenue is handled. By keeping the model traceable to household adoption signals, device price bands, and validated attach rates, the resulting market size stays easier to reproduce and update when conditions change.


Key Questions Answered in the Report
What is the projected size of the Smart Home Safety market by 2031?
The Smart Home Safety market is expected to reach USD 90.93 billion by 2031, growing at a 16.88% CAGR from 2026.
Which device category led the Smart Home Safety market in 2025?
Smart sensors and detectors led with a 29.78% share, reflecting their role as mandatory safety components in residential buildings.
Why are insurers interested in smart home safety devices?
Real-time data from connected sensors lowers claim frequency, so insurers offer 5%-20% premium discounts or subsidized hardware, accelerating adoption.
How is Thread 1.4 influencing connectivity choices?
Thread 1.4’s low-power mesh and cross-brand compatibility drive an 18.21% CAGR for Thread-based devices, challenging Wi-Fi’s dominance.
What main barrier limits smart safety adoption in emerging markets?
High upfront equipment and installation costs remain the primary restraint, especially when tariff-related price increases push systems beyond household budgets.
Are privacy regulations helping or hindering market growth?
Stricter rules initially slowed uptake, but they now foster trust by mandating secure-by-design features, ultimately supporting sustained expansion of the Smart Home Safety market.
Page last updated on:






