
Smart Healthcare Products Market Size and Share
Market Overview
| Study Period | 2020 - 2031 |
|---|---|
| Market Size (2026) | USD 249.23 Billion |
| Market Size (2031) | USD 425.18 Billion |
| Growth Rate (2026 - 2031) | 11.27 % |
| Fastest Growing Market | Asia-Pacific |
| Largest Market | North America |
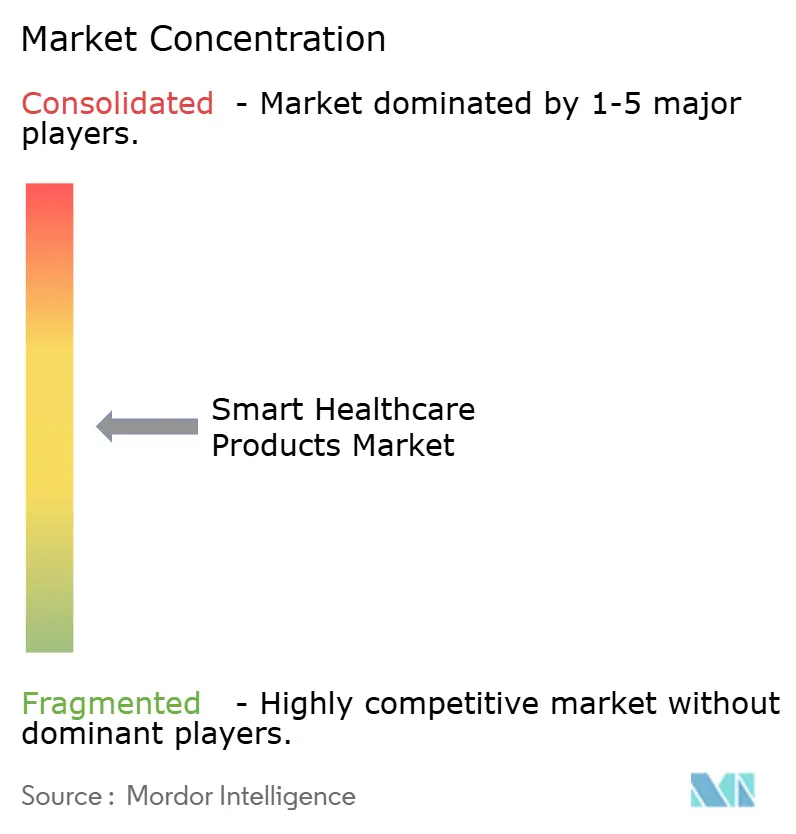
| Market Concentration | Medium |
Major Players *Disclaimer: Major Players sorted in no particular order Image © Mordor Intelligence. Reuse requires attribution under CC BY 4.0. | |
Smart Healthcare Products Market Analysis by Mordor Intelligence
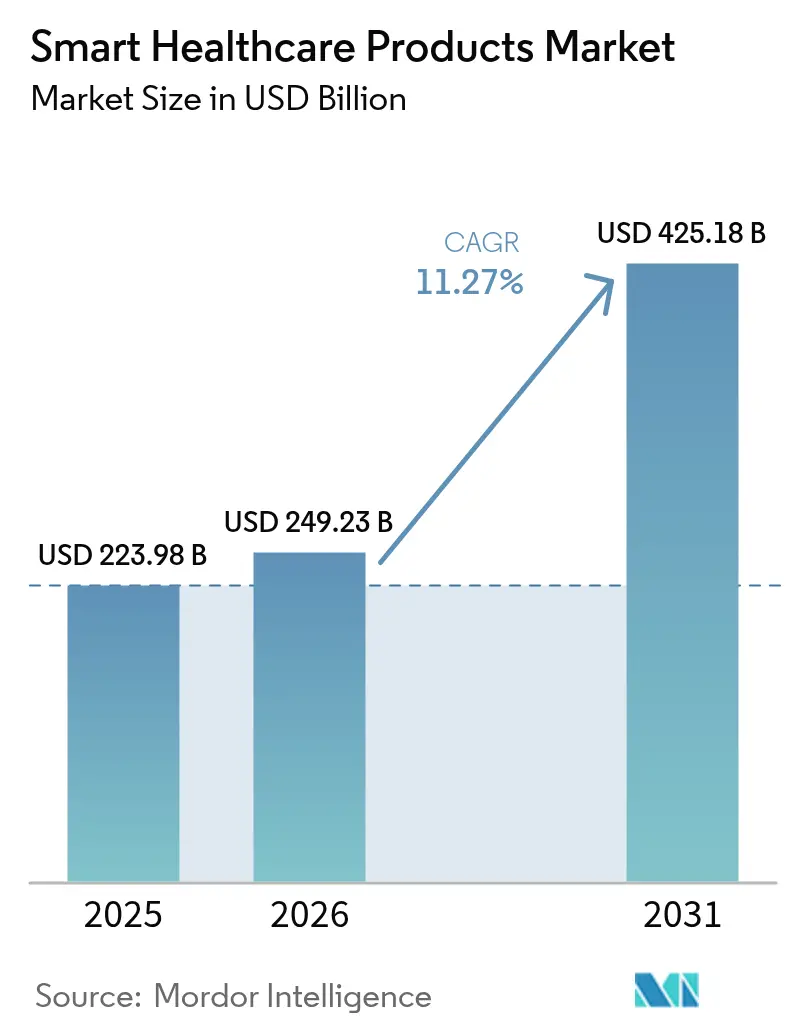
The smart healthcare products market size was valued at USD 223.98 billion in 2025 and estimated to grow from USD 249.23 billion in 2026 to reach USD 425.18 billion by 2031, at a CAGR of 11.27% during the forecast period (2026-2031). Rising deployment of IoT-enabled devices, the convergence of artificial intelligence with clinical workflows, and reimbursement models that now cover remote monitoring solutions are accelerating adoption. Government incentives such as Singapore’s USD 150 million GenAI programme and the European Health Data Space Regulation are standardising data exchange, reducing integration costs, and stimulating supplier investment. Strategic partnerships among device makers, cloud providers, and hospital systems are reshaping competitive strategies, while cybersecurity regulations tighten compliance requirements. Taken together, these forces propel the smart healthcare products market, even as capital-intensive infrastructure and data-privacy concerns temper the growth trajectory.
Key Report Takeaways
- By product type, Electronic Health Records commanded 28.11% of smart healthcare products market share in 2025; Smart Wearable Devices are projected to grow at a 18.87% CAGR to 2031.
- By application, Remote Monitoring accounted for 41.93% of the smart healthcare products market size in 2025, whereas Wellness & Preventive Care is advancing at a 17.43% CAGR through 2031.
- By end user, Hospitals held 49.71% share of the smart healthcare products market size in 2025, while Home-Care Settings are expanding at a 18.79% CAGR.
- By geography, North America retained the regional lead with 37.47% share in 2025; Asia-Pacific is the fastest-growing region at a 16.96% CAGR to 2031.
Note: Market size and forecast figures in this report are generated using Mordor Intelligence’s proprietary estimation framework, updated with the latest available data and insights as of 2026.
Market Trends and Insights
Drivers Impact Analysis of Smart Healthcare Products Market*
| Driver | (~) % Impact on CAGR Forecast | Geographic Relevance | Impact Timeline |
|---|---|---|---|
| Rising adoption of IoT-enabled medical devices | +2.8% | Global with APAC leading growth | Medium term (2-4 years) |
| Escalating chronic-disease burden & ageing demographics | +2.1% | Global, concentrated in developed markets | Long term (≥ 4 years) |
| Government incentives for digital-health infrastructure | +1.9% | APAC & EU primary, North America secondary | Short term (≤ 2 years) |
| Broader reimbursement for telemedicine services | +1.7% | North America & EU | Medium term (2-4 years) |
| Wearable ultrasound & smart textiles for continuous care | +1.4% | Global, early adoption in developed markets | Long term (≥ 4 years) |
| Energy-efficient lightweight cryptography enabling ultra-low-power sensors | +1.1% | Global, technology-driven | Long term (≥ 4 years) |
| Source: Mordor Intelligence | |||
Rising Adoption of IoT-Enabled Medical Devices
The proliferation of connected devices is reshaping clinical practice by capturing patient data in real time and delivering actionable insights at the point of care. Remote patient monitoring users in the United States are expected to surpass 71 million by 2025 as 5G networks lower transmission latency to 110 milliseconds, reducing packet loss to 0.07%[1]. Healthcare provider spending on edge computing is forecast to reach USD 10.3 billion in 2025, supporting predictive analytics for early-stage intervention. Asia-Pacific suppliers are rolling out AI-driven wearables that detect arrhythmia and glucose anomalies, creating new revenue pools and raising interoperability requirements. Device makers are embedding secure chipsets that consume 30% less power, extending battery life for long-term monitoring. Collectively, these factors improve clinical outcomes and drive volume growth across the smart healthcare products market.
Escalating Chronic-Disease Burden & Ageing Demographics
Chronic diseases accounted for 74% of global deaths in 2024, with the highest burden in Asia-Pacific economies. Continuous monitoring solutions reduce hospital readmissions by 85%, generating tangible savings for payers while enhancing patient satisfaction scores to 97%. An ageing population requires long-term care, triggering demand for smart beds, fall-detection sensors, and AI-enabled imaging. The economic upside is considerable, with AI projected to save up to USD 360 billion annually by trimming diagnostic errors and administrative overhead. Countries with universal healthcare systems are integrating smart healthcare products into chronic-disease programmes, accelerating volume deployment and standardising data exchange protocols.
Government Incentives for Digital-Health Infrastructure
Public-sector funding is catalysing digital transformation across care settings. South Korea has earmarked USD 830 million through 2032 for AI-based emergency care systems, including live bed-capacity dashboards and smart triage. Singapore committed USD 150 million to implement generative AI for clinical documentation and imaging analysis. The European Health Data Space Regulation, effective March 2025, sets interoperability standards, easing cross-border EHR access and fostering vendor competition[2]. These programmes shorten procurement cycles, raise digital-health literacy, and underpin the smart healthcare products market’s expansion phase.
Broader Reimbursement for Telemedicine Services
Medicare telehealth flexibilities extended through March 2025 allow beneficiaries to receive non-behavioral health consultations at home, with more than 250 reimbursable codes listed. The American Medical Association added 17 virtual-care billing codes, while commercial payers introduced payment parity rules. These measures incentivise providers to embed connected devices into chronic-care pathways and broaden access in rural areas. North American health systems now integrate RPM data into EHRs, enabling precise dosing and AI-guided alerts. Reimbursement certainty accelerates device procurement and helps suppliers move beyond pilot projects into scaled deployments across the smart healthcare products market.
Restraints Impact Analysis of Smart Healthcare Products Market*
| Restraint | (~) % Impact on CAGR Forecast | Geographic Relevance | Impact Timeline |
|---|---|---|---|
| High capital cost of smart healthcare ecosystems | -1.8% | Global, more pronounced in emerging markets | Short term (≤ 2 years) |
| Cyber-security & data-privacy concerns | -1.5% | Global, stricter in EU & North America | Medium term (2-4 years) |
| BLE protocol vulnerabilities triggering compliance delays | -1.2% | Global, affecting connected device adoption | Short term (≤ 2 years) |
| Supply-chain fragility for advanced mini-sensors | -0.9% | Global, semiconductor-dependent regions | Medium term (2-4 years) |
| Source: Mordor Intelligence | |||
High Capital Cost of Smart Healthcare Ecosystems
Deploying IoT platforms, edge servers, and cybersecurity layers requires sizable upfront outlays that smaller providers struggle to finance. Proposed HIPAA revisions could cost regulated entities USD 9.3 billion in the first year, covering encryption, multifactor authentication, and training mandates. Legislators introduced the Health Infrastructure Security and Accountability Act, which budgets USD 1.3 billion for standards compliance but still leaves hospitals funding the bulk of upgrades. Capital intensity slows rollouts in emerging markets where reimbursement remains fee-for-service and margins are thinner. Vendors are responding with device-as-a-service contracts that spread costs over multi-year terms. Yet adoption timelines remain contingent on financing availability, weighing on near-term units shipped in the smart healthcare products market.
Cyber-Security & Data-Privacy Concerns
More than 180 million individuals were affected by healthcare data breaches in 2024, underscoring that patient information remains an attractive target. FDA guidance now requires manufacturers to submit software bill-of-materials documentation and implement patch management plans prior to device clearance. The heightened compliance bar increases engineering costs and extends time-to-market. Hospitals must layer zero-trust architectures atop legacy networks, diverting budgets from clinical modernization. Strict EU GDPR penalties further elevate risk, leading some providers to delay cross-border data-exchange projects. Consequently, cybersecurity concerns act as a drag on the smart healthcare products market, especially for smaller entrants with limited security resources.
*Our forecasts treat driver/restraint impacts as directional, not additive. The impact forecasts reflect baseline growth, mix effects, and variable interactions.
Smart Healthcare Products Market Segment Analysis
By Product Type:
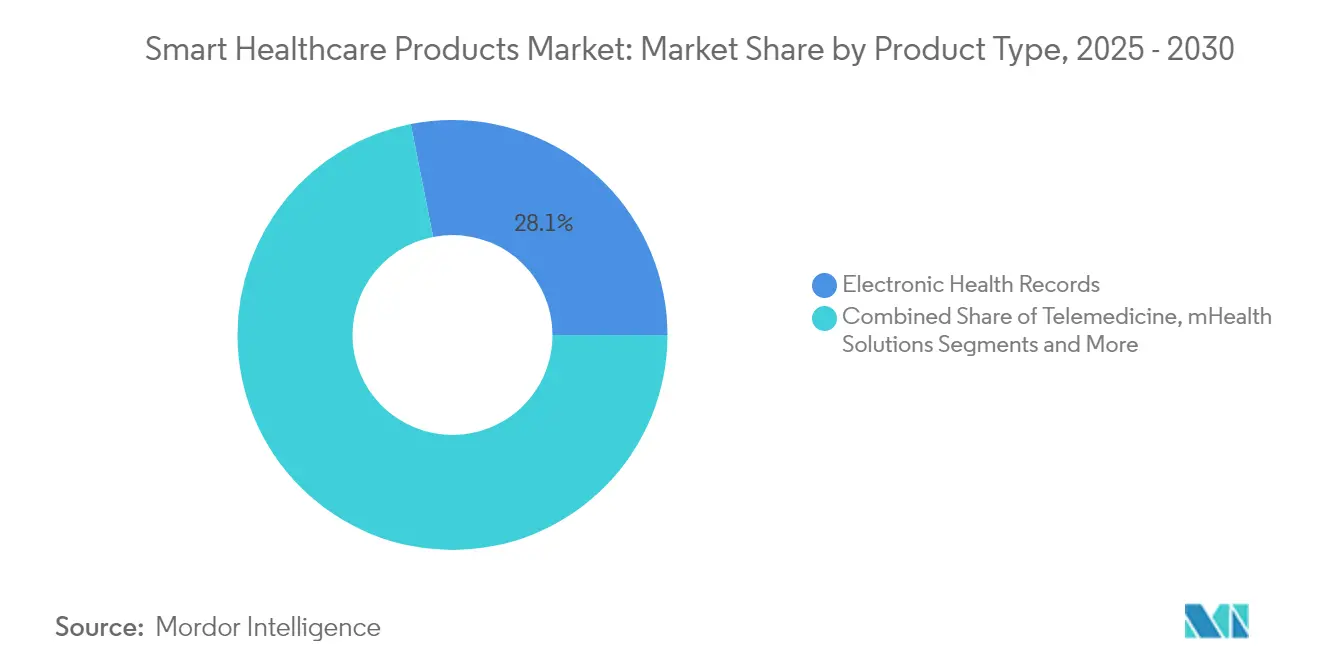
EHR Dominance Challenged by Wearable InnovationElectronic Health Records contributed 28.11% to overall revenue in 2025, underlining their position as the data backbone of clinical workflows. National programmes such as Vietnam’s hospital-wide digitisation of 32 million patient files reaffirm government support, ensuring sustained licensing income for platform vendors. Oracle’s USD 3.5 billion budget application for the Veterans Affairs rollout further demonstrates institutional commitment to enterprise-scale implementations. Continuous user-experience upgrades and HL7 FHIR compliance solidify switching costs. The smart healthcare products market size for EHRs is projected to expand steadily, albeit at a single-digit rate, as penetration in primary care settings plateaus in developed economies.
Smart Wearable Devices, forecast to record a 18.87% CAGR, are capturing unmet needs in ambulatory monitoring. FDA-cleared innovations such as cuffless blood-pressure monitors and wrist-based pulse detection broaden clinical acceptability. Start-ups leverage cloud connectivity and AI algorithms to offer subscription-based analytics, reducing reliance on hardware margins. Device makers embed over-the-air update pipelines that keep software current, extending product life and service revenue. The smart healthcare products market size for wearables is therefore positioned for outsized expansion relative to other device classes.
Parallel segments play supporting roles. Telemedicine Platforms integrate wearables into virtual-care visits, while Smart Pills gain traction in gastrointestinal diagnostics following FDA De Novo clearance for blood detection. Smart RFID Cabinets protect high-value consumables, cutting inventory shrinkage by up to 15% and improving compliance with chain-of-custody mandates. Investments in smart hospital infrastructure, such as Siemens’ deployment of 7,000 IoT sensors at Kantonsspital Baden, illustrate growing end-to-end integration across the smart healthcare products market.

By Application:
Remote Monitoring Leads Preventive Care RevolutionRemote Monitoring held 41.93% share in 2025, underpinned by proven reductions in readmissions and payer reimbursement structures that incentivise home-based care. The United States market alone is expected to double from USD 14-15 billion in 2024 to more than USD 29 billion by 2030. Providers integrate RPM dashboards within EHRs to trigger alerts, enhancing care-team efficiency. Commercial insurers now couple premium discounts with validated device utilisation, encouraging patient engagement. Consequently, the smart healthcare products market share associated with remote monitoring retains momentum throughout the forecast window.
Wellness & Preventive Care, advancing at a 17.43% CAGR, benefits from rising consumer interest in proactive health. AI-powered full-body MRI solutions illustrate how early detection reduces downstream treatment costs. Corporate wellness programmes reimburse employees for wearables that track sleep, stress, and activity, expanding addressable demand. Diagnostics segments apply machine-learning algorithms to imaging and laboratory data, cutting false positives and expediting treatment decisions. Treatment & Drug-Delivery applications incorporate smart pills with targeted release, improving adherence. Storage & Inventory Management leverages IoT cabinets to shorten restocking cycles and lower waste, reinforcing operational efficiencies across the smart healthcare products market.
By End User:
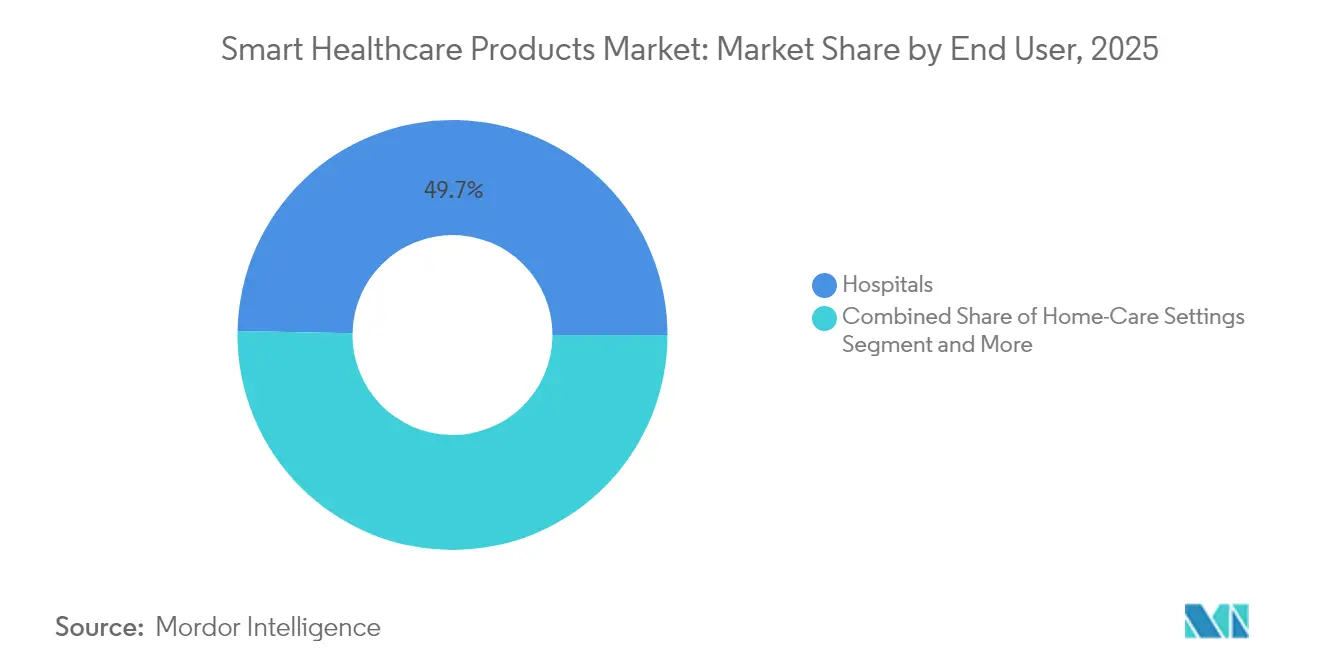
Hospitals Maintain Leadership as Home Care AcceleratesHospitals generated 49.71% of total revenue in 2025, leveraging established infrastructure and high patient throughput. Multi-year alliances such as GE HealthCare’s seven-year agreement with Sutter Health cover 300 facilities and integrate AI-based imaging across radiology workflows. Investments in predictive maintenance for imaging scanners and smart operating theatres provide incremental efficiency gains, retaining hospital dominance within the smart healthcare products market.
Home-Care Settings are forecast to grow at a 18.79% CAGR as shifting demographics and reimbursement flexibility favour decentralised care. Medicare policy now allows audio-only telehealth for specific chronic conditions, expanding access for digitally constrained populations. FDA-cleared consumer devices, including over-the-counter glucose monitors and nasal-congestion wearables, empower self-management and reduce clinic visits. Specialty Clinics deploy disease-specific dashboards that integrate imaging AI, while Ambulatory Surgical Centers attach disposable sensors to post-operative patients, lowering complications. Long-Term Care Facilities implement fall-detection beacons and smart mattresses, trimming adverse events. These deployments collectively reinforce revenue diversification across the smart healthcare products market.
Geography Analysis
North America Smart Healthcare Products Market
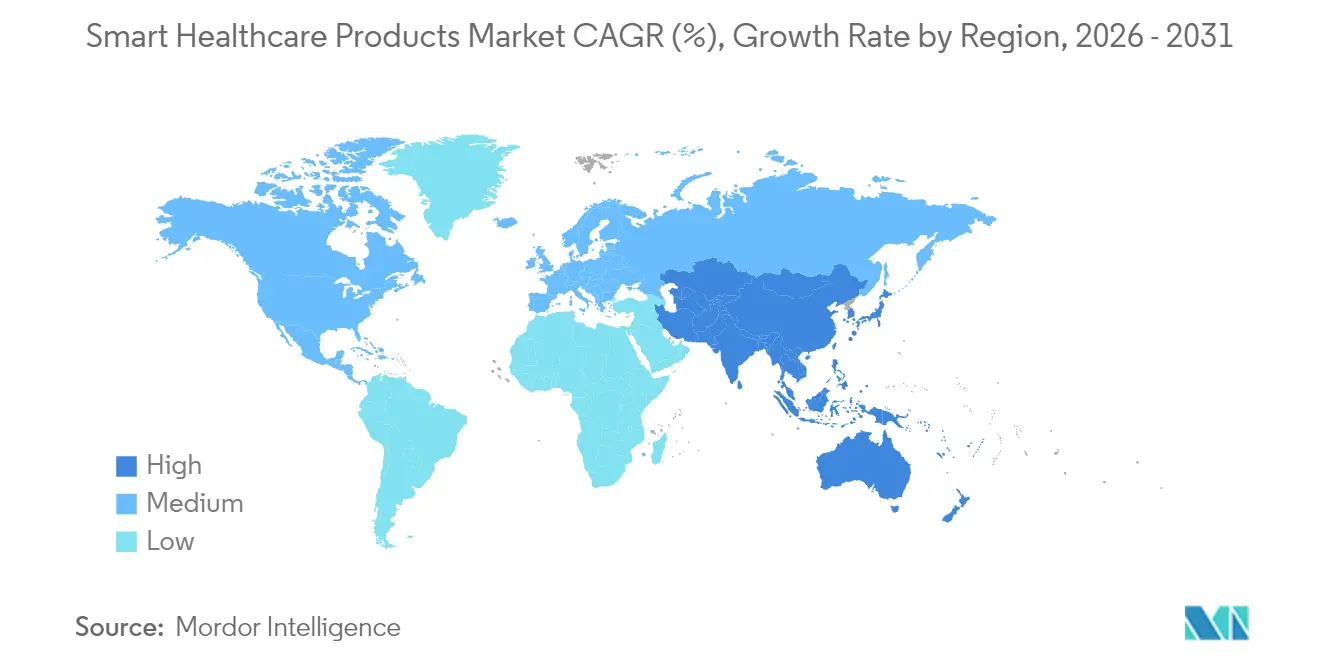
North America retained 37.47% revenue share in 2025, buoyed by sophisticated payer systems, advanced infrastructure, and sizeable venture capital flows. Federal initiatives such as the ARPA-H Women’s Health Sprint, which committed more than USD 100 million to digital health research, strengthen the innovation pipeline. Medicare’s extension of telehealth flexibilities through 2025 further entrenches remote monitoring usage and stabilises supplier demand. Canada complements the region’s dynamism by launching the Infoway Centre for Clinical Innovation to foster standards-based interoperability. Strong cybersecurity oversight in both countries ensures continued investment despite breach headlines.
APAC Smart Healthcare Products Market
Asia-Pacific delivers the fastest CAGR at 16.96% thanks to coordinated national strategies, expanding middle-class populations, and unmet clinical demand in rural areas. Singapore’s five-year USD 150 million GenAI plan fast-tracks imaging AI and automated record transcription across public hospitals. South Korea allocates USD 830 million for AI-enabled emergency systems, setting benchmarks for real-time patient transfer management. Southeast Asia’s digital health revenue is poised to reach USD 6.1 billion in 2024, with investors attracted to high smartphone penetration and supply-demand gaps. Australia’s Health Connect platform promotes seamless data sharing, accelerating provider onboarding.
EMEA and South America Smart Healthcare Products Market
Europe benefits from the European Health Data Space Regulation, effective March 2025, setting a single market for digital health services and supporting projects such as Xt-EHR and EUVAC. Unified rules reduce vendor fragmentation and encourage cross-border telemedicine. National health systems in Germany and France have rolled out e-prescription mandates, underlining commitment to digitalisation. In the Middle East and Africa, South Africa pilots national e-health strategies, while Gulf Cooperation Council states invest in smart hospital builds. South America shows momentum, particularly in Brazil where urbanisation and private insurance uptake fuel demand, although macroeconomic volatility moderates growth. Overall, geographic diversification balances expansion risks and underpins sustained growth across the smart healthcare products market.
Regulatory Landscape
Regulation for smart healthcare products is tightening around cybersecurity, interoperability, and lifecycle controls for AI-enabled software, raising the compliance bar for connected devices, EHR platforms, and AI-assisted diagnostics. In the United States, the FDA has emphasized governance for AI software used in medical devices, including its final guidance on Predetermined Change Control Plans (PCCP) for AI-enabled device software functions (finalized in December 2024), which supports pre-authorizing certain future model updates within a manufacturer’s marketing submission, an important mechanism for products delivered through frequent software releases.
In Europe, data exchange and AI governance are increasingly shaped by EU-wide rules that sit alongside existing medical-device conformity requirements. The European Health Data Space Regulation took effect in March 2025 in the report context, while EU AI Act implementation timelines introduce additional obligations for high-risk AI systems used in medical devices, with compliance deadlines extending into 2027-2028 depending on classification. Guidance such as MDCG 2025-6 clarifies the interplay between MDR/IVDR and the EU AI Act, reinforcing that device makers and software vendors must manage dual compliance rather than treating AI governance as a standalone pathway.
Competitive Landscape
The competitive arena is moderately concentrated, with the top three manufacturers—Philips Healthcare, Abbott, and Medtronic—controlling significant revenue, while a long tail of niche providers supplies specialised hardware and software modules. Industry rivalry centres on platform interoperability rather than outright hardware displacement, prompting alliances between medtech incumbents and cloud hyperscalers.
Strategic partnerships typify current strategy. Abbott linked its continuous glucose monitoring sensor to Medtronic insulin pumps, unlocking an estimated USD 700-850 million incremental market[3]. GE HealthCare collaborates with Amazon Web Services to co-develop generative-AI diagnostic tools, leveraging AWS’s machine-learning stack to analyse multi-modal data. Medtronic’s tie-up with Philips integrates pulse oximetry and capnography into Philips’ monitoring systems, expanding access for hospitals seeking a unified user interface.
Acquisition activity targets digital platforms and AI algorithms. Boston Scientific’s focus on interventional cardiology and Johnson & Johnson’s investment in robotic surgery illustrate buyers’ intent to control data-rich ecosystems. Venture capital funds channel resources into start-ups offering device-agnostic analytics, potentially positioning them as acquisition targets. Price competition remains contained due to regulation and high switching costs, while intellectual-property portfolios provide defensive moats. Continuous product improvements and recurring software upgrades sustain margin profiles and support future cash flow across the smart healthcare products market.
Smart Healthcare Products Industry Leaders
-
Abbott Laboratories
-
GE Healthcare
-
Koninklijke Philips N.V.
-
Medtronic plc
-
Siemens Healthineers AG
- *Disclaimer: Major Players sorted in no particular order
Smart Healthcare Products Market Companies Covered in this Report
- Abbott Laboratories
- Medtronic
- GE Healthcare
- Siemens Healthineers
- Koninklijke Philips
- Samsung Medison Co. Ltd.
- Mckesson
- Oracle
- NextGen Healthcare
- Olympus
- Capsule Technologies
- Omron Healthcare Co. Ltd.
- Teladoc Health
- Dexcom
- Apple
- Allscripts
- IBM Corporation (Watson Health)
- Cisco Systems
- Boston Scientific
- iRhythm Technologies
Market Opportunities and Future Outlook
Interoperability mandates and national-scale digital identity and exchange programs are creating visible whitespace for vendors that can connect remote monitoring, hospital systems, and payer workflows using standardized APIs and auditable data governance. In the United States, TEFCA passed the milestone of one billion health records exchanged (June 2026), while CMS proposed a 2026 rule aimed at expanding electronic prior authorization for drugs and updating health IT standards and reporting, increasing demand for integration tooling that links EHRs, telemedicine platforms, and medication workflows. In the United Kingdom, the Health Bill introduced in May 2026 to create a single patient record across NHS providers signals procurement pull for shared records infrastructure, identity, consent, and cybersecurity layers that support multi-organization care delivery.
At the product and platform level, opportunities concentrate around turning streaming device data into clinical-grade decisions and operational automation, especially for chronic disease pathways and imaging-intensive specialties. India’s Ayushman Bharat Digital Mission reporting over 93.95 crore (939.5 million) ABHA IDs (July 2026) expands the addressable base for app-linked monitoring, patient engagement, and longitudinal records in a way that favors scalable architectures and low-friction onboarding. On the enterprise side, large buyers are funding data modernization that pulls through software, devices, and services, for example Nicklaus Children’s Health System’s USD 75 million Epic EHR rollout and UnitedHealth Group’s 2026 AI investment program reported at USD 1.5 billion, both of which emphasize data readiness, automation, and measurable cycle-time improvements, areas where smart wearables, remote monitoring, and AI-assisted workflows integrate into larger platforms rather than remaining as pilots.
Recent Industry Developments in Smart Healthcare Products Market
- June 2026: GE HealthCare received U.S. FDA 510(k) clearance for MIM Contour ProtegeAI+ 2.0, expanding AI-enabled auto-contouring capabilities for radiation therapy planning. The clearance strengthens the company’s position in workflow automation for oncology, a domain where hospitals prioritize throughput and standardized planning quality across sites.
- July 2025: Medtronic announced a strategic partnership with Philips to integrate next-generation Nellcor pulse oximetry and Microstream capnography into Philips’ patient-monitoring systems. The collaboration aligns two large installed bases, supporting more unified monitoring configurations for hospitals seeking integrated respiratory insights within existing platform ecosystems.
- April 2024: Abbott received U.S. FDA approval for TriClip, a device designed to repair leaky tricuspid heart valves. The approval broadens Abbott’s portfolio of minimally invasive therapies and supports continued investment in connected procedure workflows where device data, imaging, and hospital IT increasingly converge.
Smart Healthcare Products Market Report Scope and Research Methodology
Market Definition and Coverage
For this study, the market covers connected and software enabled healthcare products that are used to capture, store, transmit, or act on health information in hospitals and home care settings, where the outcome is better monitoring, treatment support, or workflow efficiency.
Scope exclusions: Traditional non-connected medical devices, general consumer fitness gadgets without healthcare use, and pure healthcare staffing or consulting services are excluded.
Segments Covered in This Report
- By Product Type
- Telemedicine
- Electronic Health Records
- mHealth Solutions
- Smart Pills
- Smart Syringes
- Smart RFID Cabinets
- Smart Wearable Devices
- Smart Hospital Infrastructure
- By Application
- Storage & Inventory Management
- Remote Monitoring
- Diagnostics
- Treatment & Drug-Delivery
- Wellness & Preventive Care
- By End User
- Hospitals
- Home-Care Settings
- Specialty Clinics
- Ambulatory Surgical Centers
- Long-Term Care Facilities
- Geography
- North America
- United States
- Canada
- Mexico
- Europe
- Germany
- United Kingdom
- France
- Italy
- Spain
- Rest of Europe
- Asia-Pacific
- China
- Japan
- India
- South Korea
- Australia
- Rest of Asia-Pacific
- Middle East and Africa
- GCC
- South Africa
- Rest of Middle East and Africa
- Saudi Arabia
- South America
- Brazil
- Argentina
- Rest of South America
- North America
Data Sources, Market Sizing, and Validation
Desk Research
Desk research was used to set the fact base around demand drivers and the installed environment where smart products are adopted, and then to cross-check the direction of pricing and unit trends. We relied on public and official sources such as the World Health Organization, the World Bank, the US FDA device and safety communications pages, Centers for Medicare and Medicaid Services releases, and OECD health statistics, which help anchor spend, disease burden, and provider capacity.
We also reviewed company annual reports and investor presentations, hospital and health system publications, and reputable press coverage to understand product launches, reimbursement direction, and adoption patterns for remote monitoring and digital workflows. Where needed, we referenced paid subscriptions for company financials and intelligence, news and financials, and patent databases to validate innovation activity and revenue exposure. These are illustrative examples, and many other public sources were also used to collect and validate inputs, and to clarify edge cases during the work.
Primary Interviews and Surveys
Primary work focused on interviews and structured surveys with manufacturers, distributors, healthcare providers, and domain experts who track deployment of smart systems across care settings. We used these conversations to confirm adoption rates, typical pricing progression, replacement cycles, and the split between hospital led procurement and home care usage. We then used the same inputs to sanity check regional patterns across APAC, EMEA, and the Americas.
Distribution of primary research fieldwork respondents
| Company type | Respondent position | Region |
|---|---|---|
| Top tier: 38% | CXOs: 12% | APAC: 50% |
| Mid tier: 45% | Functional/Unit leaders: 42% | EMEA: 32% |
| Smaller Players: 17% | Managers: 46% | Americas: 18% |
Market-Sizing & Forecasting
Market sizing starts with a top-down build where healthcare IT and device spending, care delivery capacity, and digital adoption indicators are used to reconstruct the addressable demand pool by region, and then filtered to smart product categories. To keep the totals realistic, selective bottom-up approximations are added as cross-checks, using sampled average selling prices times estimated units for key product groups and channel checks on typical procurement volumes.
Key inputs we tracked include the prevalence of chronic diseases that drive monitoring needs, hospital digitization and EHR penetration, the share of care shifting to home settings, reimbursement momentum for remote monitoring programs, and the pace of connectivity adoption in devices and workflows. Where gaps showed up for smaller categories or country-level splits, the model used proxy indicators like healthcare spend per capita and provider density, and then adjustments were applied after interview feedback.
Forecasting was completed using scenario analysis supported by short trend models on the key drivers, followed by an analyst review of what changes are likely versus what is still experimental. Assumptions on adoption and pricing were kept easy to follow so the model can be rerun when new public statistics or updated expert inputs become available.
Data Validation & Update Cycle
Outputs are validated through multiple checks, including comparisons against independent signals like healthcare spending growth, device and digital health adoption benchmarks, and regional rollout patterns shared by experts. When a country or product line shows an unusual jump, the drivers are re-checked, and the team re-contacts sources if the variance cannot be explained with visible inputs.
Before sign-off, a second analyst reviews the model logic, the currency conversions, and the year mapping to confirm the totals reconcile across cuts. The report is refreshed annually, and interim updates are made when material events occur, such as policy changes, major product approvals, or a demand shock. Right before delivery, we do a fresh pass to ensure clients receive the latest updated view.
Mordor Intelligence's Smart Healthcare Products Market Size Versus Other Published Estimates
Published market values for smart healthcare products can look far apart, even when they seem to describe the same space, because the underlying scope and the measurement unit are not always aligned. In our work, we kept the steps traceable so readers can see which demand pool was counted and which adjacent items were kept out.
Some estimates blend broad smart healthcare that includes service revenue, implementation work, or wider hospital infrastructure budgets, which can lift the total quickly. Others use a different base year, apply aggressive adoption curves for telemedicine and mobile health, or convert currencies using a different timing, and then the market looks larger or smaller even before forecasting starts.
Benchmark comparison
| Source | Market Size | Gaps in Research Methodology |
|---|---|---|
| Mordor Intelligence | USD 223.98 B (2025) | |
| Global Publisher A | USD 200.20 B (2024) | Uses an earlier base year and a 2024 to 2030 window, and its definition can bundle broader smart healthcare items that are not always treated as product revenue in our model, which shifts the starting point and the run-rate. |
| Industry Research Group B | USD 162.46 B (2023) | Relies on a 2023 base and a longer horizon to 2032, and the product mapping can treat certain digital workflows and solutions differently across types, which changes what is counted as a smart healthcare product versus an enabling system. |
Telemedicine platform services and implementation work sit outside Mordor Intelligence's scope here, which helps explain why some published totals that blend product and service revenue land above the product-only view. After aligning the year, currency timing, and what counts as a product sale, the remaining spread is usually explained by how fast adoption and pricing are assumed to move in each region.
Key Questions Answered in the Report
What is the current value of the smart healthcare products market?
The market stands at USD 249.23 billion in 2026 and is projected to reach USD 425.18 billion by 2031 with an 11.27% CAGR.
Which product category holds the largest share?
Electronic Health Records lead with 28.11% revenue share in 2025 due to mandated digitisation programmes.
Why is Asia-Pacific witnessing the fastest growth?
Coordinated government funding, expanding healthcare infrastructure, and rising chronic-disease prevalence drive a 16.96% CAGR in the region.
How do cybersecurity regulations impact adoption?
Stricter HIPAA and GDPR rules raise compliance costs and lengthen development timelines, moderating near-term device rollouts.
What role do strategic partnerships play in market competition?
Alliances allow companies to integrate complementary technologies, accelerate product roadmaps, and enhance interoperability without major acquisitions.