
Smart Grid Data Analytics Market Size and Share
Market Overview
| Study Period | 2020 - 2031 |
|---|---|
| Market Size (2026) | USD 9.23 Billion |
| Market Size (2031) | USD 16.15 Billion |
| Growth Rate (2026 - 2031) | 11.85 % |
| Fastest Growing Market | Asia-Pacific |
| Largest Market | North America |
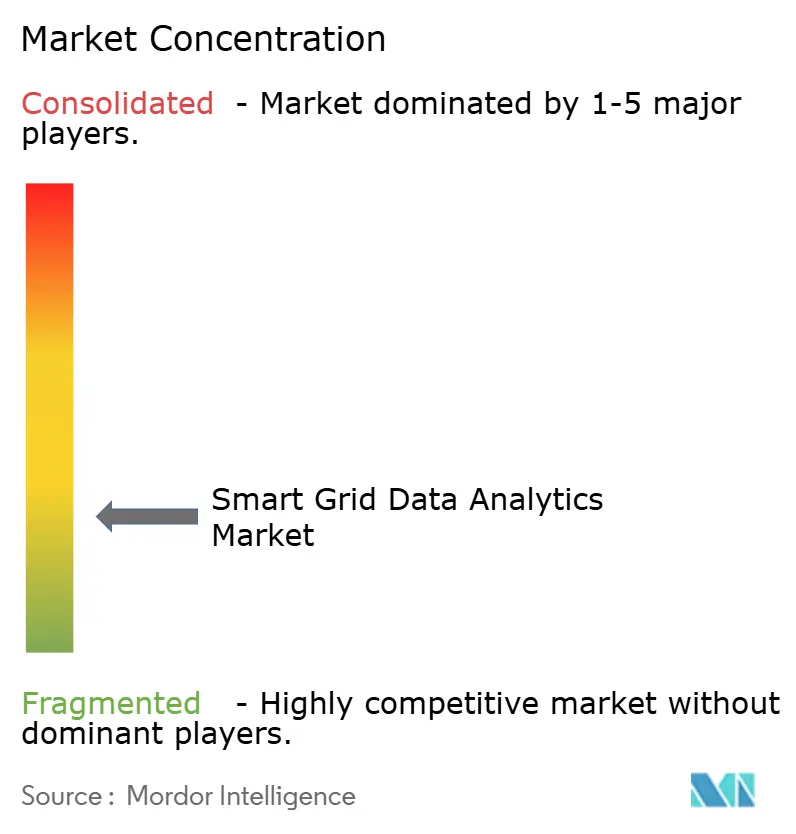
| Market Concentration | Low |
Major Players *Disclaimer: Major Players sorted in no particular order Image © Mordor Intelligence. Reuse requires attribution under CC BY 4.0. | |
Smart Grid Data Analytics Market Analysis by Mordor Intelligence
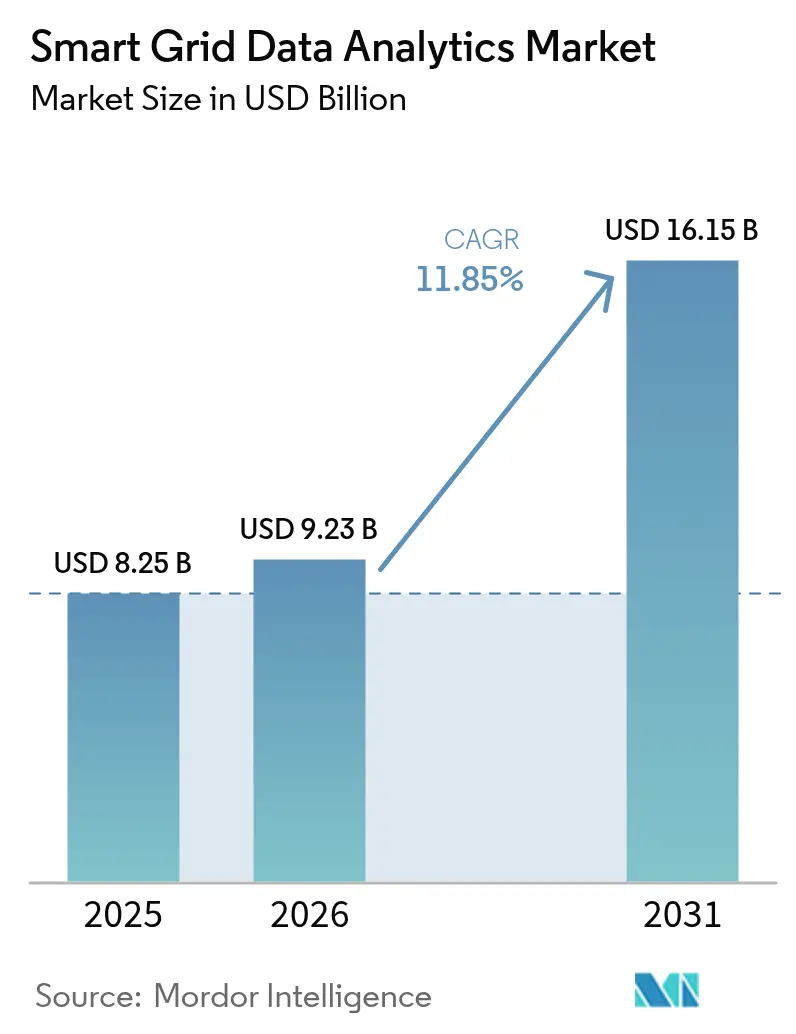
The Smart Grid Data Analytics Market size was valued at USD 8.25 billion in 2025 and estimated to grow from USD 9.23 billion in 2026 to reach USD 16.15 billion by 2031, at a CAGR of 11.85% during the forecast period (2026-2031). Growing volumes of advanced metering infrastructure (AMI) data, rapid deployment of distributed energy resources (DERs), and expanding electric-vehicle (EV) charging networks are pushing grid operators to adopt cloud-native analytics that can turn petabytes of raw information into timely, actionable insights. Artificial intelligence (AI) and machine-learning engines now underpin load forecasting, outage prediction, and DER orchestration, giving utilities the tools to shift from reactive to predictive grid management. Vendors that bridge legacy SCADA environments with modern cloud services are seeing stronger demand, especially in markets with stringent cybersecurity mandates such as NERC-CIP and IEC 62443. Simultaneously, mounting decarbonization targets are prompting regulators to require real-time carbon-intensity reporting, creating further pull for sophisticated analytics.
Key Report Takeaways
- By deployment, cloud-based platforms led with 60.75% of the smart grid data analytics market share in 2025, while on-premise solutions recorded a slower 6.92% CAGR to 2031.
- By solution, metering analytics accounted for 39.65% of revenue in 2025; asset and grid-edge analytics are poised to grow at a 13.35% CAGR through 2031.
- By application, advanced metering infrastructure analysis held a 40.85% share in 2025, whereas renewable and EV integration forecasting is set to expand at a 13.98% CAGR to 2031.
- By end-user, public utilities and municipalities contributed 44.55% revenue in 2025; large energy-intensive enterprises will see the fastest 13.62% CAGR by 2031.
- By geography, North America led with a 36.65% share in 2025, while Asia-Pacific is projected to deliver a 13.26% CAGR to 2031.
Note: Market size and forecast figures in this report are generated using Mordor Intelligence’s proprietary estimation framework, updated with the latest available data and insights as of 2026.
Market Trends and Insights
Drivers Impact Analysis of Smart Grid Data Analytics Market*
| Driver | (~) % Impact on CAGR Forecast | Geographic Relevance | Impact Timeline |
|---|---|---|---|
| Utility AMI roll-outs hitting critical mass | +2.1% | Global, with acceleration in APAC and Europe | Medium term (2-4 years) |
| Shift to cloud-native grid-edge analytics | +1.8% | North America and EU leading, APAC following | Short term (≤ 2 years) |
| Mandatory decarbonisation reporting by TSOs and DSOs | +1.5% | EU primary, expanding to North America and APAC | Long term (≥ 4 years) |
| Cyber-secure analytics for NERC-CIP and IEC 62443 compliance | +1.2% | North America and EU core, spillover to APAC | Medium term (2-4 years) |
| AI-optimised EV-to-Grid load balancing pilots | +1.4% | Global, with early gains in California, Germany, China | Long term (≥ 4 years) |
| Real-time DER orchestration requirements | +1.6% | Global, concentrated in high renewable-penetration regions | Medium term (2-4 years) |
| Source: Mordor Intelligence | |||
Utility AMI Roll-outs Hitting Critical Mass
Comprehensive AMI deployments now stream millions of time-stamped meter readings daily, giving utilities unprecedented visibility into low-voltage networks. Germany’s 98.2% success rate in remote power-limitation commands proved that next-generation meters support near-real-time grid interventions.[1] Utilities are therefore scaling analytics engines that ingest 150,000 data points per hour per feeder to predict overloads, preempt equipment failures, and refine tariff structures. A pilot across 20 substations and 184 feeders demonstrated that event-based analytics trimmed unscheduled maintenance by 28% and deferred USD 4 million in capex.
Shift to Cloud-Native Grid-Edge Analytics
Connecting smart meters to 5G backhaul cuts latency to single-digit milliseconds, enabling edge devices to filter noise and forward only high-value events to the cloud. Utilities avoid building costly data centers and instead subscribe to elastic processing power that runs AI models for topology optimization or volt-var control. Siemens already books over EUR 1.7 billion (USD 1.81 billion) in software-centric revenue by bundling its grid applications into a secure cloud layer.
Mandatory Decarbonization Reporting by TSOs and DSOs
New EU rules oblige system operators to publish the marginal carbon intensity of every dispatch decision. France’s RTE and Enedis co-developed a planning tool that re-routes power to circuits with lower embedded emissions, aligning with the continent-wide Energy Data Space vision. Such mandates stimulate demand for analytics that fuse operational, weather, and market data to calculate real-time carbon footprints.
AI-Optimized EV-to-Grid Load Balancing Pilots
Studies modeling 1.5-5 million EVs show peak-load reductions of up to 34.3% when AI schedules charging and dispatch. Malaysia’s pilot captured 30% energy savings by predicting charger occupancy and dynamically adjusting rates. Rocky Mountain Power’s 32,000-home VPP in Utah uses embedded analytics to shape a 600 MWh virtual battery, illustrating how bidirectional flows create new ancillary-service revenue streams.
Restraints Impact Analysis of Smart Grid Data Analytics Market*
| Restraint | (~) % Impact on CAGR Forecast | Geographic Relevance | Impact Timeline |
|---|---|---|---|
| Legacy SCADA/MDMS interoperability gaps | -1.3% | Global, particularly acute in aging North American and European grids | Short term (≤ 2 years) |
| Rising analytics-traffic backhaul costs in rural feeders | -0.8% | Rural regions globally, most severe in developing markets | Medium term (2-4 years) |
| Data-ownership disputes between DSOs and customer apps | -0.6% | EU and North America primarily, expanding to APAC | Long term (≥ 4 years) |
| Shortage of advanced analytics talent at utilities | -0.9% | Global, with acute shortages in APAC and emerging markets | Medium term (2-4 years) |
| Source: Mordor Intelligence | |||
Legacy SCADA/MDMS Interoperability Gaps
Utilities often operate devices from dozens of vendors, each using proprietary protocols. Bench tests on digital substations uncovered handshake issues that forced operators to purchase middleware gateways, inflating integration budgets by 17%. The need for rigorous cyber-physical validation extends project timelines as utilities test edge-to-cloud data paths for deterministic performance.
Rising Analytics-Traffic Backhaul Costs in Rural Feeders
Low-density networks may sit 80 km from fiber, making utilities depend on microwave links powered by off-grid solar. Research shows that diffractive non-line-of-sight backhaul reduces capex up to 45% yet requires sophisticated 3D mapping utilities rarely possessed. High transmission costs force rural cooperatives to limit data granularity, curbing analytics benefits and slowing overall market adoption.
*Our forecasts treat driver/restraint impacts as directional, not additive. The impact forecasts reflect baseline growth, mix effects, and variable interactions.
Smart Grid Data Analytics Market Segment Analysis
By Deployment:
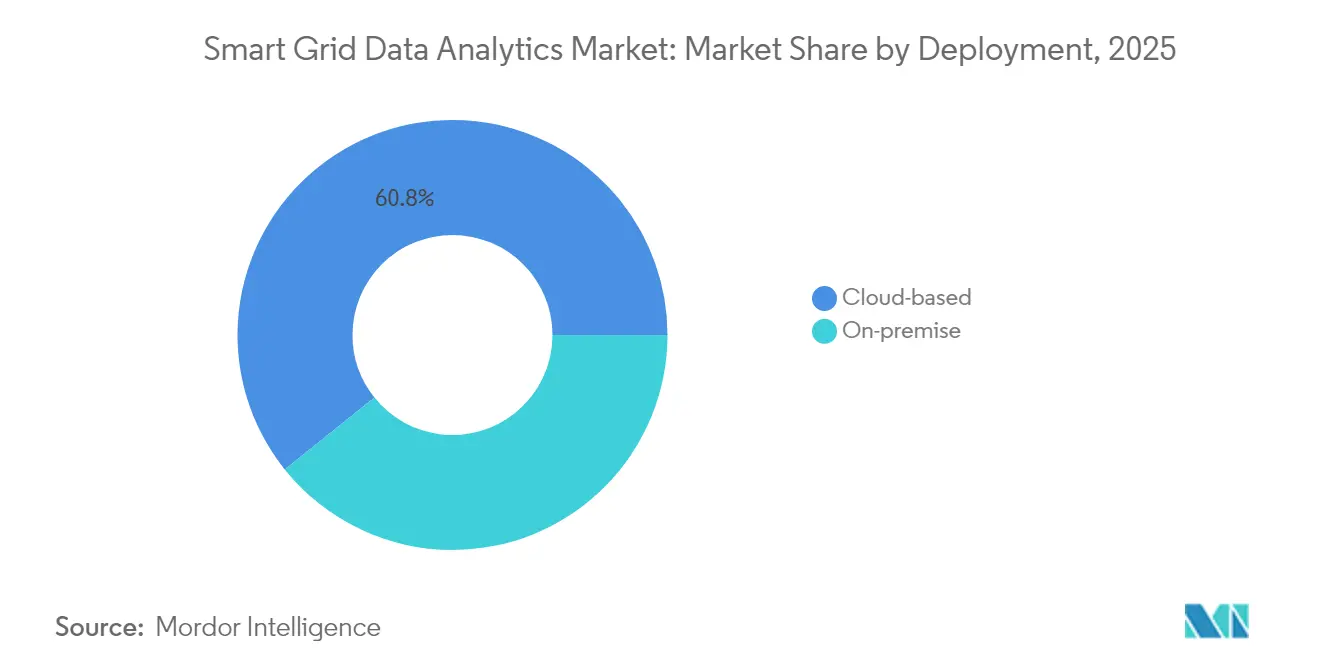
Cloud Dominance AcceleratesCloud deployments captured 60.75% of the smart grid data analytics market in 2025 and are forecast to grow at 12.74% CAGR to 2031. Utilities value the ability to spin up advanced AI workloads without capital outlays, while hyperscale providers guarantee multilayer cybersecurity and continuous software upgrades. In contrast, on-premise deployments persist where regulators mandate data residency or where latency-sensitive feeder automation requires local compute. As Siemens’ grid-software revenue already surpasses USD 1.81 billion, investment is shifting toward “analytics-as-a-service” subscriptions that monetize continuous insights rather than one-time licenses.
Growing adoption of virtual power plants (VPPs) illustrates why the cloud model scales better. The U.S. Department of Energy targets 80-160 GW of aggregated VPP capacity by 2030, and nearly every platform relies on distributed cloud microservices to run stochastic optimization across millions of devices. As those requirements intensify, the smart grid data analytics market size for cloud deployment is projected to capture USD 10.35 billion by 2031, more than tripling the on-premise total.

By Solution:
Metering Analytics Leads Asset IntelligenceMetering analytics represented 39.65% revenue in 2025, reflecting utilities’ historic focus on billing accuracy, theft detection, and time-of-use tariff design. Yet, asset and grid-edge analytics is the fastest climber at 13.35% CAGR as operators prioritize condition-based maintenance for transformers, reclosers, and power electronics. IBM’s survey shows 70% of digitally mature utilities already use AI to schedule maintenance windows, cutting forced outages by 23%.
The convergence of edge computing and AI is key: sensors now embed lightweight neural networks that flag anomalies locally, forwarding only high-risk events to the cloud. This tiered architecture lowers bandwidth bills while enabling sub-second fault isolation. Consequently, the smart grid data analytics market size for asset intelligence is forecast to reach USD 4.75 billion by 2031, representing 29.40% of total spending and reflecting the shift toward proactive grid stewardship.
By Application:
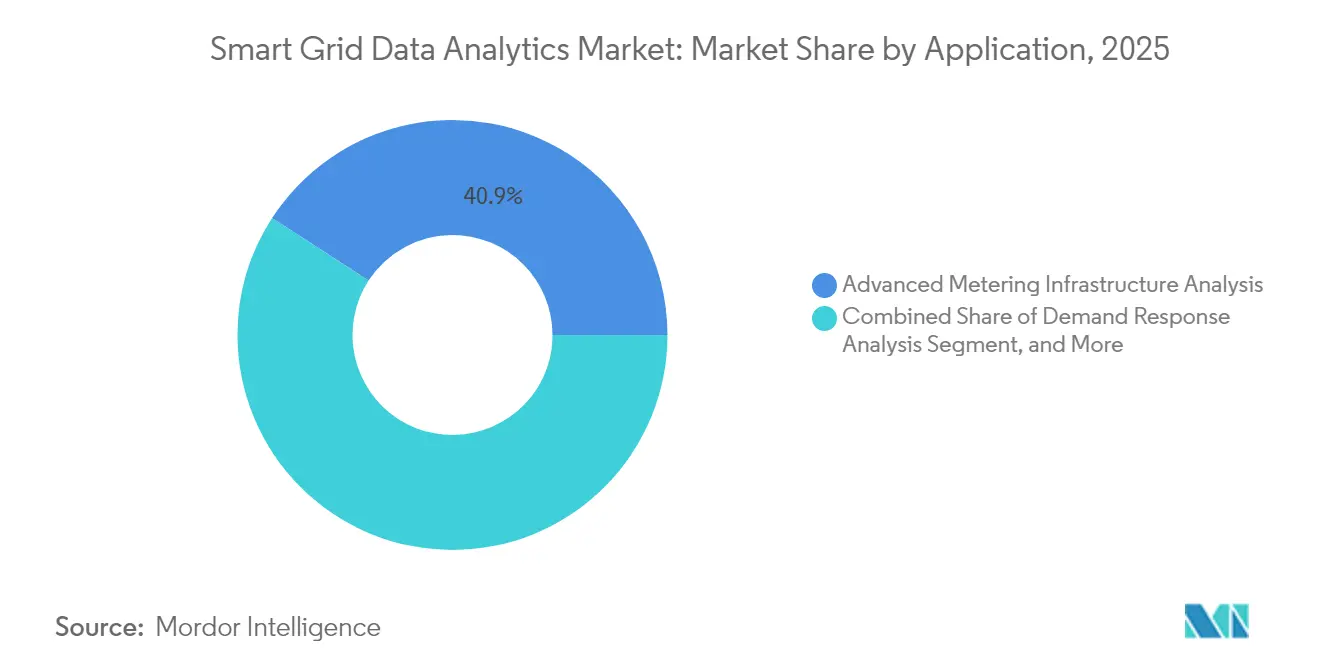
Renewable Integration Drives GrowthAdvanced metering infrastructure analysis still dominates with 40.85% revenue, but utilities urgently need analytics that orchestrate solar, wind, and EV fleets. Renewable and EV integration forecasting, therefore, posts the highest 13.98% CAGR through 2031. Deep-learning models now assimilate real-time weather, locational marginal prices, and feeder-level load to recommend charge-discharge schedules that flatten peaks. EnergyShare AI demonstrated peer-to-peer algorithms that improved self-consumption by 19% in pilot microgrids.
As DER penetration climbs, transmission operators demand high-resolution inertia forecasts and fast-frequency-response analytics. Vendors responding with specialized libraries for phasor measurement unit (PMU) streams are winning multi-year framework contracts. Consequently, the smart grid data analytics market share for renewable integration software is expected to surpass 18.65% by 2031, up from 11.40% in 2025, underscoring its centrality to a decarbonized grid mix.
By End-user Vertical:
Industrial Enterprises Accelerate AdoptionPublic utilities and municipalities commanded 44.55% spending in 2025, yet large energy-intensive enterprises are forecast to lead growth at 13.62% CAGR. These firms-ranging from data centers to steel mills-deploy behind-the-meter analytics that synchronize production schedules with solar output or spot-price dips, shaving energy bills and earning flexibility payments. Schneider Electric’s USD 700 million U.S. investment prioritizes industrial microgrids equipped with AI dispatch engines that can island or grid-connect on demand.
Industrial adoption also responds to Scope 2 emission pledges; corporates seek verifiable proof of renewable sourcing, which granular analytics can supply. Hence, the smart grid data analytics market size allocated to industrial users is projected to hit USD 3.55 billion by 2031, nearly doubling the segment’s 2025 baseline.
Geography Analysis
North America Smart Grid Data Analytics Market
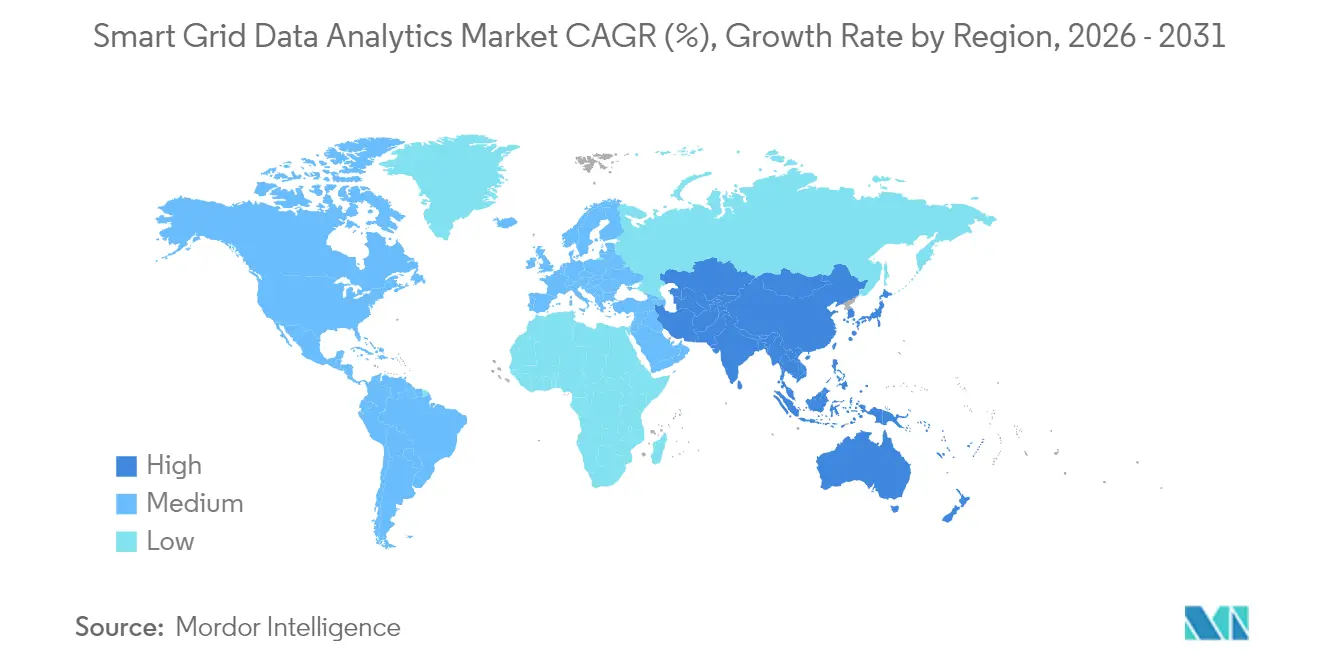
North America generated the largest revenue, holding 36.65% of the smart grid data analytics market in 2025, due to mature AMI roll-outs, wholesale market reforms, and federal investment tax credits that reward DER orchestration. Utilities here increasingly bundle analytics subscriptions into rate-based filings, ensuring stable cost recovery. Canada’s new AI R&D hub for battery manufacturing further strengthens the regional ecosystem, positioning local vendors near key EV-supply-chain customers.
APAC Smart Grid Data Analytics Market
Asia-Pacific is the fastest mover with a projected 13.26% CAGR to 2031. China’s State Grid Corporation embeds analytics in every phase of its ultra-high-voltage projects, while India’s Revamped Distribution Sector Scheme allocates USD 40 billion to digitalize feeders. Malaysia’s AI-based charging pilots illustrate how emerging economies leapfrog legacy infrastructure to adopt cloud-native solutions. Consequently, the region’s contribution to the smart grid data analytics market size will nearly double by 2031, surpassing USD 4.45 billion.
Europe Smart Grid Data Analytics Market
Europe benefits from stringent decarbonization rules and data-space initiatives that mandate interoperability. Germany’s 98.2% command-success benchmark validates continent-wide technical maturity. Southern Europe’s emphasis on open energy data is pushing distribution companies to adopt standardized analytics that expose real-time metrics to third-party service providers.
MEA and South America Smart Grid Data Analytics Market
South America and the Middle East, and Africa collectively represent under 10% of revenue today, but rising electrification and renewable targets are catalyzing pilot deployments. Utilities in Chile and the United Arab Emirates now integrate PMU-based analytics to stabilize high solar penetration, signaling fertile ground for vendor expansion once telecom backhaul improves.
Regulatory Landscape
Regulation for smart grid data analytics is increasingly tied to interoperability and cybersecurity standards that shape how metering, grid-edge, and market data can be exchanged and protected. In the United States, FERC Order No. 676-K incorporates NAESB WEQ Version 004 standards by reference for public utilities, reinforcing shared communication and cybersecurity practices that affect how analytics platforms connect with utility and ISO/RTO data flows.
In Europe, interoperability and data access requirements are tightening through a layered framework spanning the Data Act, Data Governance Act, NIS2, and the EU Cybersecurity Act, alongside energy-market rules that promote standardized access to electricity data. Implementing Regulation (EU) 2026/855 sets mandatory interoperability requirements and procedures for electricity market data access to facilitate switching and standardized processes, increasing compliance obligations for vendors offering cloud analytics, customer portals, and data-exchange interfaces. Cross-border alignment is further influenced by standardization workstreams referenced in the EU Rolling Plan for ICT Standardisation for smart grids and smart metering, with NIST SP 1108r4 continuing to serve as an interoperability roadmap used by utilities and suppliers globally.
Value Chain Analysis
The value chain covers grid data generation, communications, data management, advanced analytics, and operational execution. Upstream, data comes from AMI and grid-edge sensors, substations, and DER/EV infrastructure, as well as enterprise systems, and is carried over RF mesh, cellular/5G, and fiber backhaul into MDMS, CIS, GIS, SCADA/ADMS, and cloud data platforms. Midstream integration is increasingly built through partnerships that connect grid-edge OEM telemetry with hyperscaler data clouds and AI tooling. For instance, Itron has collaborated with Snowflake on an AI-powered data cloud for grid planning (January 2026), and it has also worked with Schneider Electric and Microsoft to connect grid-edge intelligence to distribution operations and cloud analytics.
Downstream, utilities and large enterprises use analytics for load forecasting, outage and wildfire risk detection, asset performance, and DER orchestration, then apply results through ADMS/DMS actions, field work management, and customer programs. Specialized analytics and digital-twin developers also sit mid-to-downstream, as Corinex and Plexigrid announced cooperation to combine real-time field data with digital-twin analytics for LV/MV visibility (July 2026), and Fingrid selected Digia under a EUR 2.1 million contract to develop and maintain a data platform while expanding AI capabilities (June 2026). Supply constraints in grid hardware, including long lead times for equipment such as large power transformers, remain a dependency that can slow sensor additions and network modernization.
Competitive Landscape
The smart grid data analytics market remains moderately fragmented. Legacy operational-technology suppliers-Siemens, Schneider Electric, GE Vernova, and Hitachi-bundle hardware, communications, and analytics, capitalizing on decades-long utility relationships. Cloud-native players such as AutoGrid and BluWave-ai differentiate on AI-first architectures that ingest unstructured data sets and deliver sub-minute forecasting.
Strategic alliances are growing. GE Vernova and Itron link grid-edge telemetry with a common data fabric, creating a turnkey analytics stack that tackles data-ownership conflicts and accelerates deployment schedules.[4] Siemens partners with hyperscalers to embed its GridOS suite into secure multi-tenant clouds, enabling pay-as-you-grow models ideal for mid-size municipal utilities.
Investment flows favor AI and edge computing. Honeywell’s 5G-enabled smart meters stream event-driven data, while IBM’s quantum-safe encryption pilots address looming cybersecurity mandates. Start-ups focusing on federated learning and privacy-enhancing computation are drawing venture capital as regulators press for customer-centric data governance. Collectively, the top five vendors accounted for roughly 36% revenue in 2024, indicating scope for consolidation as utilities standardize on interoperable platforms.
Smart Grid Data Analytics Industry Leaders
-
Siemens AG
-
Itron Inc.
-
Landis + Gyr Group AG
-
Oracle Corporation
-
SAS Institute Inc.
- *Disclaimer: Major Players sorted in no particular order
Smart Grid Data Analytics Market Companies Covered in this Report
- Siemens AG
- Itron Inc.
- Landis + Gyr Group AG
- Oracle Corporation
- SAS Institute Inc.
- Schneider Electric SE
- GE Vernova
- IBM Corporation
- Hitachi Energy Ltd.
- AutoGrid Systems Inc.
- Uplight Inc.
- Uptake Technologies Inc.
- Tantalus Systems Corp.
- Amdocs Ltd.
- Sensus USA Inc. (Xylem)
- Honeywell Smart Energy
- Networked Energy Services
- Grid4C Inc.
- Atonix Digital LLC
- Gridspertise S.r.l.
- Tollgrade Communications Inc.
- C3.ai Inc.
- Opower (Oracle Corporation)
- Accenture plc
- Enlit AI Ltd.
Market Opportunities and Future Outlook
A key opportunity is compliance-driven interoperability and standardized data access that turns fragmented utility data into reusable products for grid operations and customer-facing services. The EU is moving in this direction through Implementing Regulation (EU) 2026/855, which mandates interoperability requirements and procedures for electricity market data access, supporting demand for platforms that can operationalize consent, data exchange, and auditable cybersecurity controls across metering, switching, and market interfaces. The European Commission also published a strategic roadmap for digitalisation and AI in the energy sector (June 2026), creating a clearer policy anchor for utilities and vendors to industrialize AI-enabled grid solutions beyond pilots.
Utilities are also scaling grid-edge and production-grade AI with measurable operational impact, which creates room for vendors that can unify AMI, grid-edge, and operational datasets into a single decision layer. Con Edison deployed the C3 AI platform to monitor 5.3 million smart meters and reported USD 854 million in annual customer benefits (May 2026), illustrating demand for analytics that reduce incidents and optimize operations at scale. New use cases are also expanding beyond billing and load forecasting into resilience and vegetation-risk detection, including Sense partnering with Southern Company to use residential smart meters for vegetation-encroachment detection (June 2026), and into real-time visibility and demand management via grid-edge sensor deployments such as Landis+Gyr signing with Benton Rural Electric Association to deploy Revelo sensors (July 2026). These deployments broaden the addressable scope for event-driven analytics, edge-to-cloud orchestration, and utility-grade governance, particularly where cybersecurity baselines such as NERC-CIP and IEC 62443-aligned practices are treated as procurement prerequisites.
Recent Industry Developments in Smart Grid Data Analytics Market
- June 2026: Sense and Southern Company announced a joint initiative to use residential smart meters for vegetation-encroachment detection, expanding analytics applications for grid resilience. The collaboration aims to integrate meter-level insights into existing outage and risk analytics platforms, strengthening the grid's ability to detect vegetation risks in real time.
- March 2025: Schneider Electric committed USD 700 million to US grid modernization and AI initiatives, including domestic manufacturing expansion and job creation. The investment supports a larger installed base of digitized grid assets and industrial microgrids, which expands the data footprint that analytics platforms can monetize through monitoring, optimization, and reporting services.
- December 2024: GE Vernova and Itron partnered to integrate Grid-Edge Intelligence with the GridOS Data Fabric to improve access to, and use of, grid-edge telemetry. The combination addresses common utility bottlenecks around data silos and ownership by providing a more unified data layer that can feed outage prediction, asset analytics, and DER orchestration applications.
Smart Grid Data Analytics Market Report Scope and Research Methodology
Market Definition and Coverage
For this methodology, the smart grid analytics market covers revenues earned from software and related analytics services that turn electric grid data into operational, planning, and customer insights for utilities and grid operators.
Scope exclusions: It does not count grid hardware, meters, sensors, communications gear, or general IT consulting unless the revenue is packaged and sold as an analytics offering.
Segments Covered in This Report
- By Deployment
- Cloud-based
- On-premise
- By Solution
- Transmission and Distribution Network
- Metering Analytics
- Customer Analytics
- Asset and Grid-Edge Analytics
- By Application
- Advanced Metering Infrastructure Analysis
- Demand Response Analysis
- Grid Optimisation and Predictive Maintenance
- Renewable and EV Integration Forecasting
- By End-user Vertical
- Public Utilities and Municipalities
- Investor-Owned Utilities (IOUs)
- Cooperative and Community Utilities
- Large Energy-Intensive Enterprises
- By Geography
- North America
- United States
- Canada
- Mexico
- South America
- Brazil
- Argentina
- Chile
- Rest of South America
- Europe
- Germany
- United Kingdom
- France
- Italy
- Spain
- Russia
- Rest of Europe
- Asia-Pacific
- China
- India
- Japan
- South Korea
- Singapore
- Malaysia
- Australia
- Rest of Asia-Pacific
- Middle East and Africa
- Middle East
- United Arab Emirates
- Saudi Arabia
- Turkey
- Rest of Middle East
- Africa
- South Africa
- Nigeria
- Rest of Africa
- Middle East
- North America
Data Sources, Market Sizing, and Validation
Desk Research
Desk work starts by collecting dependable public signals on grid digitalization and data generation, because analytics demand follows where smart meters, automation, and distributed resources are being added. We typically refer to sources such as the US Energy Information Administration for electricity statistics, the US Department of Energy for grid program updates, the International Energy Agency for global power system indicators, and the International Renewable Energy Agency for renewable integration context.
To sharpen assumptions, we also review utility regulator filings and rate case documents, along with company annual reports and investor presentations. For methodology support, we look at standards and working papers from bodies such as IEEE, and peer-reviewed articles that quantify outage patterns and load forecasting improvements. When needed, we use paid subscriptions for company financials and intelligence, plus a patent database, to cross-check business mix and product direction. These desk sources are illustrative, and many other public references are used for data collection, validation, and clarification.
Primary Interviews and Surveys
Primary work is used to confirm what portion of analytics spend is tied to grid operations versus adjacent IT budgets, and how pricing behaves across cloud and on-premise deployments. We speak with utilities, grid operators, system integrators, and analytics solution teams across major regions so the model inputs reflect real procurement cycles, adoption barriers, and the typical structure of analytics contracts.
Distribution of primary research fieldwork respondents
| Company type | Respondent position | Region |
|---|---|---|
| Top tier: 27% | CXOs: 12% | APAC: 47% |
| Mid tier: 56% | Functional/Unit leaders: 40% | EMEA: 29% |
| Smaller Players: 17% | Managers: 48% | Americas: 24% |
Market-Sizing & Forecasting
Sizing is built using a top-down and bottom-up approach. The top-down side reconstructs the addressable demand pool using smart meter and AMI penetration, the pace of grid automation upgrades, growth in distributed energy resources and EV charging connections, and utility digital spend priorities that are visible through public filings and programs.
Those demand signals are then translated into value using practical inputs such as typical analytics contract lengths, deployment mix shifts between cloud and on-premise, and observed pricing changes as datasets expand and model complexity rises. Bottom-up checks are added selectively through sampled supplier revenue splits, channel feedback on deal sizes, and ASP times volume approximations for key applications like outage and reliability analytics, load forecasting, and demand response analytics. When a bottom-up view is incomplete for smaller regions or niche applications, we close the gap using penetration assumptions that are validated with interviews and then adjusted to keep totals consistent.
Forecasting relies mainly on scenario analysis, because policy timelines, grid resilience funding, and cloud migration speed can swing adoption rates. The scenarios are anchored to expert consensus on variables such as planned smart meter rollouts, interconnection volumes for renewables, and utility capex and opex allocation for digital operations.
Data Validation & Update Cycle
Model outputs are checked against independent signals like utility AMI rollout progress, reported grid modernization budgets, and published reliability and outage improvement targets so the numbers do not drift away from real deployment activity. We also run variance checks by region and by application, so unusually high growth rates or abrupt share shifts are flagged and reviewed before sign-off.
Before finalizing, assumptions that drive the largest value changes, such as pricing progression and cloud mix, are reviewed by a second analyst and rechecked with select respondents when a mismatch appears. Reports are refreshed annually, and interim updates are triggered when material events occur, such as major regulatory funding changes or rapid shifts in utility procurement patterns. Right before delivery, a fresh review pass is completed so clients receive the latest updated view.
Mordor Intelligence's Smart Grid Analytics Market Size Versus Other Published Estimates
Published market numbers for smart grid analytics often vary because the scope is not standardized, and because firms apply different treatments for services, deployment models, and currency timing. Differences also come from how each model ties analytics revenue to real grid activity, since AMI, DER, and outage management programs do not move in a straight line every year.
The main gap comes from whether services like implementation, integration, and ongoing support are counted alongside analytics software. Here, Mordor Intelligence includes only revenues sold as smart grid analytics solutions rather than broad grid IT services.
Benchmark comparison
| Source | Market Size | Gaps in Research Methodology |
|---|---|---|
| Mordor Intelligence | USD 9.23 B (2026) | |
| Trade Journal A | USD 7.90 B (2024) | Uses an earlier base year and a shorter forecast window, and it may blend adjacent smart grid services categories, which can shift what is counted as analytics revenue. |
| Industry Publisher B | USD 8.10 B (2024) | Often stated as a broad smart grid analytics total with limited visibility into deployment mix and pricing logic, which can lead to different ASP assumptions and currency conversion timing. |
Across the three figures, most of the spread can be traced back to scope choices around services and to base-year timing, not to a fundamentally different view of where analytics is used on the grid. By tying the total to AMI and grid digitalization indicators, and then checking it with sampled deal sizing and supplier mix, the estimate stays traceable to inputs that can be rechecked and updated as programs and budgets change.
Key Questions Answered in the Report
What is driving the rapid growth of the smart grid data analytics market?
Utilities worldwide are scaling AMI roll-outs, integrating DERs and meeting decarbonization mandates, which together push annual spending to a projected USD 16.15 billion by 2031.
Which deployment model is gaining the most traction?
Cloud-based analytics dominate, holding 60.75% share in 2025 and expanding at a 12.74% CAGR as operators favor scalable, pay-as-you-go platforms.
Why are industrial enterprises adopting smart grid analytics?
Large energy-intensive facilities can cut energy costs, monetize flexibility and verify Scope 2 emissions, driving a 13.62% CAGR in industrial demand through 2031.
How do analytics support renewable and EV integration?
AI models forecast generation and load, orchestrate bidirectional power flows and aggregate distributed assets into virtual power plants to maintain grid stability.
What are the key challenges hindering adoption?
Legacy SCADA interoperability, rural backhaul expenses and shortages of analytics talent collectively shave 2% off the forecast CAGR.
Which regions offer the highest growth potential?
Asia-Pacific leads with a 13.26% CAGR through 2031 as China and India fund large-scale smart grid initiatives and accelerate EV infrastructure roll-outs.