
Smart Display Market Size and Share
Market Overview
| Study Period | 2020 - 2031 |
|---|---|
| Market Size (2026) | USD 5.49 Billion |
| Market Size (2031) | USD 11.82 Billion |
| Growth Rate (2026 - 2031) | 16.58% CAGR |
| Fastest Growing Market | Asia Pacific |
| Largest Market | Asia Pacific |
| Market Concentration | Medium |
Major Players
*Disclaimer: Major Players sorted in no particular order Image © Mordor Intelligence. Reuse requires attribution under CC BY 4.0. |
|
Smart Display Market Analysis by Mordor Intelligence
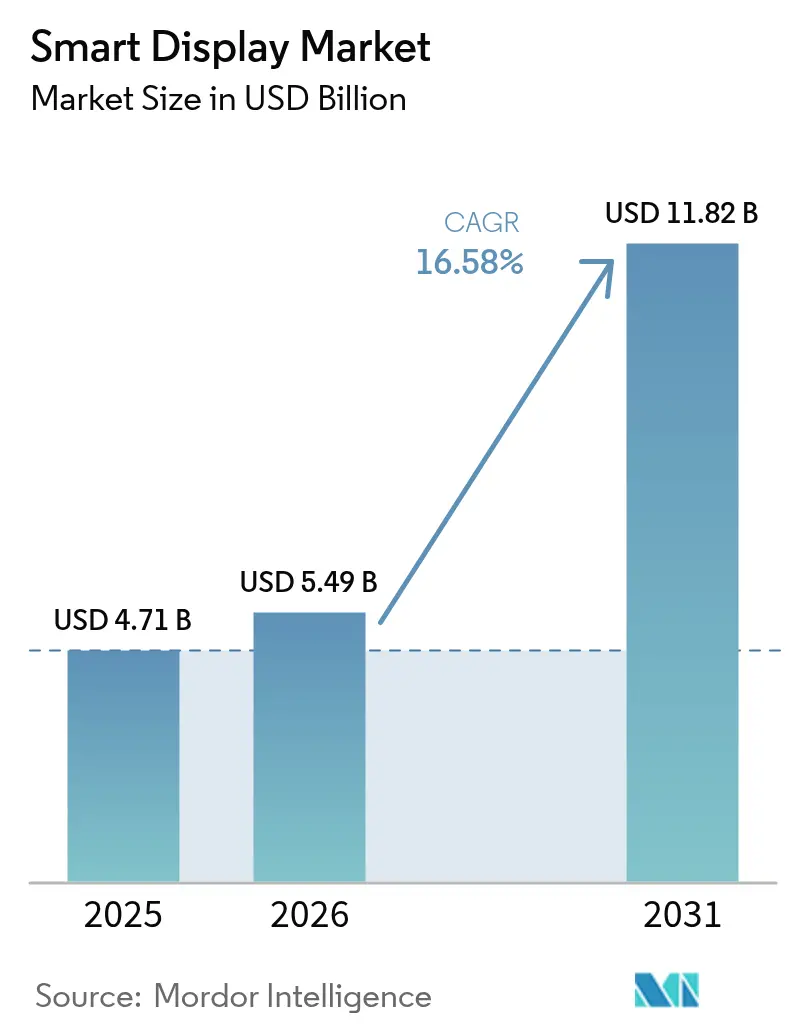
Smart display market size in 2026 is estimated at USD 5.49 billion, growing from 2025 value of USD 4.71 billion with 2031 projections showing USD 11.82 billion, growing at 16.58% CAGR over 2026-2031. The upgrade cycle from voice-only screens to AI-driven multimodal hubs is widening average selling prices while enlarging the installed base. Matter protocol adoption is dismantling platform lock-in, shifting competition toward hardware innovation rather than ecosystem exclusivity.[1]Qorvo, “Simplifying Smart Homes: Learn How Matter, Thread and Wi-Fi Are Revolutionizing IoT Connectivity,” qorvo.com Automotive cockpits, OLED diffusion, and AI-enhanced above 10-inch models are intensifying revenue upside. Vertically integrated panel makers have preserved margins despite 8-10-inch LCD shortages.[2]TCL CSOT, “TCL CSOT Unveils Advanced Smart Cockpit Display Solutions,” en.tclcsot.com Conversely, enterprise buyers have prolonged procurement cycles because of always-on-microphone risks, tempering short-term shipment momentum.
Key Report Takeaways
- By voice assistant, Amazon Alexa led with 33.12% revenue share in 2025, while Alibaba TmallGenie is projected to advance at an 18.38% CAGR through 2031.
- By screen size, the 5–10 inch category commanded 52.10% share of the smart display market size in 2025; >10 inch screens are forecast to expand at a 18.92% CAGR to 2031.
- By display technology, LCD held 81.05% of the smart display market share in 2025, whereas OLED is set to grow at a 21.35% CAGR through 2031.
- By resolution, Full HD screens accounted for 56.05% share in 2025, while 4K and above panels are expected to climb at a 22.98% CAGR.
- By installation type, stand-alone units dominated with 90.10% share in 2025; integrated formats such as smart mirrors will rise at a 25.74% CAGR.
- By connectivity, Wi-Fi-only devices represented 86.95% of 2025 shipments, whereas Wi-Fi + Matter models show the fastest 22.41% CAGR outlook.
- By end-user industry, residential smart-home applications led with 73.95% revenue share in 2025, while automotive dashboards are poised to grow at a 23.62% CAGR.
- By geography, Asia-Pacific contributed 37.42% of global sales in 2025 and is projected to post the highest 17.05% CAGR through 2031.
Note: Market size and forecast figures in this report are generated using Mordor Intelligence’s proprietary estimation framework, updated with the latest available data and insights as of 2026.
Global Smart Display Market Trends and Insights
Drivers Impact Analysis*
| Driver | (~) % Impact on CAGR Forecast | Geographic Relevance | Impact Timeline |
|---|---|---|---|
| Rising adoption of multimodal voice-first smart-home hubs | +3.5% | North America with spillover to Europe | Medium term (2-4 years) |
| Proliferation of Matter-compliant devices accelerating platform interoperability | +1.9% | Global, early uptake in North America and Europe | Medium term (2-4 years) |
| Automotive OEM integration of smart mirrors and pillar-to-pillar cockpit displays | +2.1% | Europe and East Asia leadership | Long term (≥ 4 years) |
| AI-powered contextual UI driving premium price mix in >10-inch category, Asia-led | +3.2% | Asia-Pacific with spillover to North America | Medium term (2-4 years) |
| Retail demand for frictionless checkout and dynamic shelf-edge signage | +1.8% | North America and Europe, emerging adoption in Asia-Pacific | Medium term (2-4 years) |
| Hospital bedside smart terminals improving patient engagement and HCAHPS scores | +1.0% | North America with growing adoption in Europe | Medium term (2-4 years) |
| Source: Mordor Intelligence | |||
Rising adoption of multimodal voice-first smart-home hubs in North America
Smart displays are evolving into visual-voice hybrids that orchestrate lighting, security, and entertainment systems from a single interface. Voice-assistant penetration is expected to reach 157.1 million U.S. users by 2026, underpinning device upgrades that handle richer commands and provide contextual visuals.[3]Samsung Electronics, “Samsung Electronics Introduces Its Most Advanced TVs and Soundbars Yet Powered by Vision AI,” news.samsung.com Generative AI is enabling proactive suggestions-such as pre-warming thermostats based on commute data-raising perceived value. Samsung’s Vision AI-equipped displays helped the company capture 28.3% of premium category shipments in 2024. Retailers are bundling displays with subscription services, driving recurring revenue and stickiness. Competitive intensity is heightening as Apple prepares its first smart home display, prompting ecosystem players to refresh line-ups annually.
Proliferation of Matter-compliant devices accelerating platform interoperability
Matter 1.4 introduced certified home routers that unify Wi-Fi and Thread, slashing onboarding failures and cutting installer time.[4]Granite River Labs, “CSA Unveils Matter 1.4: New Horizons for Smart Home,” graniteriverlabs.com By mid-2025 more than 1,000 Matter-certified products are expected, giving consumers confidence to mix brands without fearing lock-in. Enterprises view the protocol’s secure commissioning as a step toward meeting zero-trust mandates, encouraging broader commercial rollouts. Utilities are exploring Matter-based energy dashboards to support demand-response programs. The standard also unlocks retrofit opportunities in hospitality, where existing Wi-Fi infrastructure can host Thread border routers without rewiring.
Automotive OEM integration of smart mirrors and pillar-to-pillar cockpit displays
Automakers are embedding 26-inch plus panoramic displays that merge instrument clusters, infotainment, and passenger entertainment. Voice assistants tie vehicles to home ecosystems, letting drivers close garage doors or tweak climate control en route. High-contrast LTPS LCD remains prevalent, yet OLED adoption is climbing in luxury trims. Over-the-air updates keep cockpit UIs fresh, creating recurring software revenue streams. Shared EV platforms are standardizing display footprints, reducing per-unit cost curves and broadening adoption in mid-range vehicles by the late-2020s.
AI-powered contextual UI driving premium price mix in more than 10-inch category
Chinese brands are packaging large screens with educational content, live shopping, and telehealth, commanding 18-22% higher ASPs.[5] Contextual AI interprets user gestures and ambient data to surface relevant widgets without verbal prompts. In retail, facial-recognition-enabled displays personalize offers, driving basket-size uplift. Hospitals deploy bedside terminals that translate care instructions and collect patient feedback in real time, raising HCAHPS scores. The wider canvas allows multi-window experiences, further differentiating premium tiers and pulling display suppliers toward larger substrates.
Restraints Impact Analysis*
| Restraint | (~) % Impact on CAGR Forecast | Geographic Relevance | Impact Timeline |
|---|---|---|---|
| Security vulnerabilities in always-on microphones causing B2B procurement delays | -2.4% | Europe and North America | Short term (≤ 2 years) |
| Persistent panel shortage in 8-10-inch LCD fabs limiting supply elasticity | -1.7% | Asia-based manufacturing hubs, global downstream impact | Short term (≤ 2 years) |
| Fragmented regional data-privacy mandates raising localisation costs | -1.2% | Europe, growing impact in North America and parts of Asia-Pacific | Medium term (2-4 years) |
| Voice-assistant language support gaps curbing uptake across Nordics and Caribbeans | -0.8% | Nordics, Caribbean regions, and emerging markets | Medium term (2-4 years) |
| Source: Mordor Intelligence | |||
Security vulnerabilities in always-on microphones causing B2B procurement delays
Financial institutions and hospitals are pausing deployments until vendors document data pathways and prove on-device processing sufficiency. Procurement cycles have stretched by up to 45 days as CISOs demand penetration tests aligned with ISO 27001 requirements. Matter’s optional offline mode eases some concerns but complicates central device management, prompting requests for hybrid architectures that add cost and integration complexity. Vendors that achieve FedRAMP-equivalent attestations are winning contracts faster, creating early-mover advantages.
Persistent panel shortage in 8-10-inch LCD fabs limiting supply elasticity
Allocation constraints extend lead times to 16 weeks, pushing brands to shift mid-range designs either to 10.1-inch glass or shrink to 7-inch footprints. Vertically integrated suppliers with captive fabs maintain buffers, preserving margins while others absorb up to 120 basis-points cost inflation. Investment is flowing toward OLED and MicroLED lines rather than legacy LCD, suggesting tightness through mid-2026. Channel inventories remain lean, raising the risk of retail stock-outs during holiday peaks.
*Our forecasts treat driver/restraint impacts as directional, not additive. The impact forecasts reflect baseline growth, mix effects, and variable interactions.
Segment Analysis
By Voice Assistant: Alexa Leads Amid Rising Chinese Challengers
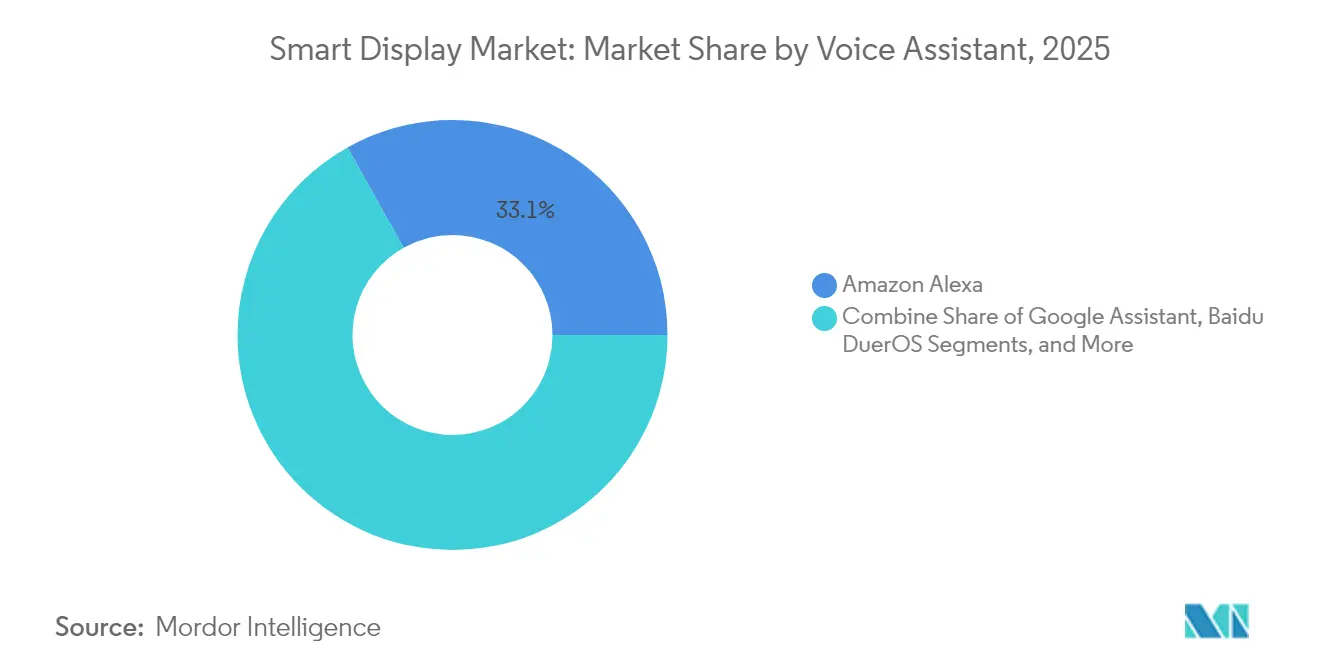
The smart display market size for voice-assistant devices reached USD 4.18 billion in 2025. Amazon Alexa held 33.12% market share in 2025, riding cross-sell momentum from Fire TV and Ring. Google Assistant followed through Nest hubs, while Alibaba’s TmallGenie grew at 18.38% CAGR, buoyed by AI chatbot integration that localizes content for Chinese dialects. The smart display market size for voice-assistant devices reached USD 4.18 billion in 2025, and replacement demand is strengthening as generative models enable memory of prior conversations. Apple’s March 2025 six-inch Home Display announcement signals fresh competition that may draw iOS households into its HomeKit universe.
Continued expansion of Mandarin-optimized large language models is eroding Alexa’s edge in China, where Baidu DuerOS controlled 41.1% of mobile smart screens despite a 10.3 percentage-point decline. Brands are differentiating via visual search, kid-safe modes, and multimodal shopping carts that link QR-based checkout. These moves illustrate how the smart display market is fragmenting into region-specific experience layers even as Matter attempts to harmonize connectivity.


By Screen Size: Larger Displays Capture Premium Segments
The 5-10-inch category dominated with 52.10% revenue in 2025 because it balances countertop space and viewing comfort. Kitchen recipes, bedroom alarms, and desk video calls mostly fit this diagonal, keeping BOM costs low. Yet the >10-inch cohort is expanding at a 18.92% CAGR as retailers, hospitals, and vehicle dashboards demand richer visuals. Wider panels invite split-screen modes for simultaneous video chats and smart-home dashboards, elevating user engagement metrics.
Average selling prices jump when diagonal exceeds 10 inches, improving manufacturer margins. OLED penetration is higher in this tier, helping the smart display market command premium price points. Panel makers are shifting capacity toward Gen 8.6 glass substrates to serve the large-format rush. Meanwhile, <5-inch devices remain in budget niches and as bedside companions, but their slice of the smart display market is shrinking under competition from wearables that already occupy the small-screen notification role.
By Display Technology: OLED Gains Momentum Despite LCD Dominance
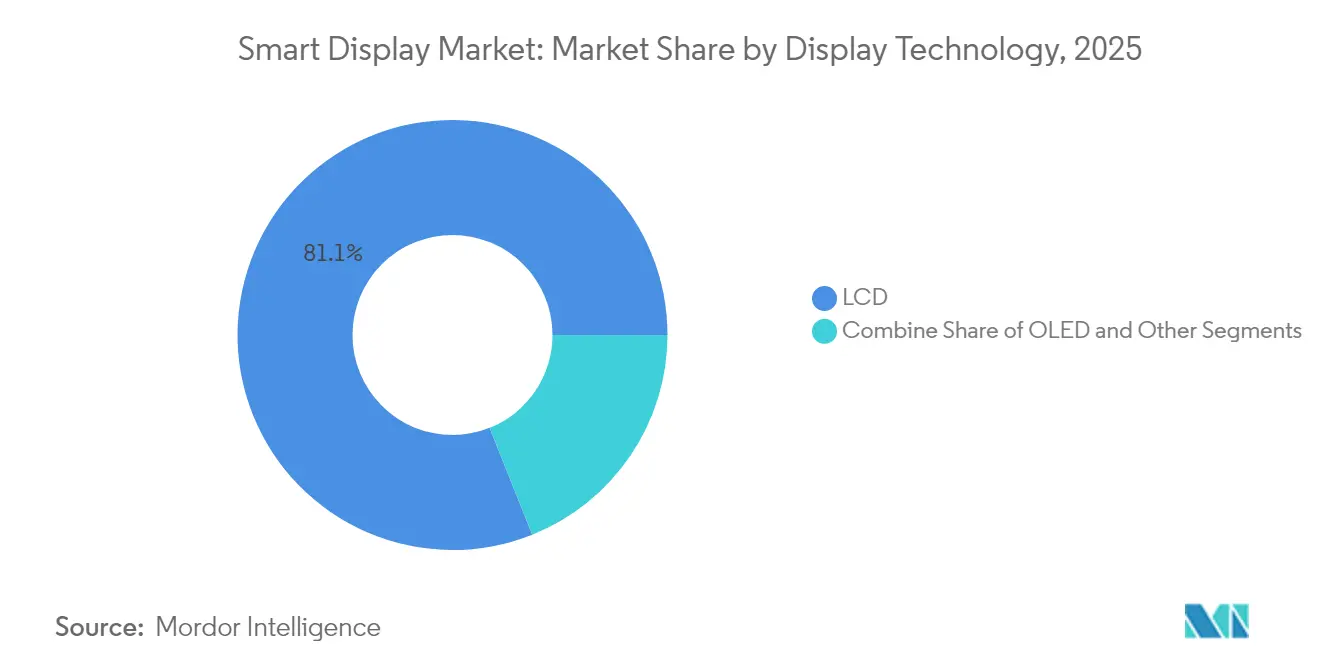
LCD retained 81.05% share in 2025, thanks to mature supply chains and competitive pricing. Automotive instrument clusters often favor LTPS LCD for thermal stability and brightness. However, OLED’s 21.35% CAGR is accelerating as vendors exploit its deep blacks and flexibility to fashion curved or rollable form factors. Smart mirrors in luxury hotels use OLED laminates to hide inactive displays behind reflective glass, commanding higher ARPU.
The smart display market size for OLED-based units is forecast to exceed USD 3.42 billion by 2031, aided by Gen 6 flexible fabs in South Korea and China. MicroLED research promises even higher luminance and lifespan, with printed transfer techniques edging closer to cost targets. Manufacturers are hedging by cross-licensing patents and mixing panel portfolios to avoid single-technology risk.
By Resolution: 4K Adoption Accelerates in Premium Segments
Full-HD panels held 56.05% shipment share in 2025, balancing clarity and cost for everyday viewing and video conferencing. 4K devices-even at small diagonals-are scaling quickly at 22.98% CAGR, propelled by automotive dashboards that combine navigation, entertainment, and ADAS visualization. Upscaling algorithms embedded in SoCs mitigate native-content shortages, making high resolutions appealing sooner.
Smart mirrors and in-store kiosks leverage 4K to display fine-grained product images and AR overlays. Although 8K remains niche, shipments are projected to hit 3.3 million units by 2025, acting as halo products that pull consumer expectations upward. Vendors must optimize thermal design as pixel density climbs, especially in fanless countertop models.
By Installation Type: Integrated Displays Disrupt Traditional Models
Stand-alone devices still represented 90.10% of 2025 shipments because they are easy to install and replace. Yet integrated smart mirrors, kiosks, and shelf-edge labels are scaling at 25.74% CAGR, weaving displays directly into furniture and store fixtures. Kroger’s EDGE shelves cut paper waste while enabling real-time pricing-proof that enterprise energy savings can finance smart display rollouts.
Bathroom mirrors with embedded screens deliver morning briefings while monitoring wellness indicators via on-board cameras. Fitness studios extend these concepts to provide form coaching. As embedded formats proliferate, channel strategies shift from consumer electronics to construction and fixtures distribution, opening white-space for OEM partnerships.
By Connectivity: Matter Protocol Drives Multi-Standard Adoption
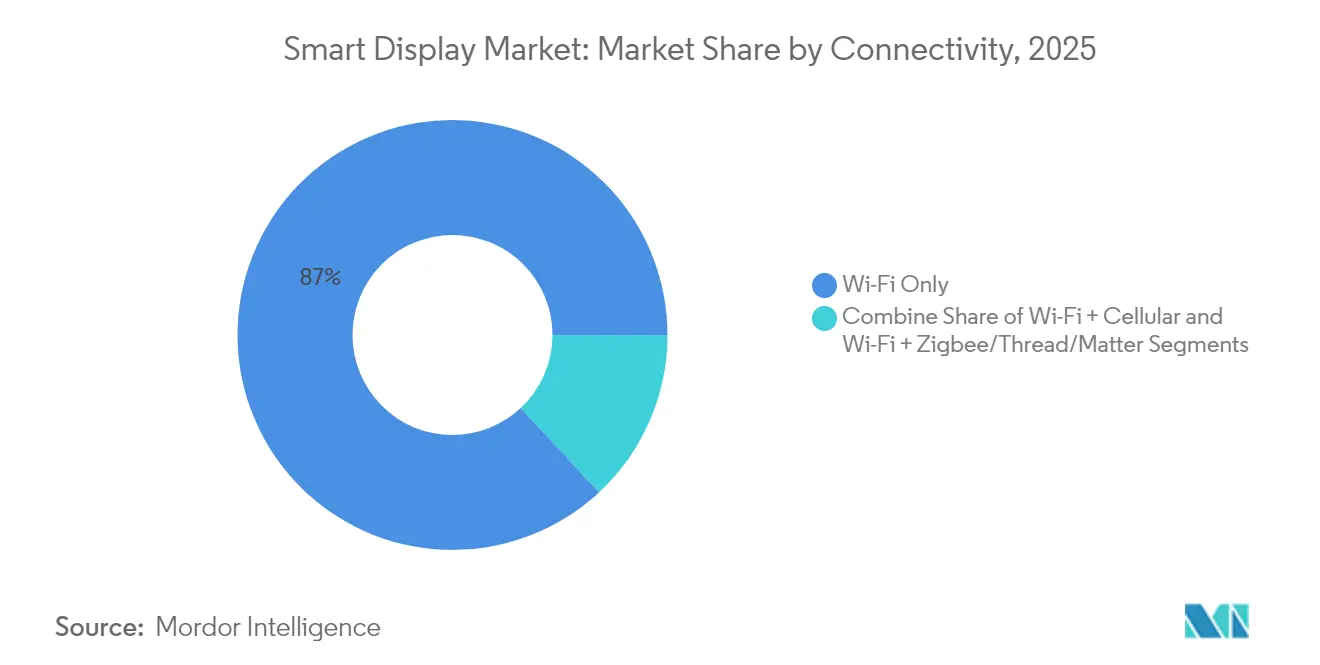
Wi-Fi-only devices formed 86.95% of 2025 volumes, reflecting home-router ubiquity. Adding Thread and Ethernet through Matter increases reliability and supports low-power mesh applications without abandoning Wi-Fi throughput. Wi-Fi + Matter shipments are set to outpace the broader smart display market at 22.41% CAGR, driven by brands bundling Thread border routers into flagship models.
Thread’s self-healing meshes lower latency for lighting and sensor responses, while 128-bit AES encryption satisfies enterprise auditors. Cellular modules remain specialty options where broadband is unreliable, such as vending machines or fleet vehicles, but higher module cost caps share growth.
By End-user Industry: Residential Dominance Faces Automotive Challenge
Residential buyers accounted for 73.95% of 2025 revenues, cementing the category’s consumer roots. Voice-assistant routine adoption-lights off, lock doors, weather briefings-keeps churn low. The automotive channel, though only single-digit share now, is sprinting at 23.62% CAGR as EV dashboards expand and drivers expect home-like interfaces.
Healthcare providers deploy bedside terminals that sync electronic health records and entertainment, cutting nurse call frequency and boosting patient satisfaction. Retailers integrate displays into end-caps for product discovery and self-checkout flows. Corporate and education users rely on interactive panels for hybrid meetings and digital whiteboarding, broadening the smart display market’s addressable base beyond households.
Geography Analysis
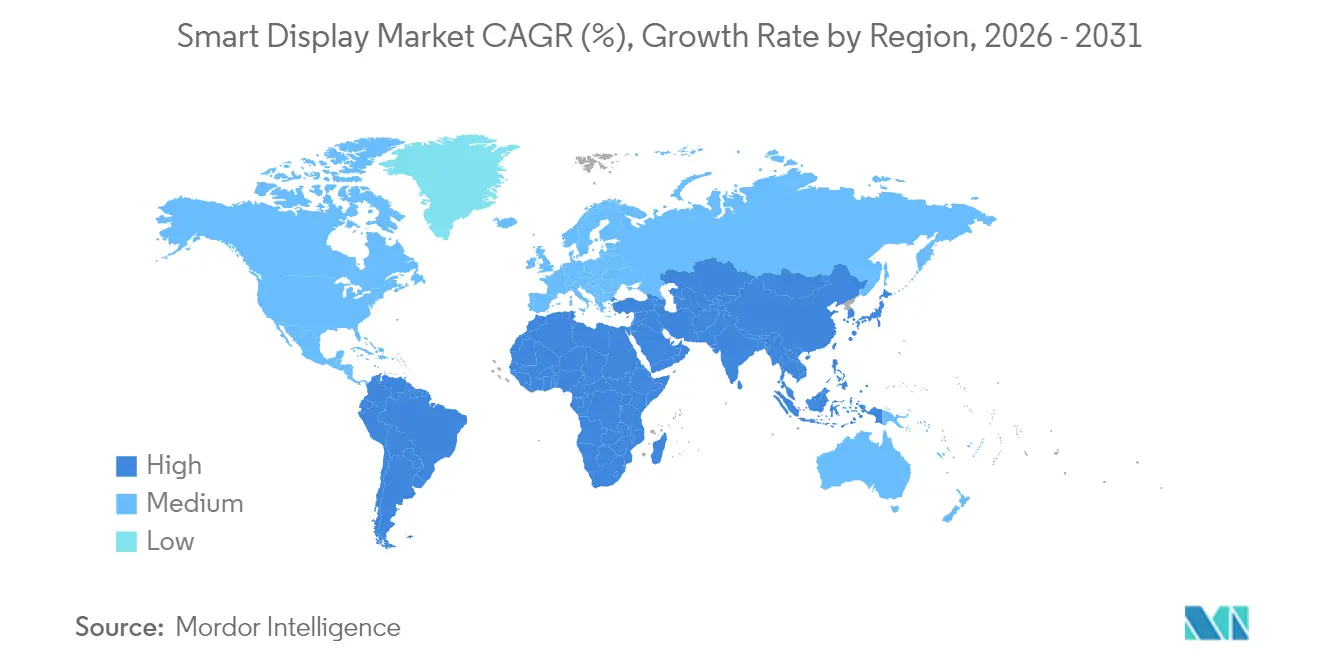
Asia Pacific led the smart display market with 37.42% revenue share in 2025 and is set to compound at 17.05% CAGR through 2031. Chinese vendors such as Baidu and Alibaba responded to a 25.6% slump in 2024 smart-speaker shipments by layering large language models onto displays, resetting value propositions. Government-backed AI chip initiatives are lowering BOM costs, enabling sub-USD 100 large-screen models that widen rural penetration. South Korean brands focus on OLED innovation, leveraging local panel ecosystems to export premium units across the region.
North America remains a technology trendsetter with near-ubiquitous broadband and high voice-assistant uptake. Replacement cycles dominate growth as households swap first-generation screens for Matter-capable variants with superior microphones and edge AI. Amazon retained 29% of U.S. smart-speaker units, rolling out generative AI upgrades to Alexa that encourage upsells to larger Echo Show models. Apple’s 2025 entry could lure a slice of the affluent iOS base, reshuffling vendor rankings.
Europe emphasizes privacy and sustainability, stimulating demand for devices with on-device processing and recycled materials. The European Smart Home market reached USD 22.11 billion in 2024, and energy-management features mandated by upcoming Ecodesign rules are steering procurement toward Matter-certified hubs that monitor consumption. Nordic adoption lags owing to voice-assistant language gaps, but regulatory clarity and subsidies for energy retrofits are expected to unlock latent demand. Emerging regions in South America, the Middle East, and Africa witness gradual uptake as smartphone OEMs bundle smaller screens to drive ecosystem stickiness, although price sensitivity and patchy connectivity temper volumes.

Value Chain Analysis
The smart display value chain starts with upstream materials and core components, including glass substrates, backlights, touch sensors, microphones and cameras, and connectivity chipsets (Wi-Fi and Thread) that support Matter-ready designs. Panel supply (LCD and OLED) remains a key cost and lead-time driver, while industry shifts increasingly focus on tighter OEM-panel co-engineering and more regionalized semiconductor footprints. For example, in March 2025 Tata Electronics, Himax Technologies, and PSMC signed an MoU to build a display and ultra-low-power AI sensing semiconductor ecosystem in India spanning design, manufacturing, and packaging. Separately, in April 2025 Omdia reported that display makers cut capacity utilization to below 80% amid uncertainty over potential US tariffs.
Midstream participants include display makers (panel fabs and module integrators), OEM and ODM assemblers that integrate SoCs and sensors, and platform and software layers (voice assistants, multimodal UI, and device-management and security stacks). Partnerships are increasingly used to accelerate AI capability and differentiated form factors: LG Electronics and Microsoft announced a partnership in January 2025 to integrate AI agents into consumer electronics, including smart home devices and displays. SmartKem and AUO started a joint project in January 2025 to develop rollable and transparent MicroLED displays at ITRI's pilot line in Taiwan. Downstream, stand-alone devices are distributed through consumer electronics retail and e-commerce, while integrated formats (smart mirrors, kiosks, shelf-edge) rely more on B2B channels such as system integrators, fixture suppliers, and enterprise procurement. In these commercial workflows, security documentation and privacy requirements can extend sales cycles.
Competitive Landscape
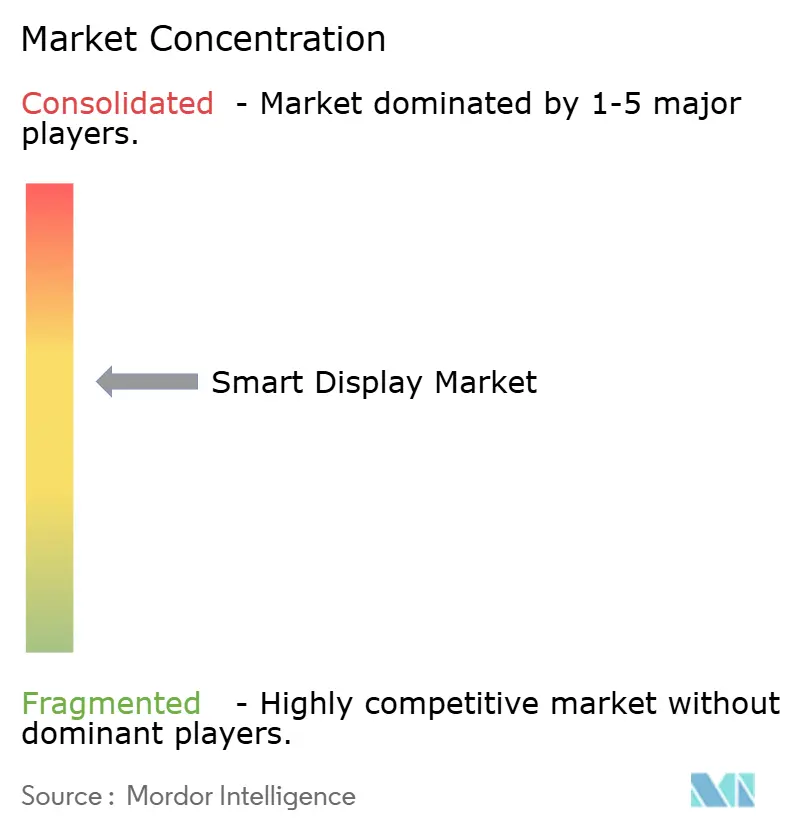
The top five vendors-Amazon, Google, Samsung, Baidu, and Alibaba-controlled roughly 65% of 2024 global shipments, indicating moderate concentration. Ecosystem owners leverage cloud platforms and content libraries to drive recurring revenues, while hardware-centric firms emphasize display quality and industrial design. Matter is eroding lock-in by letting consumers mix brands, shifting the battleground to AI features and form-factor innovation. Vertically integrated panel producers such as Samsung and LG benefit from secure supply of OLED and emerging MicroLED panels, gaining pricing power during LCD shortages.
Strategic moves underline divergence:
- Samsung showcased a 3D AR-HUD and 26.45-inch cockpit screen at CES 2025, targeting automotive Tier-1 contracts.
- Amazon announced Alexa+ devices with larger displays and on-device AI, extending control to 140,000 smart-home products.
- Apple will launch a six-inch FaceTime-enabled display in 2025, integrating Tap to Pay and UWB-based proximity automation within its HomeKit fabric.
Niche entrants focus on verticals: medical-grade units with antimicrobial coatings, retail shelf-edge labels leveraging e-paper, and ruggedized transit-station kiosks. M&A activity is expected as chipset makers seek software expertise to optimize on-device inferencing.
Smart Display Industry Leaders
-
Amazon.com, Inc.
-
Google LLC (Alphabet Inc.)
-
Baidu Inc.
-
Alibaba Group Holding Ltd.
-
Xiaomi Corp.
- *Disclaimer: Major Players sorted in no particular order

Market Opportunities and Future Outlook
Interoperability improvements under Matter create upgrade and replacement whitespace for smart displays that function as multi-admin hubs rather than single-ecosystem endpoints. Matter 1.5 released in November 2025 added device support such as security cameras and energy management, and Matter 1.6 in June 2026 introduced the Joint Fabric feature to address multi-admin friction that has limited mixed-brand deployments. This supports vendor competition on differentiated hardware (larger screens, better microphones, and sensors) and on-device experiences, even within multi-brand households and enterprise pilots.
A second opportunity is compliance-led product redesign that makes privacy and security a purchase criterion for regulated deployments, particularly in commercial contexts. In June 2026, the UK Information Commissioner's Office published final guidance for consumer IoT products emphasizing privacy by design, protective default settings, and continuous security obligations. The EU Cyber Resilience Act also introduces a September 2026 compliance deadline for connected consumer IoT products. Smart display suppliers that embed on-device processing, clearer data-path controls, and security update mechanisms into their platforms can standardize compliance features across global SKUs and reduce localization overhead, supporting broader adoption in healthcare, finance, and public sector pilots.
Recent Industry Developments
- July 2026: Google rolled out interface redesigns for Gemini on existing Nest Hub smart displays, including updates to weather and knowledge-based query experiences. The change improves the value of installed devices and highlights software-led differentiation alongside hardware refresh cycles.
- January 2025: LG Electronics and Microsoft announced a partnership to integrate AI agents into consumer electronics, including smart home devices and displays. This collaboration expands AI-enabled capabilities across consumer ecosystems and indicates a push toward more integrated, AI-assisted user experiences across brands and platforms.
- November 2024: Amazon introduced Echo Show 21 and an upgraded Echo Show 15 with Wi-Fi 6E and built-in smart home hub support aligned with Matter. The launch reinforced movement toward larger-format smart displays as central home dashboards and connectivity bridges, supporting broader multi-device orchestration.


Research Methodology Framework and Report Scope
Market Definition and Coverage
This market is defined as revenue generated from smart display devices that combine a digital screen with embedded smart functions. In practice, this usually includes voice assistant enabled and connected displays used at home and in some commercial settings.
Scope exclusions: We exclude standard TVs, basic monitors, and tablets that do not support a smart display use case as a primary function.
Segmentation Overview
-
By Voice Assistant
- Amazon Alexa
- Google Assistant
- Baidu DuerOS
- Alibaba TmallGenie
- Apple Siri
- Others
-
By Screen Size
- Less than 5 Inches
- 5 - 10 Inches
- Above 10 Inches
-
By Display Technology
- LCD
- OLED
- Others (Micro-LED, E-Paper)
-
By Resolution
- HD (= 720p)
- Full HD (1080p)
- 4K and Above
-
By Installation Type
- Stand-alone Smart Displays
- Integrated Smart Displays (smart mirrors, kiosk, shelf-edge)
-
By Connectivity
- Wi-Fi Only
- Wi-Fi + Cellular
- Wi-Fi + Zigbee/Thread/Matter
-
By End-user Industry
- Residential Smart Home
- Automotive
- Retail and Hospitality
- Healthcare
- Corporate and Education
- Others (Transportation Hubs, Public Sector)
-
By Geography
-
North America
- United States
- Canada
- Mexico
-
Europe
- Germany
- United Kingdom
- France
- Italy
- Spain
- Nordics (Denmark, Sweden, Norway, Finland)
- Rest of Europe
-
Asia-Pacific
- China
- Japan
- South Korea
- India
- Southeast Asia
- Australia
- Rest of Asia-Pacific
-
South America
- Brazil
- Argentina
- Rest of South America
-
Middle East
- Gulf Cooperation Council Countries
- Turkey
- Rest of Middle East
-
Africa
- South Africa
- Nigeria
- Rest of Africa
-
North America
Data Sources, Market Sizing, and Validation
Desk Research
Desk work started with public data to set the boundaries for what counts as a smart display and to identify where demand is actually forming. We referred to sources such as the US International Trade Commission import statistics, UN Comtrade, and national telecom and ICT releases that indicate connected device penetration and broadband growth.
To keep assumptions realistic, we also reviewed materials such as company annual reports and investor decks, press releases linked to product launches, and notes from standards bodies (for example, Matter related publications) that signal feature shifts and replacement cycles. In a few places, we used approved paid subscriptions for company financials and for patent databases to confirm which device categories were being actively developed and commercialized. These desk sources are not exhaustive, and other public documents were used for data collection, validation, and clarification during the work.
Primary Interviews and Surveys
Primary discussions were run across the ecosystem, including device manufacturers, component and module suppliers, distribution partners, and large buyers that deploy displays in home and commercial environments. Since this is a global market, inputs were balanced across APAC, EMEA, and the Americas to confirm adoption pace, pricing trends, and which form factors are being treated as smart displays in day-to-day reporting.
table_heading: Distribution of primary research fieldwork respondents
Distribution of primary research fieldwork respondents
| Company type | Respondent position | Region |
|---|---|---|
| Top tier: 30% | CXOs: 12% | APAC: 39% |
| Mid tier: 56% | Functional/Unit leaders: 40% | EMEA: 35% |
| Smaller Players: 14% | Managers: 48% | Americas: 26% |
Market-Sizing & Forecasting
The sizing logic uses a top-down build where the connected device demand pool is reconstructed by region, then filtered through smart display adoption and replacement behavior before value is calculated. We then corroborate totals with selective bottom-up approximations such as sampled average selling price (ASP) by screen size, channel checks on unit movement, and a limited roll-up of key supplier exposure, which helps adjust outliers.
Key inputs used in the model include smart home penetration, household broadband coverage, average screen size mix (for example, 5-10 inches versus larger formats), connectivity and platform adoption patterns (voice assistant presence and Wi-Fi usage), and observed ASP progression by region and by form factor. Where coverage is thin for smaller geographies, gaps are handled using proxy indicators such as adjacent connected home device growth and import trends, and the assumptions are then tested in expert calls.
For forecasting, scenario analysis is used around a base case, since growth is sensitive to smart home adoption rates and pricing declines. The forward path is checked against expert views on refresh cycles, feature upgrades (including interoperability standards), and expected mix shifts between home displays and other smart display uses.
Data Validation & Update Cycle
Outputs are checked against independent signals such as regional connected device trends, trade flows for relevant device categories, and whether implied ASPs remain within a realistic range over time. When a variance looks too wide, we revisit the driver assumption, re-check the source trail, and, if needed, re-contact industry participants to confirm what changed.
Before sign-off, results go through multi-step analyst review, including consistency checks across regions and a final pass for year-over-year logic. Reports are refreshed annually, and interim updates are made when material events occur such as major platform changes, policy shifts, or a visible demand break. Right before delivery, an analyst completes a fresh review so clients receive the latest updated view.
Mordor Intelligence's Smart Display Market Size Versus Other Published Estimates
Published market sizes for smart displays can look far apart because the product boundary is not always treated the same, and because firms pick different base years and growth windows. Differences also come from how pricing is handled, especially when screen size mix and regional ASP declines shift at the same time.
The benchmark table shows a wide spread that is mainly explained by scope choices and the way each model converts units to value. In Mordor Intelligence's model, the count focuses on smart display devices with embedded smart functions (including stand-alone and integrated formats such as smart mirrors) and it avoids pulling in standard TVs or generic monitors that inflate the demand pool.
Benchmark comparison
| Source | Market Size | Gaps in Research Methodology |
|---|---|---|
| Mordor Intelligence | USD 5.49 B (2026) | |
| Industry Publisher A | USD 12.39 B (2026) | Uses a broader definition that groups smart signage and multiple commercial display categories into the same total, which raises the 2026 value versus a device-focused scope. |
| Regional Consultancy B | USD 11.17 B (2025) | Different base year and a wider type list that blends smart home displays, smart signage, and mirrors, and it can apply faster growth assumptions without the same screen-size and ASP cross-checks. |
Reading the three values together, the main takeaway is that a clearer device boundary and a repeatable price by volume logic reduce confusion when smart displays overlap with signage and other screens. Our approach stays traceable because the inputs are tied to adoption, connectivity, screen size mix, and realistic ASP movement, and then reviewed again when a number does not match external market signals.


Key Questions Answered in the Report
What is the projected smart display market size for 2031?
The smart display market size is forecast to reach USD 11.82 billion by 2031, growing at a 16.58% CAGR.
Which voice assistant currently holds the highest smart display market share?
Amazon Alexa led in 2025 with 33.12% smart display market share.
Why is the Matter protocol considered pivotal for the smart display industry?
Matter removes interoperability barriers, letting devices from different brands work together and accelerating multi-vendor adoption across the smart display industry.
Which segment is set to expand fastest between 2026 and 2031?
Above-10-inch screens will grow at a 18.92% CAGR, driven by automotive, retail and healthcare demand.
How large is the opportunity in automotive cockpits?
The automotive vertical is the fastest-growing end-user segment, expected to post a 23.62% CAGR and account for an increasing slice of the overall smart display market size by 2031.
What level of market concentration characterises the sector today?
The top five vendors controlled roughly 65% of 2024 shipments, giving the smart display market a moderate concentration profile.
Page last updated on:






