
Smart Contact Lenses Market Size and Share
Market Overview
| Study Period | 2020 - 2031 |
|---|---|
| Market Size (2026) | USD 5.52 Million |
| Market Size (2031) | USD 7.88 Million |
| Growth Rate (2026 - 2031) | 7.39 % |
| Fastest Growing Market | Asia-Pacific |
| Largest Market | North America |
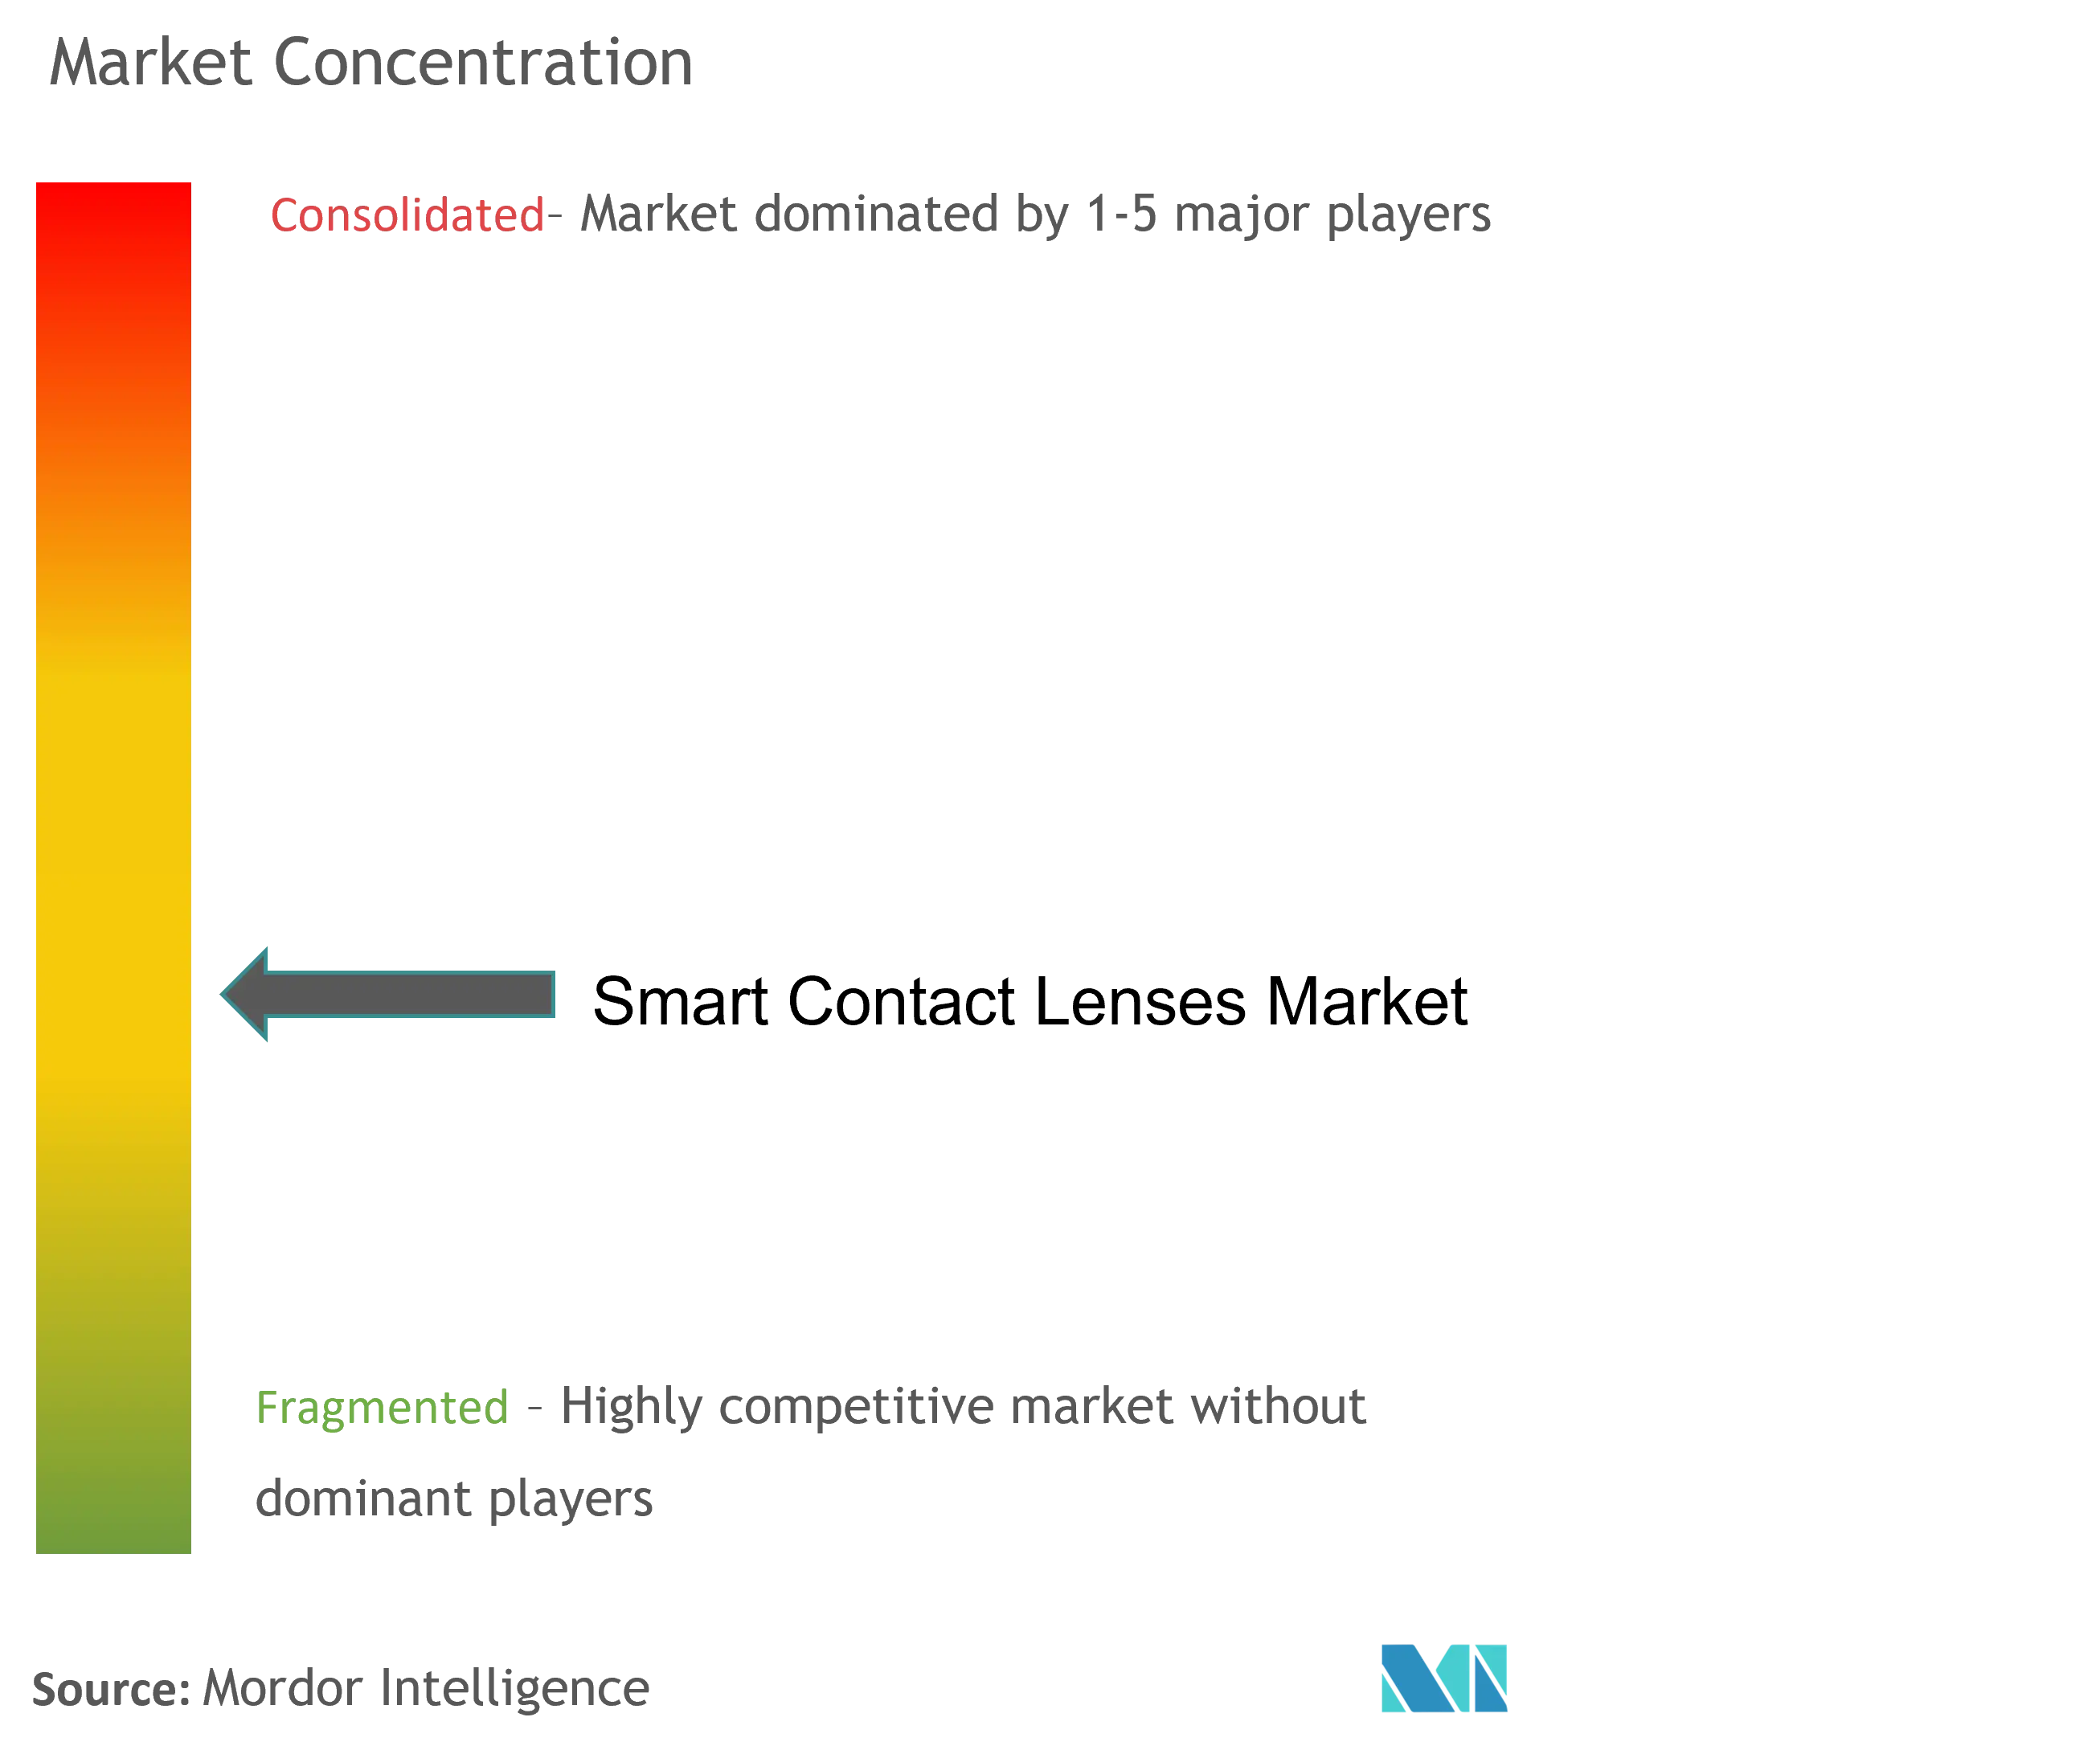
| Market Concentration | Medium |
Major Players
*Disclaimer: Major Players sorted in no particular order Image © Mordor Intelligence. Reuse requires attribution under CC BY 4.0. |
|
Smart Contact Lenses Market Analysis by Mordor Intelligence
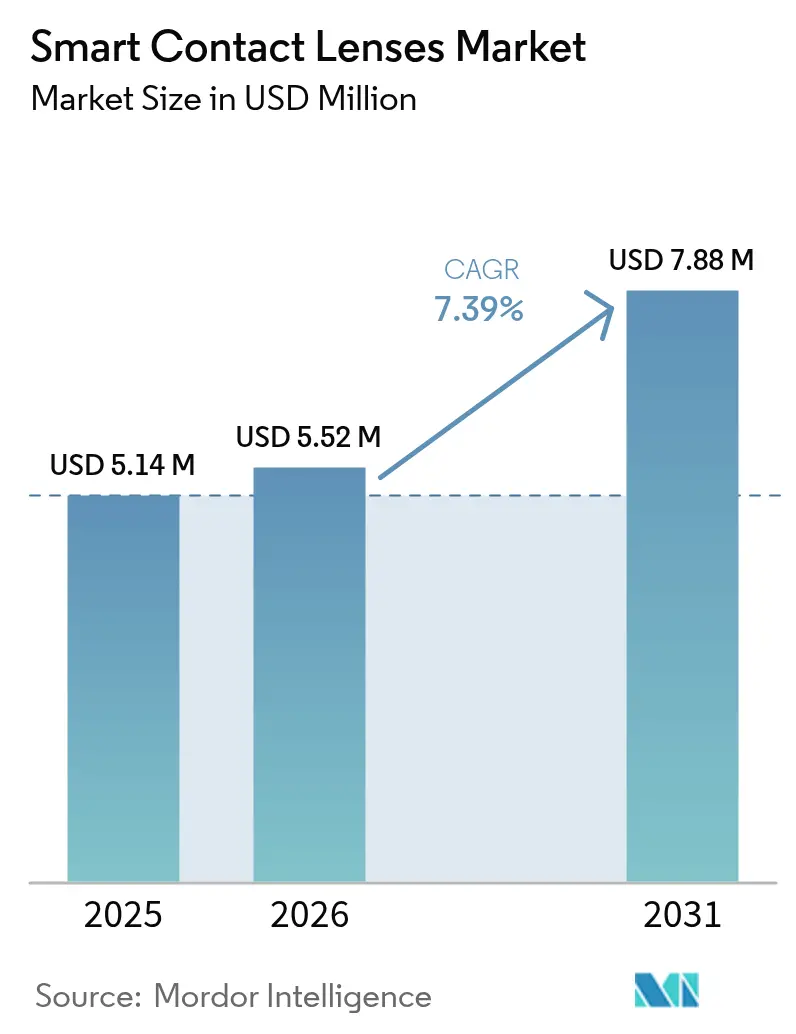
The smart contact lenses market size is expected to grow from USD 5.14 million in 2025 to USD 5.52 million in 2026 and is forecast to reach USD 7.88 million by 2031 at 7.39% CAGR over 2026-2031. This upswing is linked to maturing sub-µW biosensors that support continuous tear-based glucose and intraocular pressure (IOP) monitoring, an emerging set of reimbursement codes in major healthcare systems, and growing preference for non-invasive, real-time diagnostics over episodic clinic visits. Silicon-hydrogel nanocomposites have lowered manufacturing rejects, supporting economies of scale, and 5G/LTE-M connectivity enables secure data transmission to electronic health record systems. Early FDA clearances for drug-eluting lenses signal regulatory momentum, while Asia-Pacific’s technology ecosystems accelerate product iteration and cost reduction. These forces collectively underpin double-digit expansion of the smart contact lenses market despite current price premiums.
Key Report Takeaways
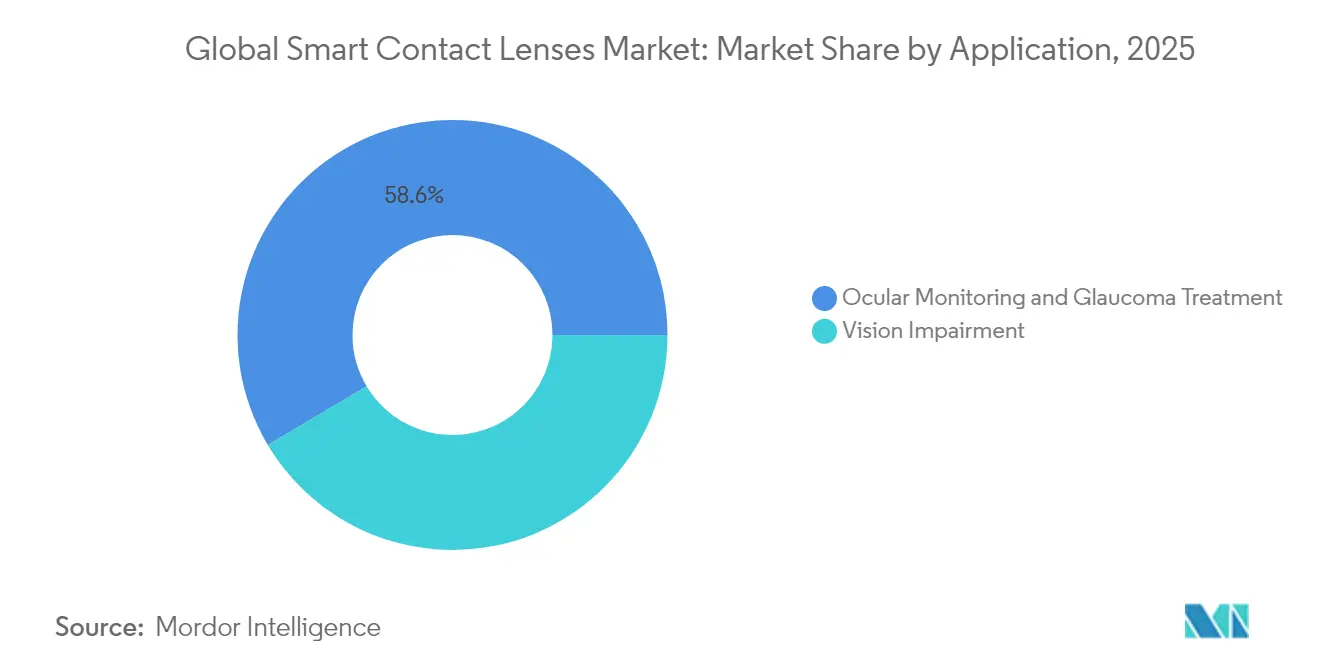
- By application, Ocular monitoring and glucose treatment lenses accounted for 58.55% revenue share in 2025, whereas drug-delivery lenses are projected to grow at 7.72% CAGR through 2031.
- By end user, hospitals and ophthalmology clinics captured 45.96% of the smart contact lenses market size in 2025, while the home-care segment is pacing a 7.93% CAGR to 2031.
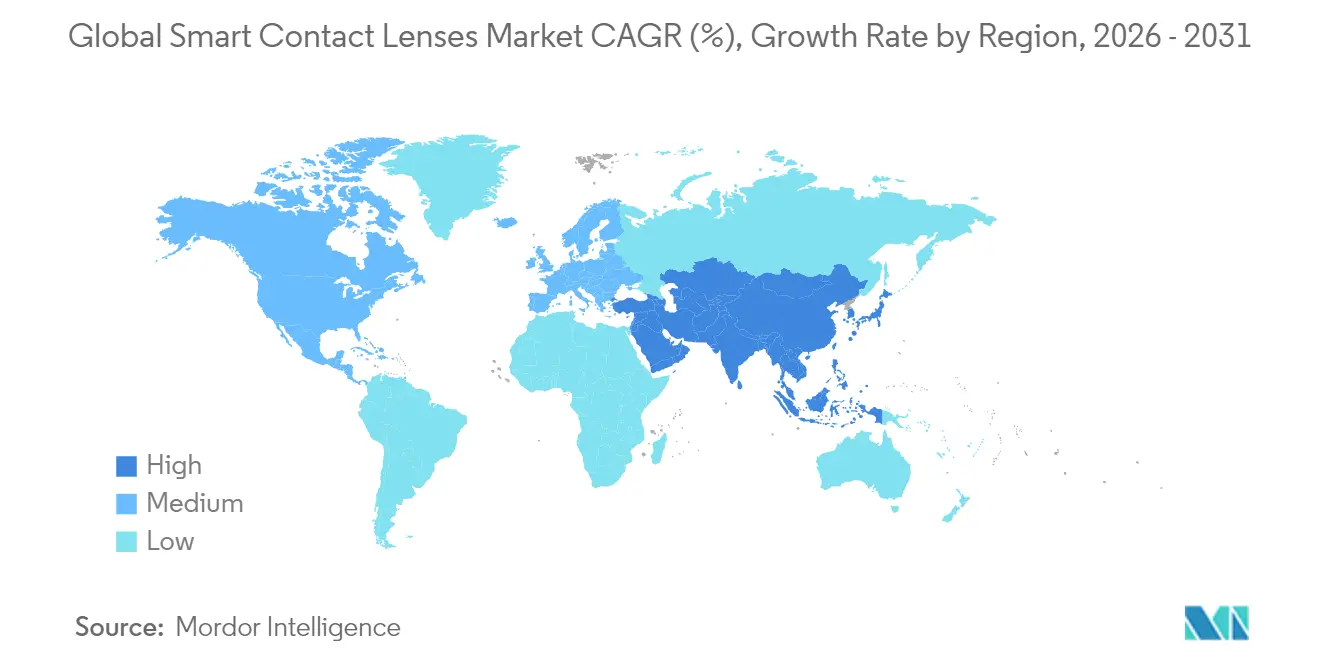
- By geography, North America led with 58.54% market share in 2025; Asia-Pacific is the fastest-growing region at 8.19% CAGR through 2031.
Note: Market size and forecast figures in this report are generated using Mordor Intelligence’s proprietary estimation framework, updated with the latest available data and insights as of 2026.
Global Smart Contact Lenses Market Trends and Insights
Drivers Impact Analysis*
| Driver | (~) % Impact on CAGR Forecast | Geographic Relevance | Impact Timeline |
|---|---|---|---|
| Miniaturised on-lens biosensors reach sub-µW power levels | +2.8% | Global, with early adoption in North America & EU | Medium term (2-4 years) |
| Reimbursement codes emerging for IOP & glucose tear monitoring | +2.1% | North America & EU primarily, expanding to APAC | Short term (≤ 2 years) |
| 5G / LTE-M eSIM modules enable continuous lens connectivity | +1.9% | Global, led by APAC infrastructure rollouts | Medium term (2-4 years) |
| Silicon-hydrogel nanocomposites slash manufacturing rejects | +1.4% | Global manufacturing hubs | Short term (≤ 2 years) |
| Pharma-device bundle deals for ocular drug-delivery lenses | +1.2% | North America & EU regulatory environments | Long term (≥ 4 years) |
| Big-Tech licensing of AR micro-display IP to lens makers | +1.6% | Global, concentrated in tech innovation centers | Long term (≥ 4 years) |
| Source: Mordor Intelligence | |||
Miniaturised On-Lens Biosensors Reach Sub-µW Power Levels
Sub-µW biosensors now harvest ~150 µW at 3.3 V from combined flexible solar and metal-air sources, allowing autonomous operation without bulky battery packs. Ti₃C₂Tx MXene sensors demonstrate 12.52 mV/mmHg sensitivity for IOP, validating high-accuracy ocular measurements with minimal irritation. This leap enables a shift from research prototypes to commercial devices capable of continuous glucose monitoring, a use-case that commands the largest share of the smart contact lenses market. Lower power budgets also simplify thermal management, preserving corneal comfort during extended wear. Collectively, these advances convert a core technical bottleneck into a launchpad for multi-sensor product roadmaps.
Reimbursement Codes Emerging for IOP & Glucose Tear Monitoring
In 2025, Medicare issued a category III CPT code for continuous tear glucose monitoring, greatly improving provider economics in the United States. Earlier, FDA cleared Acuvue Theravision with Ketotifen, illustrating a feasible path for ophthalmic combination devices. Payer recognition lowers out-of-pocket costs for chronic-disease patients, aligning incentives for wider prescription. EU payers are piloting similar codes under digital therapeutics frameworks, and Japan’s universal coverage system is reviewing inclusion criteria. Reimbursement momentum accelerates volume adoption, particularly in diabetes care where continuous monitoring curbs long-term complications and associated costs.
5G/LTE-M eSIM Modules Enable Continuous Lens Connectivity
Embedding eSIMs compliant with LTE-M Release 14 allows secure over-the-air provisioning, eliminating manual SIM swaps that are impractical in ophthalmic devices. Field tests show 4.5 Mbps throughput over resonant magneto-quasistatic channels with negligible path-loss variance at typical eye-to-hand distances. As carriers densify low-power IoT networks, lenses can transmit real-time data to cloud dashboards and trigger clinician alerts. The same link also supports AR overlays, broadening the addressable use-cases beyond medical monitoring to wellness and infotainment, which together underpin expansion of the smart contact lenses market.
Silicon-Hydrogel Nanocomposites Slash Manufacturing Rejects
Dual-cure 3D printing coupled with in-mold reactive bonding trims reject rates by 38%, according to a 2024 multi-site manufacturing study. Mel4 peptide coatings reduce P. aeruginosa colonization by 99% after seven-day soak tests, addressing infection risk when electronics are embedded.. These material innovations decrease unit costs and enhance safety, supporting volume ramps. Improved yields also foster design experimentation, accelerating time-to-market for advanced functions such as drug-reservoir layers or micro-LED arrays.
Restraints Impact Analysis*
| Restraint | (~) % Impact on CAGR Forecast | Geographic Relevance | Impact Timeline |
|---|---|---|---|
| Long-term biocompatibility of stretchable antennas uncertain | -1.8% | Global regulatory scrutiny | Long term (≥ 4 years) |
| High BOM keeps ASP > USD 300 per lens in 2025 | -2.3% | Global cost pressures | Medium term (2-4 years) |
| Fragmented global approval pathways (FDA, MDR, MFDS, NMPA) | -1.5% | Global, varying by jurisdiction | Medium term (2-4 years) |
| Supply of medical-grade micro-LEDs <5 µm remains constrained | -1.9% | Global manufacturing hubs | Short term (≤ 2 years) |
| Source: Mordor Intelligence | |||
Long-Term Biocompatibility of Stretchable Antennas Uncertain
Current ISO 10993 ocular protocols do not fully address nano-scale metal dissolution from serpentine silver-graphene traces used as antennas. Early 26-week rabbit trials revealed trace silver ion accumulation in retro-bulbar tissues, prompting the FDA to request multi-year follow-ups before approving continuous-wear indications. Manufacturers now explore biodegradable poly-L-lactic acid substrates and parylene-encapsulated interposers to curb leaching risks. Until long-term safety data matures, market penetration in chronic-use segments such as glaucoma and diabetes remains gated, restraining CAGR.
High BOM Keeps Low ASP per Lens in 2025
A single micro-LED display stack contains ~2 million chips at < 5 µm pitch, demanding ±1 µm placement accuracy under 10 minutes to maintain cost targets. Yield shortfalls in mass-transfer bump bonding still exceed 4%, adding USD 55 to unit cost. Medical-grade micro-batteries, hermetic encapsulation, and eSIM modules further inflate bills of materials. These economics confine early adoption to affluent health systems and premium consumer segments, delaying the scale advantages that would compress the smart contact lenses market size in developing regions. Supplier roadmaps promise 40% cost erosion by 2028, but interim price points remain a headwind.
*Our forecasts treat driver/restraint impacts as directional, not additive. The impact forecasts reflect baseline growth, mix effects, and variable interactions.
Segment Analysis
By Application: Glucose Monitoring Leads, Drug Delivery Accelerates
Glucose-monitoring devices accounted for 58.55% of 2025 revenues, capitalizing on a diabetic population exceeding 540 million worldwide and the demonstrated clinical correlation between tear and blood glucose (R² > 0.87 in recent human trials). Continuous glucose trackers reduce hypoglycemic events by 28% compared with finger-stick monitoring in a 180-day multi-center study, justifying payer coverage. Intraocular pressure monitoring serves 80 million glaucoma patients, enabling detection of nocturnal IOP spikes missed in clinic. Augmented reality overlays remain pre-commercial but fuel long-term upside as micro-LED efficiency improves.
Drug-delivery lenses, the fastest-growing application at 7.72% CAGR, employ vitamin E barriers or micro-reservoirs to sustain therapeutic dosing over days, addressing chronic adherence gaps in conditions like allergic conjunctivitis. FDA clearance of ketotifen-eluting lenses validates the regulatory pathway and spurs pipelines for prostaglandin analogs. The multi-functional lens archetype—diagnostic plus therapeutic—promises platform differentiation, reinforcing expansion of the smart contact lenses market.

By End User: Home-Care Segment Transforms Market Dynamics
Hospitals and ophthalmology clinics retained 45.96% of smart contact lenses market size in 2025, anchoring early adoption via clinician-supervised fitting and data interpretation. These settings generate real-world evidence vital for reimbursement. Yet, app-enabled remote monitoring propels the home-care segment to a 7.93% CAGR through 2031. Bluetooth Low Energy relays tear glucose or IOP readings to smartphone dashboards, empowering self-management. Payers endorse at-home models that cut clinic visits and associated costs.
Enterprise wellness programs in North America and corporate health insurers in Japan subsidize smart lenses for high-risk diabetic employees, accelerating workplace uptake. Pharmacies leveraging tele-optometry kiosks expand access in suburban and rural areas. As form factors converge with daily-wear soft lenses, the locus of care shifts decisively toward the consumer, catalyzing deeper penetration of the smart contact lenses market.
Geography Analysis
North America maintained 58.54% smart contact lenses market share in 2025, underpinned by FDA clearances and robust reimbursement that cushion USD 300+ price points. The United States hosts production hubs for micro-LEDs and biosensors, anchoring supply chains and sparking university-industry consortia for ocular bioelectronics. Canada’s single-payer system began pilot tear-glucose programs in 2025, broadening public coverage. Mexico leverages maquiladora incentives to attract lens assembly lines, compressing regional logistics cycles. Together, these dynamics preserve North America’s leadership despite high labor costs.
Asia-Pacific delivers the fastest CAGR at 8.19%, buoyed by South Korea’s expedited MFDS fast-track designations, Japan’s AMED grants for bio-sensorization, and China’s volume-driven component ecosystem. In China, a diabetic base of 141 million boosts demand for glucose lenses, while domestic display makers channel Mini-LED expertise into lens projects. India’s Ayushman Bharat scheme begins covering remote IOP monitoring, activating rural demand. This confluence positions Asia-Pacific as the growth engine of the smart contact lenses market.
Europe records steady uptake as MDR clarity improves. Germany’s DIGA framework now reimburses digital ophthalmic therapeutics, and France’s Haute Autorité de Santé released 2025 guidelines for continuous ocular monitoring. United Kingdom spin-outs from University of Manchester advance graphene antennas compliant with NHS Cybersecurity Toolkit standards. Southern Europe and the Nordics pursue EU Structural Funds to equip regional hospitals with smart lens diagnostics. While CE-marking timelines extend launch cycles, Europe’s emphasis on safety and data privacy cultivates user trust, reinforcing gradual but resilient adoption.
Regulatory Landscape
Smart contact lenses fall under medical-device oversight in major jurisdictions, with classification driven by intended use and risk profile. In the United States, the FDA (CDRH) regulates smart contact lenses as Class II or Class III devices, and sensor-enabled or drug-delivery designs can be treated as combination products, which affects whether sponsors pursue 510(k) clearance versus PMA alongside UDI and wireless cybersecurity controls for connected functions.
In Europe, the EU Medical Device Regulation (MDR) 2017/745 applies a risk-based framework (Classes I to III) and adds emphasis on clinical evidence, traceability, and post-market obligations. Implementation details affecting smart contact lenses include Master UDI-DI and Eudamed-aligned traceability practices, reinforced through European Commission guidance (MDCG 2024-14). Global clinical-investigation expectations for contact lenses are updated via ISO 11980 (Fourth edition, June 2025).
Value Chain Analysis
The smart contact lenses value chain starts with specialty polymers and coatings (silicone-hydrogel bases, surface treatments), microfabricated sensing and connectivity components (biosensors, ASICs, antennas, and in some concepts micro-displays), and power or energy-harvesting elements. It then moves to integration into lens form factors under tight biocompatibility and sterilization constraints. Manufacturing steps typically include micro-component assembly or embedding, encapsulation, in-mold bonding or printing, optical verification, and sterile packaging, with yield management and supplier qualification as recurring bottlenecks due to sub-micron placement tolerances and medical-grade reliability requirements.
Downstream distribution relies on clinician-supervised channels, including hospitals, ophthalmology clinics, and optometry networks, where fitting, training, and clinical data capture support reimbursement and regulatory obligations. Software layers extend the chain into secure data handling and remote monitoring. Regulatory traceability requirements in the EU (Master UDI-DI and Eudamed workflows) and FDA expectations around quality systems and cybersecurity increase the importance of documentation-heavy partners, including contract manufacturers, testing laboratories, and digital health vendors capable of supporting validation and post-market surveillance for connected lenses.
Competitive Landscape
The competitive field blends heritage contact-lens manufacturers with semiconductor and digital health entrants, yielding moderate fragmentation. Companies leverage ISO-certified plants and established optometrist channels to introduce sensor-ready silicone-hydrogel lines. Sony Corporation contribute micro-LED and ASIC IP, licensing display engines to optical majors. Samsung Electronics’ LEDoS roadmap targets 3,500 ppi resolution at < 2 mW, enticing OEM partners seeking AR integrations[2].
Patent activity exceeds 1,400 filings since 2023, with Smartlens holding 40 grants focused on anterior-segment diagnostics. Supply-side barriers persist around micro-LED mass transfer and medical-grade encapsulation, favoring incumbents with capex muscle. Nonetheless, nimble start-ups exploit open-innovation grants in Asia-Pacific to pilot novel drug-reservoir designs, occasionally outpacing corporate decision cycles.
Smart Contact Lenses Industry Leaders
-
Innovega Inc.
-
SEED Co., Ltd. (Sensimed SA)
-
Smartlens, Inc.
-
Azalea Vision
- *Disclaimer: Major Players sorted in no particular order
Market Opportunities and Future Outlook
A clear whitespace is emerging around glaucoma-focused solutions that combine continuous intraocular pressure monitoring with therapeutic delivery, moving beyond single-function sensing. This direction is supported by active development signals in 2026, including research demonstrations of microfluidic smart contact lens concepts for dual-mode IOP monitoring and sustained drug delivery, along with ongoing clinical studies for 24-hour IOP monitoring. Together, these efforts concentrate innovation on a high-need, clinically supervised use case that fits medical-device pathways.
Another opportunity area is platform standardization that lowers integration costs and accelerates iteration across multiple lens applications. Industry activity such as SEED Co., Ltd. highlighting a standardized smart contact lens integration platform and LSI architecture points to modular building blocks that can be reused across biomarker sensing and connected-lens variants. Shifts toward home monitoring also reinforce the case for secure connectivity and software-enabled workflows that fit into existing provider and payer systems.
Recent Industry Developments
- July 2026: SEED Co., Ltd. made the transfer of its smart contact lens business into its new wholly owned subsidiary, Ocudevices Co., Ltd. effective, consolidating R&D, manufacturing, and commercialization under a dedicated structure. The move streamlines execution and clarifies organizational ownership of smart lens programs as development shifts from platform creation toward productization.
- October 2025: Smartlens, Inc. closed an oversubscribed USD 5.2 million bridge financing round to advance the FDA clearance process and prepare for commercialization of its miLens glaucoma monitoring system. The funding supports regulatory work and readiness activities that can shorten the gap between clinical validation and market launch for IOP monitoring lenses.
- November 2024: SEED Co., Ltd. announced development of a standardized platform for integrating electronic components into contact lenses and a general-purpose large scale integration (LSI) circuit aimed at multiple smart lens applications. This kind of modular architecture reduces redesign cycles and supports a broader ecosystem of component and software partners around reusable electronics building blocks.
Research Methodology Framework and Report Scope
Market Definition and Coverage
This market covers revenue earned from smart contact lenses that embed electronics or sensing elements to enable functions such as tear-based glucose monitoring and intraocular pressure monitoring, as well as related smart wear or signal features, as sold for medical or broader monitored-use settings.
Scope exclusions: Excludes conventional vision-correction contact lenses and standalone readers, apps, or external sensors that do not operate as a smart lens product.
Segmentation Overview
-
By Application
- Ocular Monitoring & Glaucoma Treatment
- Vision Impairment
-
By End User
- Hospitals & Ophthalmology Clinics
- Home-care / Self-monitoring Consumers
- Others (Academic Institutes, Rehabilitation Centers, among others)
-
By Geography
- North America
- Europe
- Asia-Pacific
- Rest of the World
Data Sources, Market Sizing, and Validation
Desk Research
Desk work started with mapping what a smart contact lens is in real-world terms, and then tying it to the medical device and contact lens ecosystem. We used public sources such as the US FDA device and guidance pages, the National Institutes of Health and PubMed-indexed clinical literature, the World Health Organization for diabetes burden signals, and CDC pages for prevalence context, which help keep the demand pool realistic.
We also reviewed financial filings and investor presentations from device and lens-focused companies, along with reputable press coverage and conference abstracts to understand product readiness, clinical timelines, and likely use cases. Where available, we referenced paid subscriptions for company financials and intelligence, patent databases, and import and export shipment-level checks to validate manufacturing and component supply direction. The desk sources listed here are illustrative only, and many other public and paid references were used for data collection, validation, and clarification.
Primary Interviews and Surveys
Primary conversations were run with a mix of lens technology stakeholders, clinical users, and supply-side experts so we could test which products are truly commercial versus still in trial mode, and what pricing and adoption assumptions are reasonable. For a global market like this, inputs were balanced across the Americas, EMEA, and APAC to reflect differences in regulatory timelines, reimbursement readiness, and the pace of hospital and clinic adoption.
Distribution of primary research fieldwork respondents
| Company type | Respondent position | Region |
|---|---|---|
| Top tier: 37% | CXOs: 18% | APAC: 52% |
| Mid tier: 44% | Functional/Unit leaders: 40% | EMEA: 30% |
| Smaller Players: 19% | Managers: 42% | Americas: 18% |
Market-Sizing & Forecasting
The sizing starts from a top-down demand pool build that is anchored on the addressed patient and monitoring need, and then filtered by smart-lens readiness and expected clinical adoption. We corroborated totals using selective bottom-up approximations, where sampled average selling prices are multiplied by implied lens volumes, and supplier and channel checks are used to adjust outliers.
Key inputs used in the model include the expected commercial penetration of continuous glucose monitoring lenses and intraocular pressure monitoring lenses, likely end-user mix across hospitals and ophthalmology clinics, typical replacement and wear cycles that influence annual unit demand, average selling price ranges by lens type and function, and the pace of regulatory and reimbursement progress that affects adoption timing. Forecasts were built using scenario analysis supported by expert inputs, where timelines for approvals and scale-up were stress-tested, and the final forecast reflects the most consistent path across interviews. When a bottom-up signal was incomplete for a country, we used proxy adoption rates from comparable markets and then normalized using healthcare access and device uptake indicators.
Data Validation & Update Cycle
Outputs were checked across multiple angles so the final numbers stay consistent with real demand signals and supply-side readiness. We reviewed year-over-year changes, flagged sharp jumps that did not match regulatory timing or commercialization milestones, and then revisited the relevant assumptions through follow-up expert checks.
Before sign-off, the model and its inputs go through analyst review steps, including variance checks versus independent indicators such as disease monitoring adoption trends and clinical pipeline visibility. Reports are refreshed annually, and interim updates are done when material events occur, such as major approvals, launches, or significant pricing moves. Right before delivery, a final pass is completed so clients receive the most current view available at that time.
Mordor Intelligence's Smart Contact Lenses Market Size Versus Other Published Estimates
Published numbers for smart contact lenses can look far apart because the market still sits between clinical development and early commercialization, which changes what each publisher counts as revenue. Differences also come from whether figures blend medical sensing lenses with broader AR or consumer wearables, and from how aggressively adoption is assumed to ramp after approvals.
The biggest gap often comes from what is treated as commercial sales versus future potential, and Mordor Intelligence counts smart contact lens value only where product-ready deployment and an addressable clinical use case can be tied back to pricing and expected lens volumes, instead of extending the total by including adjacent wearable AR eyewear or pre-launch pilots. Additional spread is created by ASP assumptions (prototype-like pricing versus scaled pricing), currency conversion timing, and refresh cadence when regulatory timelines shift.
Benchmark comparison
| Source | Market Size | Gaps in Research Methodology |
|---|---|---|
| Mordor Intelligence | USD 5.14 M (2025) | |
| Industry Publisher A | USD 1.61 B (2024) | Often folds in broader smart eyewear and AR-type wearables under smart lenses, and also applies early mass-adoption curves that assume rapid scale before reimbursement and clinical workflow fit are proven. |
| Press Release B | USD 7.98 B (2025) | Uses a wide definition that can include concept-stage products and adjacent digital health device revenue, and the forecast is highly sensitive to aggressive ASP and penetration assumptions that are not clearly tied to replacement cycles or end-user purchasing reality. |
The table shows that most of the spread is explained by scope and timing, rather than simple math differences. When the model is tied to realistic lens volumes, end-user adoption pace, and observable commercialization milestones, the result is easier to trace and to update as approvals, pricing, and manufacturing scale change.
Key Questions Answered in the Report
What is the current Global Smart Contact Lenses Market size?
The Global Smart Contact Lenses Market is projected to register a CAGR of 7.39% during the forecast period (2026-2031)
What is the current smart contact lenses market size?
The smart contact lenses market size stands at USD 5.52 million for 2026 and is projected to reach USD 7.88 million by 2031 at a 7.39% CAGR.
Which material leads the market?
Silicon-hydrogel lenses dominate with 67.58% market share in 2025, offering superior oxygen permeability and electronics compatibility.
Which application segment is expanding fastest?
Drug-delivery lenses are growing at 7.72% CAGR through 2031, driven by FDA-cleared ketotifen-eluting designs.
Why is Asia-Pacific the fastest-growing region?
Rapid 5G roll-outs, government funding for digital health, and large diabetic populations fuel a 8.19% CAGR in Asia-Pacific.