
Smart Beacon Market Size and Share
Market Overview
| Study Period | 2020 - 2031 |
|---|---|
| Market Size (2026) | USD 5.08 Billion |
| Market Size (2031) | USD 13.07 Billion |
| Growth Rate (2026 - 2031) | 20.85% CAGR |
| Fastest Growing Market | Asia Pacific |
| Largest Market | North America |
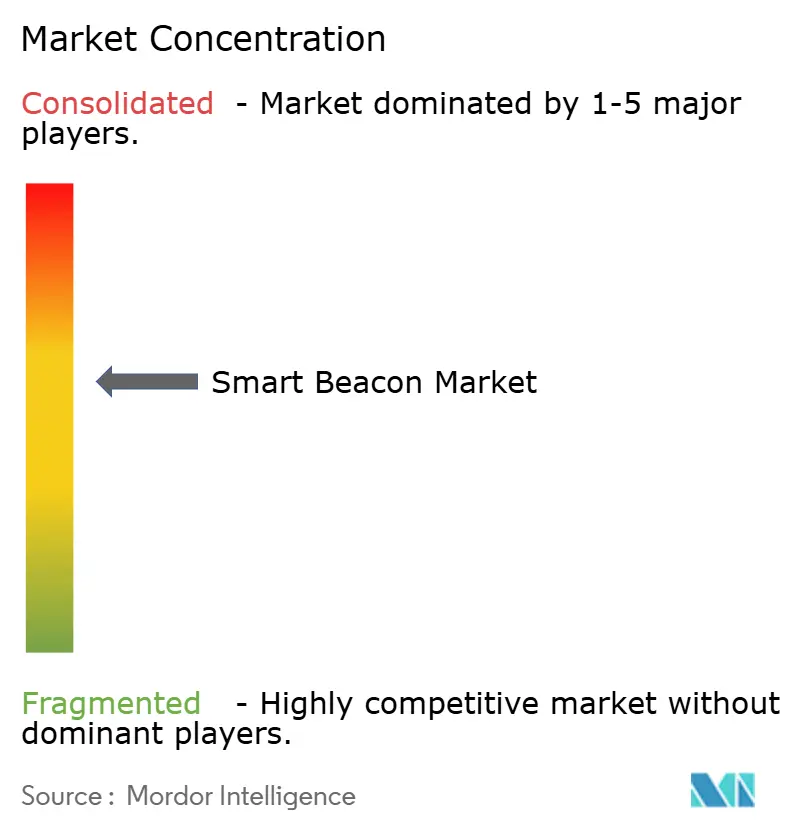
| Market Concentration | Medium |
Major Players *Disclaimer: Major Players sorted in no particular order Image © Mordor Intelligence. Reuse requires attribution under CC BY 4.0. | |
Smart Beacon Market Analysis by Mordor Intelligence
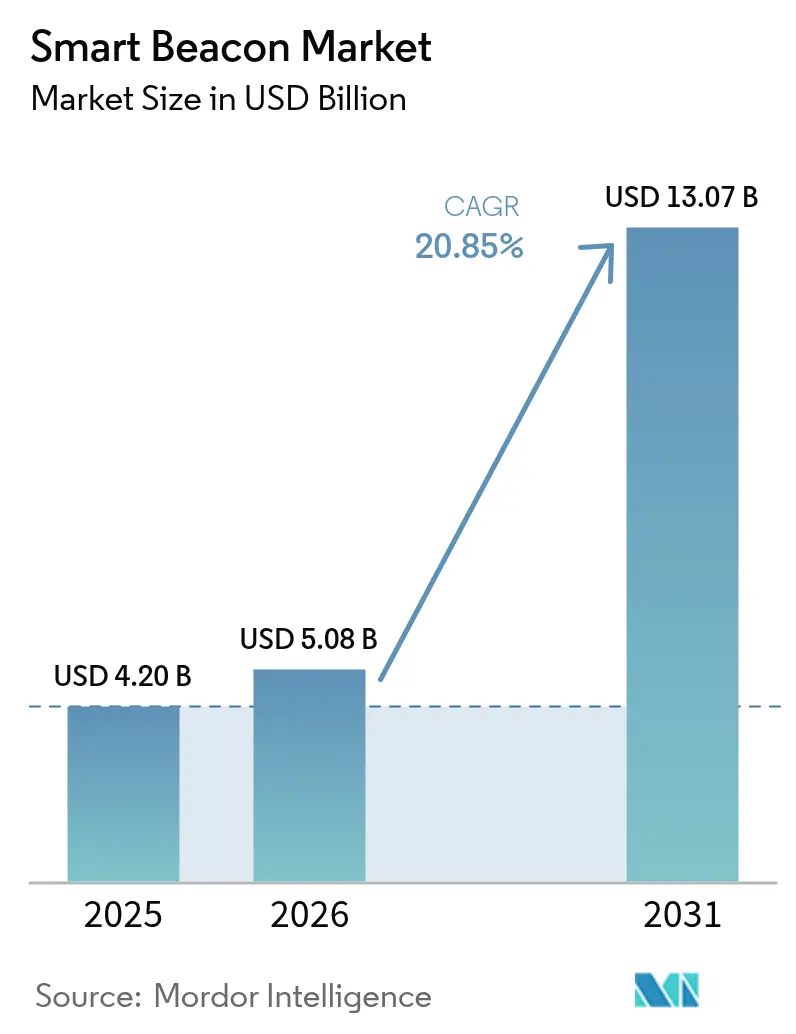
Smart beacon market size in 2026 is estimated at USD 5.08 billion, growing from 2025 value of USD 4.2 billion with 2031 projections showing USD 13.07 billion, growing at 20.85% CAGR over 2026-2031. Growth is propelled by enterprises moving from simple proximity notifications toward ambient IoT ecosystems that harvest energy from surrounding RF, light, and motion sources while interfacing with unified smart-building protocols. Retailers embrace real-time spatial analytics to lift conversion rates, healthcare providers deploy RTLS to locate critical assets and patients, and logistics operators embed beacons into supply-chain workflows to cut search time and shrinkage. Concurrently, energy-harvesting tags are lowering lifetime ownership costs, and tightening privacy mandates are reshaping solution design around explicit opt-in engagement. These converging factors position the smart beacon market as a foundational layer of next-generation indoor intelligence platforms. [1]GameStop Corp., “GameStop Enhances In-Store Experience with Beacon Technology,” gamestop.com
Key Report Takeaways
- By standard type, iBeacon led with a 60.35% revenue share in 2025, while Eddystone is projected to expand at a 27.12% CAGR through 2031.
- By connectivity, Bluetooth Low Energy held 81.20% of the smart beacon market share in 2025, whereas Wi-Fi 802.11mc is set to climb at a 28.67% CAGR to 2031.
- By end-user industry, Retail and Malls commanded 36.45% of the 2025 smart beacon market size; Healthcare Facilities represent the fastest-growing segment with a 24.68% CAGR outlook.
- By application, Proximity Marketing accounted for 41.20% of 2025 revenue, while Asset and Personnel Tracking is accelerating at a 26.44% CAGR through 2031.
- By geography, North America captured 33.10% of global revenue in 2025, yet Asia-Pacific is forecast to grow the quickest at 24.05% CAGR to 2031.
Note: Market size and forecast figures in this report are generated using Mordor Intelligence’s proprietary estimation framework, updated with the latest available data and insights as of 2026.
Global Smart Beacon Market Trends and Insights
Drivers Impact Analysis*
| Driver | (~) % Impact on CAGR Forecast | Geographic Relevance | Impact Timeline |
|---|---|---|---|
| Growing demand for spatial analytics in retail foot-fall optimisation | 4.20% | Global, concentration in North America & EU | Medium term (2-4 years) |
| Surge in beacon-enabled supply-chain visibility | 5.80% | APAC core, spill-over to North America | Long term (≥ 4 years) |
| Energy-harvesting, battery-free beacons cut lifetime TCO | 3.10% | Global, early adoption in EU & Japan | Long term (≥ 4 years) |
| Integration with Matter & unified smart-building protocols | 4.70% | North America & EU, expanding to APAC | Medium term (2-4 years) |
| Source: Mordor Intelligence | |||
Growing Demand for Spatial Analytics in Retail Foot-Fall Optimisation
Retailers have progressed from static heat maps to dynamic orchestration engines that adapt promotions in real time as shoppers dwell near specific shelves. GameStop deployed beacons across 100 stores to surface game-specific content and combat showrooming, translating location cues into targeted upsell prompts. Macy’s Black Friday “Walk in and Win” campaign blended digital scratch-off games with in-store positioning, boosting app installs and capturing granular path-to-purchase data. Telstra Retail validated 95% foot-traffic counting accuracy by fusing edge AI with identity masking, satisfying privacy expectations while preserving insight quality. These examples show that differentiated spatial intelligence can raise conversion, manage staffing, and refine assortment decisions, sustaining investment even as overall retail traffic fluctuates. [2]Telstra Corp., “AI-Powered Retail Analytics Solution Delivers 95% Accuracy,” telstra.com
Surge in Beacon-Enabled Supply-Chain Visibility
Asset visibility has shifted from convenience to operational mandate. Sky Warehouse embeds beacons on cargo pallets to cut search time and prevent misplacement, improving dock-to-dock flow metrics. Beijing’s vehicle-road-cloud pilot uses 7,000 5G-A macro cells and dense beacon clusters to orchestrate autonomous freight within logistics parks, proving that centimetre-level indoor accuracy can extend outdoor V2X continuity. Link Labs logged a 30% reduction in equipment search time and 15% fewer duplicate purchases across multi-facility hospital systems after rolling out its beacon-based RTLS platform. Siemens Logistics integrates beacon data with baggage-handling software to balance conveyor load and save energy. These cases underline why supply-chain operators are emerging as a dominant demand pool within the smart beacon market. [3]Link Labs Inc., “Healthcare RTLS Reduces Equipment Search Time by 30%,” link-labs.com
Energy-Harvesting, Battery-Free Beacons Cut Lifetime TCO
Power maintenance once restricted multi-year deployments. Wiliot’s second-generation IoT Pixels harvest ambient RF to transmit temperature and location data without batteries, shifting the cost curve for item-level tracking. MIT researchers created magnetic-field harvesters powering sensors that monitor remote machinery, illustrating viable industrial use where battery swaps are infeasible. Atmosic demonstrates photovoltaic and thermal energy harvesting that can prolong tag life indefinitely. For operations managing tens of thousands of tags, eliminating routine battery replacement reduces labour overhead and e-waste, materially broadening the smart beacon market addressable base.
Integration with Matter and Unified Smart-Building Protocols
Interoperability barriers are dissolving as Matter and enhanced Bluetooth LE channel-sounding gain traction. Apple has embedded UWB across most devices since 2019, and adoption projections exceed 60% of active iPhones by 2030, paving the way for secure digital keys and fine-ranging navigation. Bluetooth SIG’s 2024 channel-sounding update delivers sub-meter accuracy over BLE while maintaining low power. South Korea’s 48 private 5G networks underline how dedicated spectrum can backhaul high-density beacon telemetry for AI analysis. EASA’s privacy-by-design guidelines for drone positioning systems reinforce the regulatory push toward secure, interoperable indoor-outdoor continuity. Unified protocols relieve vendor-lock concerns and simplify multi-standard deployments, accelerating enterprise decision cycles.
Restraints Impact Analysis*
| Restraint | (~) % Impact on CAGR Forecast | Geographic Relevance | Impact Timeline |
|---|---|---|---|
| Scarcity of skilled BLE RF engineers for large-scale roll-outs | -2.80% | Global, acute in North America & EU | Short term (≤ 2 years) |
| Privacy-by-design mandates restrict passive data capture | -1.90% | EU primary, expanding global | Medium term (2-4 years) |
| 2.4 GHz spectrum congestion in dense IoT estates | -1.40% | Urban centers globally | Long term (≥ 4 years) |
| Slow OS-level support for background scanning post-iOS 15 | -2.10% | Global, iOS-dependent markets | Medium term (2-4 years) |
| Source: Mordor Intelligence | |||
Scarcity of Skilled BLE RF Engineers for Large-Scale Rollouts
The United States alone faces a projected 67,000 semiconductor-engineering shortfall by 2030, and BLE RF expertise is among the rarest subsets. McKinsey notes that only 43,500 of the 48,000 new technician roles needed by 2030 may be filled, creating a bottleneck that inflates project timelines and wages. A 2024 workforce survey found 53% of semiconductor employees contemplating resignation within six months, compounding churn. Beacon rollouts in hospitals or factories require precise antenna tuning, channel-interference mitigation, and power calibration that automated design tools cannot yet replicate. Vendors struggling to secure seasoned RF talent risk cost overruns and client dissatisfaction, limiting near-term uptake despite robust underlying demand.
Privacy-by-Design Mandates Restrict Passive Data Capture
Europe’s 2025 GDPR update tightens consent protocols, curbing passive presence detection that once powered granular foot-tall analytics. Apple and Google introduced unwanted-tracking alerts requiring explicit opt-in for background beacon discovery, reducing anonymous data volume. The EU Cyber Resilience Act layers cybersecurity standards onto device design, extending R and D cycles and raising compliance costs. Apple’s private Wi-Fi address rotation and stricter Bluetooth permission workflows started in iOS 18.2 shift data processing toward on-device models, forcing vendors to redesign analytics pipelines. These moves reorient the smart beacon market toward overt value exchange—such as loyalty perks—instead of silent observation, altering ROI calculus for some retail scenarios.
*Our forecasts treat driver/restraint impacts as directional, not additive. The impact forecasts reflect baseline growth, mix effects, and variable interactions.
Segment Analysis
By Standard Type: Eddystone Chips Away at iBeacon Primacy
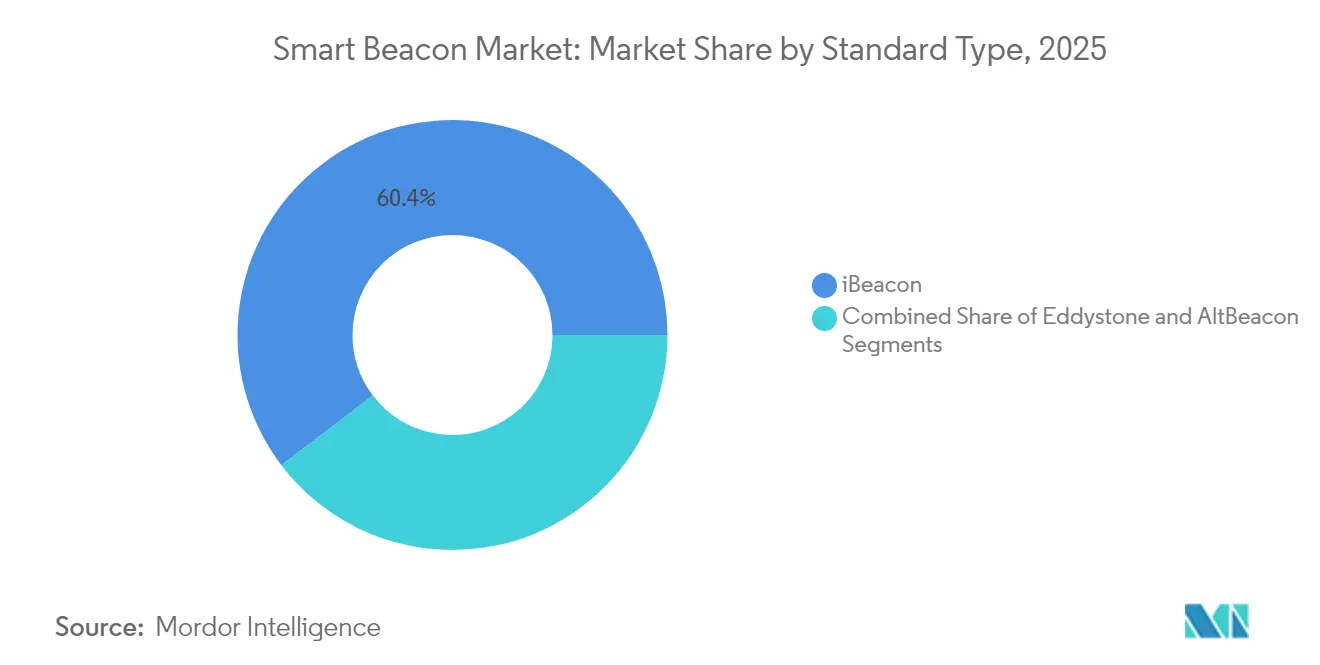
iBeacon accounted for 60.35% of 2025 revenue, reflecting Apple’s early push and embedded support within its mobile OS ecosystem. Eddystone, however, is growing at a 27.12% CAGR as enterprises favour Google’s web-centric Physical Web model that removes the friction of mandatory app downloads. The smart beacon market size for Eddystone deployments is forecast to expand sharply as building-management platforms embed native support and as Matter bridges multiple radio stacks. AltBeacon maintains a loyal base among industrial users seeking vendor-neutral frameworks.
A deeper look reveals platform strategy is the true differentiator. Apple’s consolidation of Ultra-Wideband and BLE in a single radio front end enables secure access control and spatial computing scenarios unavailable when iBeacon launched. Google counters by making broadcast URLs discoverable in Chrome and Android Quick Settings, empowering public-space operators to push context without cultivating native apps. This dual trajectory encourages enterprises to adopt multi-standard stacks, intensifying demand for gateway devices that translate among iBeacon, Eddystone, and AltBeacon payloads inside the broader smart beacon market.


By Connectivity: Wi-Fi FTM Mounts a Precision Challenge
Bluetooth Low Energy retained 81.20% market share in 2025 thanks to unrivalled chipset availability and sub-milliwatt power draw that keeps battery-based tags alive for years. Yet Wi-Fi 802.11mc fine-time-measurement is rising at a 28.67% CAGR as hospitals, airports, and warehouses seek centimetres-grade accuracy without deploying additional radios; existing Wi-Fi access points only need firmware upgrades. The smart beacon market share for BLE will remain the largest through 2031, but its dominance will narrow as hybrid BLE + Wi-Fi tags proliferate.
Ultra-Wideband plays a specialist role where security and sub-10 cm accuracy justify higher bill-of-materials, such as infant-abduction prevention or automated guided vehicles. Meanwhile, Bluetooth SIG’s new channel-sounding extension promises sub-meter precision over standard BLE, blunting Wi-Fi’s accuracy advantage. Connectivity decisions now revolve around latency tolerance, battery life expectations, and capital budget rather than any single protocol’s technical merit, diversifying revenue streams within the smart beacon market.
By Application: Asset Tracking Surges Beyond Promotion
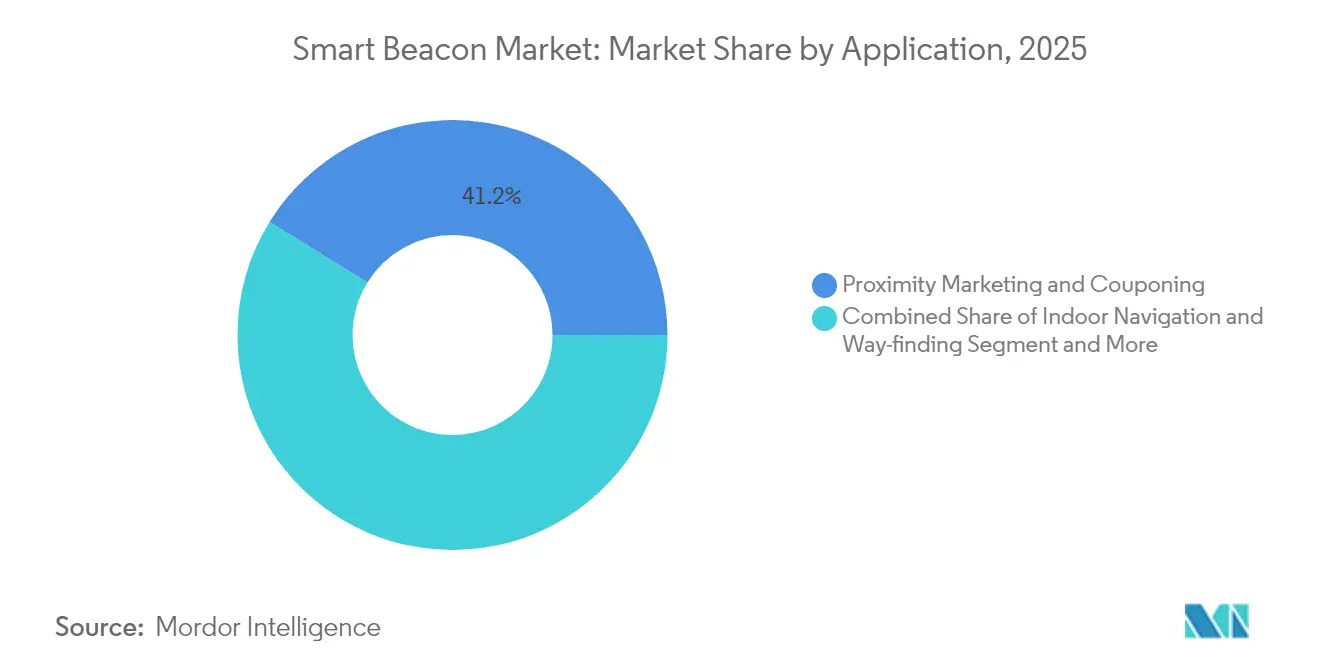
Proximity Marketing and Couponing still delivered 41.20% of 2025 revenue, proving that push notifications remain valuable when paired with loyalty wallets. Yet Asset and Personnel Tracking is growing at 26.44% CAGR, reflecting the operational priority placed on real-time visibility. Zebra Technologies disclosed USD 1.334 billion in Q4 2024 revenue, crediting enterprise mobility and beacon-enabled asset intelligence for its 32.2% top-line growth. The pivot toward tracking aligns with rising labour costs and compliance mandates. Manufacturers embed beacons into work-in-progress trays to orchestrate just-in-time flows; airports track ground-support equipment to shrink turnaround times. Indoor navigation and occupancy sensing round out demand by linking space utilization with energy management. Together, these trends expand the smart beacon market size across both revenue and volume, diluting its reliance on consumer engagement budgets.
By End-User Industry: Healthcare Outpaces Retail Legacy
Retail and Malls held 36.45% of 2025 revenue as proximity-marketing programs matured and omnichannel strategies kept stores relevant. Healthcare Facilities, however, are expanding fastest at 24.68% CAGR because RTLS addresses staffing shortages, infection-control workflows, and regulatory reporting. In 2024, Link Labs quantified a 30% reduction in equipment search time for hospitals adopting beacon RTLS, while Kontakt.io secured USD 47.5 million to accelerate AI-based patient-flow optimization.
Unlike the discretionary nature of consumer promotion cycles, hospital directors integrate beacons into electronic health records and nurse-call systems, embedding them in core clinical operations. Capex decisions, therefore, lean on risk mitigation and patient-safety metrics rather than marketing ROI. This structural demand stabilizes growth, insulating the smart beacon industry from retail downturns and underscoring why healthcare investment has become a bellwether for long-term market health.
Geography Analysis
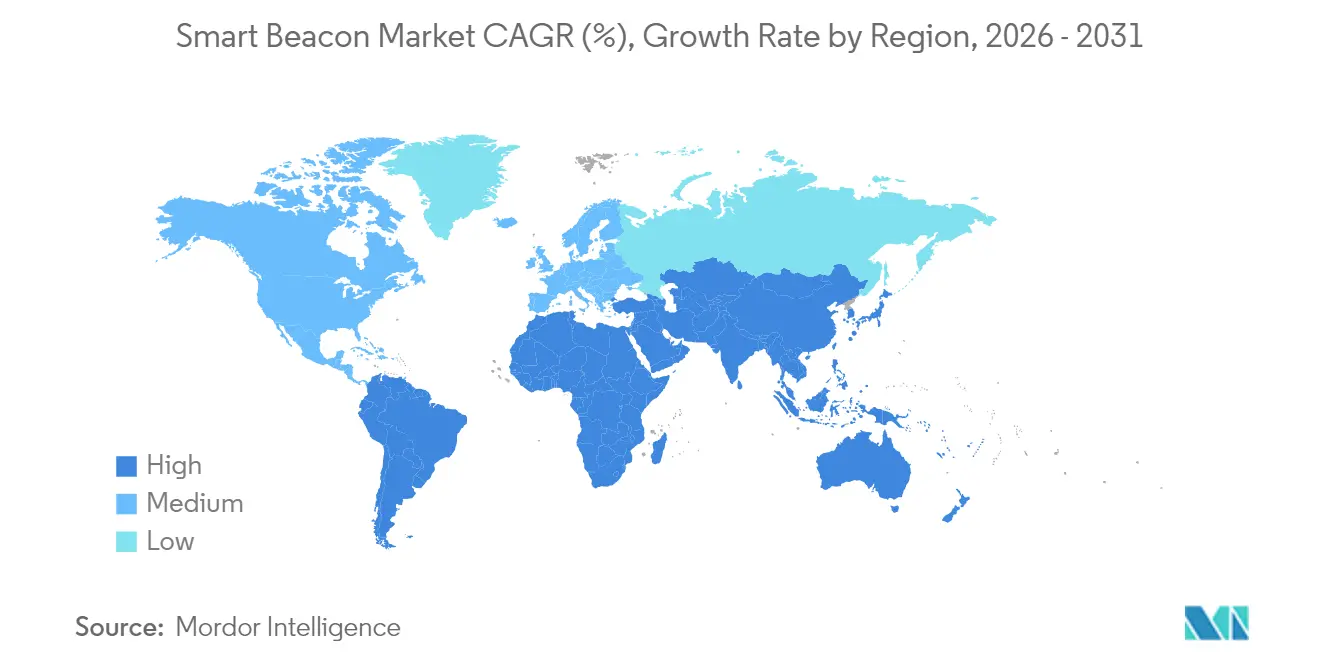
North America captured 33.10% of global revenue in 2025 on the back of early retail rollouts and stringent healthcare compliance that mandates asset location auditing. United States hospitals such as Stanford Health integrate beacons with nurse-call platforms to automate staff-response metrics, while Canadian smart-building retrofits in Toronto and Vancouver leverage beacons to synchronize HVAC and lighting for LEED certifications. Adoption remains steady, though privacy legislation and iOS background-scanning limits may temper growth relative to emerging regions.
Asia-Pacific posts the fastest 24.05% CAGR through 2031. China’s 500-plus smart-city pilots integrate 2.57 billion IoT endpoints that anchor dense beacon meshes for public transit, safety monitoring, and retail analytics. South Korea’s USD 4.6 billion Smart K-Cities initiative and 48 private 5G networks deliver low-latency backbones ideal for centimeter-grade positioning. Japan’s medical MaaS segment, valued at JPY 17.6 billion (USD 117 million) in 2025, exemplifies healthcare-focused demand. Combined, these factors place Asia-Pacific at the forefront of scaling the smart beacon market.
Europe advances on the strength of privacy-compliant smart-building investments. Germany pushes factory digitalization under Industrie 4.0, deploying beacons in intralogistics zones, while the United Kingdom retrofits historical infrastructure with Bluetooth-based visitor guidance tools that respect GDPR. The EU’s Cyber Resilience Act sets a harmonized security baseline that vendors must meet, raising entry thresholds but also building trust in mission-critical deployments. Collectively, these trajectories ensure balanced global contributions while confirming Asia-Pacific as the growth engine.

Regulatory Landscape
Smart beacons are shaped by radio equipment approvals, cybersecurity-by-design requirements for connected devices, and privacy controls implemented through platforms and operating systems. In the European Union, the Radio Equipment Directive (RED) is the core market-access framework, and the delegated cybersecurity requirements under RED Delegated Regulation (EU) 2022/30 became mandatory from August 2025 for in-scope internet-connected radio equipment. This has pushed beacon makers toward secure onboarding, disciplined software updates, and baseline cyber controls aligned with evolving EN 18031-series expectations.
In the United States, deployments continue to rely on FCC Part 15 requirements for unlicensed operation. Bluetooth SIG qualification also remains a practical interoperability gate for BLE-based beacons using iBeacon, Eddystone, and AltBeacon implementations. Rules for safety-oriented beacon use cases add an extra compliance layer beyond general RF conformance. In Spain, the Directorate General of Traffic (DGT) made connected V16 emergency beacons mandatory from January 2026, requiring integrated connectivity (IoT eSIM) designed to operate for at least 12 years without user fees, which increases supplier requirements around reliability, certification, and long-term service provisioning. The United Kingdom also tightened alignment with EU-style device cybersecurity requirements in Northern Ireland through the Radio Equipment (Amendment) (Northern Ireland) Regulations 2025 (S.I. 2025/1244), reinforcing the need for multinational vendors to manage different conformity routes while maintaining consistent security baselines across product lines.
Value Chain Analysis
The smart beacon value chain starts with radio and sensor component inputs, including BLE SoCs, antennas, optional environmental sensors, power management, and, in some designs, energy-harvesting modules. Firmware development then packages the beacon payloads around pseudo-standards such as Apple iBeacon, Google Eddystone, and the open AltBeacon specification. Manufacturing and device provisioning are typically optimized for high-volume, low-power broadcast hardware, using the BLE Broadcaster role and non-connectable advertising packets (for example, ADV_NONCONN_IND), before devices move through hardware OEMs and specialized beacon vendors that bundle tags, gateways, and mounting accessories for retail, healthcare, and logistics environments.
Value is realized downstream through integration layers, including mobile OS receivers, Wi-Fi or BLE-to-IP gateways, and cloud platforms that convert heterogeneous advertisement payloads into location events, alerts, and operational workflows. Platform and deployment partners, such as enterprise mobility providers, system integrators, and RTLS specialists, support site surveys, RF tuning, battery-life policy configuration, and integration into systems like nurse-call, CMMS, WMS, or baggage handling software, turning beacon signals into auditable KPIs. Common bottlenecks show up in interoperability management across multi-estate beacon payload formats, OS and app privacy and permission workflows, and the operational burden of fleet lifecycle management (calibration, firmware updates, and compliance documentation), which increases the importance of centralized device management and gateway orchestration in larger rollouts.
Competitive Landscape
The smart beacon market shows moderate concentration, with no vendor exceeding a 15% global share. Large enterprise-mobility providers bundle beacons inside broader edge-computing platforms, whereas specialists excel in healthcare or industrial niches. Zebra Technologies recorded 11.3% year-over-year revenue growth in Q1 2025 to USD 1.308 billion, aided by its acquisition of Photoneo for enhanced 3D vision that complements beacon-based location data. Kontakt.io employs 153 staff and generates an estimated USD 50.2 million annually, channelling fresh capital toward hospital AI workflows.
Strategic playbooks diverge. Platform integrators—Cisco, Apple, Google—leverage existing device or network footprints to embed beacon services with minimal marginal cost. Vertical specialists prioritize regulatory expertise, as seen in Kontakt.io’s HIPAA-aligned dashboards. Technology differentiators like Wiliot and Atmosic pursue energy harvesting to erase battery maintenance, an innovation that could compress total cost of ownership by double-digit percentages over multiyear horizons. Patent filings around RF energy and privacy-preserving analytics hint that future competitive edges will pivot on sustainability and compliance rather than broadcast range alone.
Mergers are likely as customers demand multi-standard, multi-protocol solutions. Semiconductor shortages and RF-engineering talent gaps create acquisition rationales for firms seeking to internalize scarce capabilities. Nonetheless, the pace of consolidation will remain measured; heterogeneous use cases and region-specific regulations preserve room for specialized entrants, keeping the smart beacon industry dynamic.
Smart Beacon Industry Leaders
Hewlett Packard Enterprise Development LP
Cisco Systems Inc.
Kontakt.io Inc.
HID Global Corporation
Gimbal Inc.
- *Disclaimer: Major Players sorted in no particular order

Market Opportunities and Future Outlook
A key whitespace is in regulated, workflow-heavy environments where location data has to translate into auditable actions rather than marketing impressions. Healthcare is a leading proof point: Kontakt.io has publicly invested in scaling AI-driven hospital operations, supported by its USD 47.5 million Series C (April 2024), and it expanded Staff Safe to cover outdoor hospital areas such as parking lots and garages (July 2025). This signals demand for campus-wide safety and operations coverage that blends indoor beacons with broader infrastructure. The opportunity for vendors is in end-to-end RTLS stacks that combine beacon hardware, gateways, and software that can integrate with existing clinical systems while meeting stricter consent and security requirements.
Standardization and infrastructure convergence also create additional avenues, particularly for hybrid positioning across buildings, campuses, and transport-adjacent environments. ISO/TR 17739-1:2026, published in January 2026 for intelligent transport systems roadside infrastructure-supported location services, points to a more formalized location architecture that can be bridged with indoor beacon telemetry in logistics parks, airports, and smart-city estates. At the same time, the post-August 2025 RED cybersecurity requirements raise the bar for compliant connected devices, creating space for suppliers to package cybersecurity-ready beacons and gateways, and for service providers to handle compliance documentation, secure provisioning, and updates across multi-site deployments. Energy-harvesting and battery-free hardware approaches, already visible through Ambient IoT initiatives (for example, Wiliot and Atmosic), further expand opportunities in item-level tracking and cold-chain monitoring where battery replacement is a structural constraint rather than a cost optimization.
Recent Industry Developments
- June 2026: HID Global updated technical documentation for its BEEKs Asset Beacons and BluFi Bluetooth LE to Wi-Fi gateways. The refresh highlights continued productization of beacon plus gateway stacks that simplify fleet management and IP backhaul for enterprise RTLS deployments. It also supports integrators that standardize on HID tooling for multi-site rollouts where configuration control and documentation discipline are part of customer acceptance.
- July 2025: Kontakt.io expanded its Staff Safe workplace-violence prevention solution to cover outdoor areas across hospital campuses, including parking lots and garages. Extending protection beyond indoor zones broadens the addressable footprint for beacon-enabled safety workflows and increases demand for platform features that unify indoor and outdoor location events. The move reinforces healthcare as a high-priority end-user segment for operational beacon deployments rather than purely proximity marketing.
- August 2024: HID Global acquired Sewio Networks, bringing Ultra-Wideband (UWB) RTLS capabilities into its Identification Technologies portfolio. The acquisition strengthens HID Global's ability to offer higher-precision positioning alongside BLE beacons, particularly for intralogistics and industrial asset management use cases. It also accelerates vendor consolidation around full-stack RTLS offerings that blend tags, anchors, software, and enterprise integration.


Research Methodology Framework and Report Scope
Market Definition and Coverage
This market covers revenue generated from smart beacons and related software and services that enable short-range, location-based interactions and tracking in indoor and near-outdoor settings. Coverage spans commercial and public environments, with all results reported in USD.
Scope exclusions: pure smartphone GPS location services without beacon hardware, and generic Bluetooth chipsets sold without a beacon use case, are excluded from this sizing.
Segmentation Overview
- By Standard Type
- iBeacon
- Eddystone
- AltBeacon
- By Connectivity
- Bluetooth Low Energy (BLE)
- Wi-Fi (802.11mc/FTM)
- Ultra-Wideband Assisted
- By Application
- Proximity Marketing and Couponing
- Indoor Navigation and Way-finding
- Asset and Personnel Tracking
- Occupancy and Environment Monitoring
- By End-User Industry
- Retail and Malls
- Transportation and Logistics
- Aviation and Airports
- Healthcare Facilities
- Sports and Entertainment Venues
- Automotive OEMs
- Smart Construction Sites
- By Geography
- North America
- United States
- Canada
- Mexico
- Europe
- Germany
- United Kingdom
- France
- Rest of Europe
- Asia-Pacific
- China
- Japan
- South Korea
- Australia
- Rest of Asia-Pacific
- South America
- Brazil
- Argentina
- Rest of South America
- Middle East and Africa
- Middle East
- Saudi Arabia
- United Arab Emirates
- Rest of Middle East
- Africa
- South Africa
- Kenya
- Nigeria
- Rest of Africa
- Middle East
- North America
Data Sources, Market Sizing, and Validation
Desk Research
Desk work starts by assembling a clean view of demand signals and shipment direction for proximity and indoor location use cases. We refer to public sources such as FCC equipment authorizations, Bluetooth SIG and IEEE publications on Bluetooth Low Energy and Wi-Fi positioning, and standards documentation for iBeacon and Eddystone behavior.
To anchor adoption rates, we also review government and public datasets that reflect retail footprint and logistics activity, including US Census retail trade series, Eurostat structural business statistics, and selected airport and transit authority traffic reports. Company filings, product datasheets, and investor presentations are used to understand pricing bands, typical deployment sizes, and replacement cycles. Paid access to company financials and patent databases is used selectively to cross-check vendor exposure and track feature intensity over time. The sources named here are illustrative only, and additional public references were also used for data collection, cross-checks, and clarification.
Primary Interviews and Surveys
Primary checks were completed through expert interviews and structured surveys with hardware suppliers, system integrators, software platform teams, and end users running beacon programs in retail, transportation, healthcare, and other facilities. For a global market, we balanced inputs across APAC, EMEA, and the Americas, so assumptions on deployment density, maintenance effort, and average selling price movement could be stress-tested across operating contexts.
Distribution of primary research fieldwork respondents
| Company type | Respondent position | Region |
|---|---|---|
| Top tier: 33% | CXOs: 15% | APAC: 46% |
| Mid tier: 49% | Functional/Unit leaders: 32% | EMEA: 30% |
| Smaller Players: 18% | Managers: 53% | Americas: 24% |
Market-Sizing & Forecasting
Sizing is built using a top-down approach, where the demand pool is reconstructed from likely beacon deployment sites and usage intensity, then translated into annual spending. The model uses indicators such as the number of relevant venues (stores, hospitals, airports, warehouses), typical beacons per site, refresh and battery replacement cycles, and the split between one-time hardware spend and recurring software and service fees.
Once the demand pool is framed, results are corroborated using selective bottom-up approximations, including sampling typical unit prices from public catalogs, checking integration and software price ranges from project quotes shared during interviews, and stress-testing totals against supplier and channel feedback. When direct data is missing for smaller countries or niche end uses, we apply proxy adoption rates from similar markets, then adjust using local facility counts and macro activity. For forecasting, scenario analysis is used with a central case guided by interview consensus, and it is tied to inputs such as indoor navigation adoption, privacy and data handling requirements, and enterprise appetite for location analytics in operations.
Data Validation & Update Cycle
Outputs are validated through multiple passes that compare the model against independent signals, including implied beacon unit demand, venue expansion rates, and observed price direction for BLE and related components. When variances appear, we investigate drivers, and if a large mismatch is identified, we revisit assumptions and re-contact sources to confirm what changed and why.
Before sign-off, the work is reviewed by another analyst to check calculation logic, scope alignment, and currency handling again. Reports are refreshed annually, with interim updates made when material events occur such as regulation shifts, major standard changes, or a step change in enterprise deployments. Right before delivery, a final update pass is performed so clients receive the most current view possible.
Mordor Intelligence's Smart Beacon Market Estimate Compared With Other Published Estimates
Published numbers for smart beacons can vary widely even when they use similar wording, because the counted items and the market-year timing are not always aligned. Differences usually come from what is treated as smart beacon revenue versus broader indoor location spending, and from how hardware plus software is bundled into a single value.
Key gaps are often driven by whether hybrid location stacks (for example Wi-Fi positioning or UWB assisted deployments) are fully counted, how ongoing platform subscriptions are annualized, and whether the study assumes aggressive beacon density per site in retail and public venues. Currency conversion date, the treatment of services in multi-year contracts, and the recency of pricing checks can also create visible spread.
Benchmark comparison
| Source | Market Size | Gaps in Research Methodology |
|---|---|---|
| Mordor Intelligence | USD 5.08 B (2026) | |
| Industry Research House A | USD 4.43 B (2024) | Uses an earlier base year and a broader time horizon, and its segmentation implies some adjacent proximity technologies may be grouped with smart beacons, which can shift the starting value versus a strictly beacon led spend view. |
| Global Advisory B | USD 0.96 B (2025) | Leans more heavily toward hardware only counting and narrower end use coverage, and software and integration revenue can be undercounted when deployments are treated as pilots rather than scaled rollouts. |
The table shows that the spread is mostly explained by what gets counted as recurring revenue and how mixed connectivity deployments are handled. For that reason, the model separates hardware, software, and services, with refresh checks tied to deployment density and pricing, using the approach applied by Mordor Intelligence.


Key Questions Answered in the Report
What is the current size of the smart beacon market?
Revenue is projected to rise at a 20.85% CAGR, reaching USD 13.07 billion by 2031.
Which region is growing the fastest in smart beacon adoption?
Asia-Pacific is forecast to expand at a 24.05% CAGR, outpacing other regions.
Which application is driving the next wave of smart beacon deployments?
Asset and Personnel Tracking is accelerating at a 26.44% CAGR as enterprises prioritize operational efficiency.
Why are energy-harvesting beacons important?
They eliminate battery maintenance, lowering lifetime total cost of ownership and enabling large-scale deployments.
What connectivity options are challenging Bluetooth’s dominance?
Wi-Fi 802.11mc fine-time-measurement is growing at a 28.67% CAGR due to its sub-meter accuracy over existing Wi-Fi infrastructure.
Page last updated on:






