
Market Overview
| Study Period | 2021 - 2031 |
|---|---|
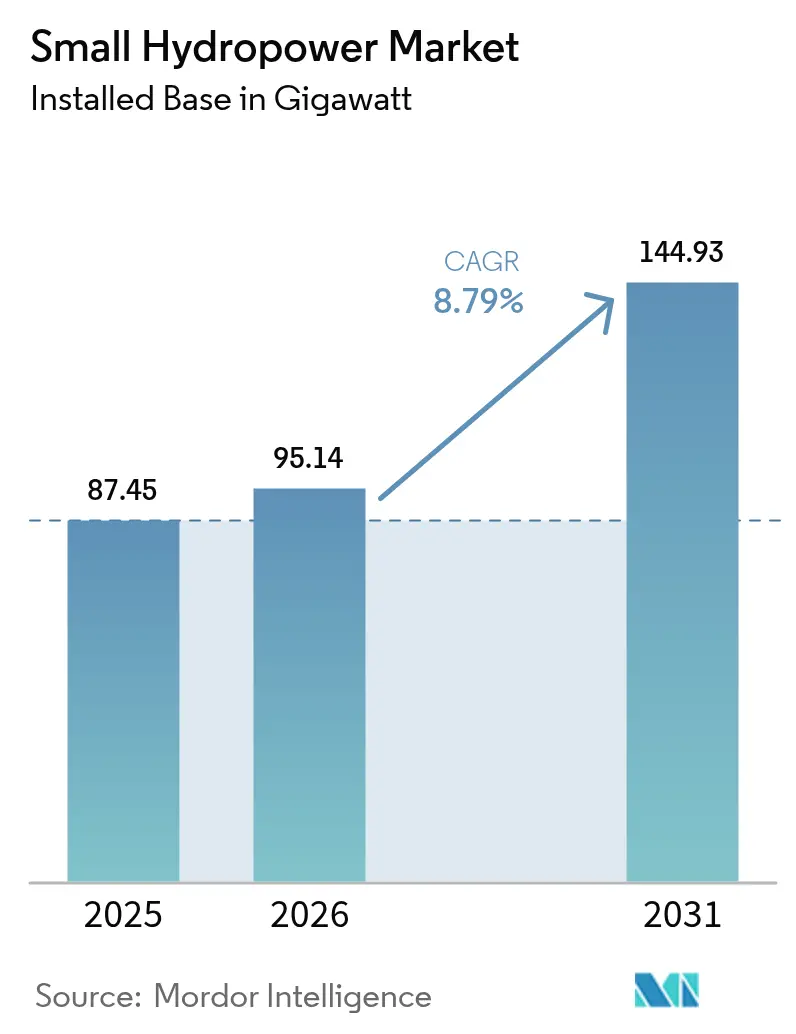
| Market Volume (2026) | 95.14 gigawatt |
| Market Volume (2031) | 144.93 gigawatt |
| Growth Rate (2026 - 2031) | 8.79 % |
| Fastest Growing Market | Middle East and Africa |
| Largest Market | Asia-Pacific |
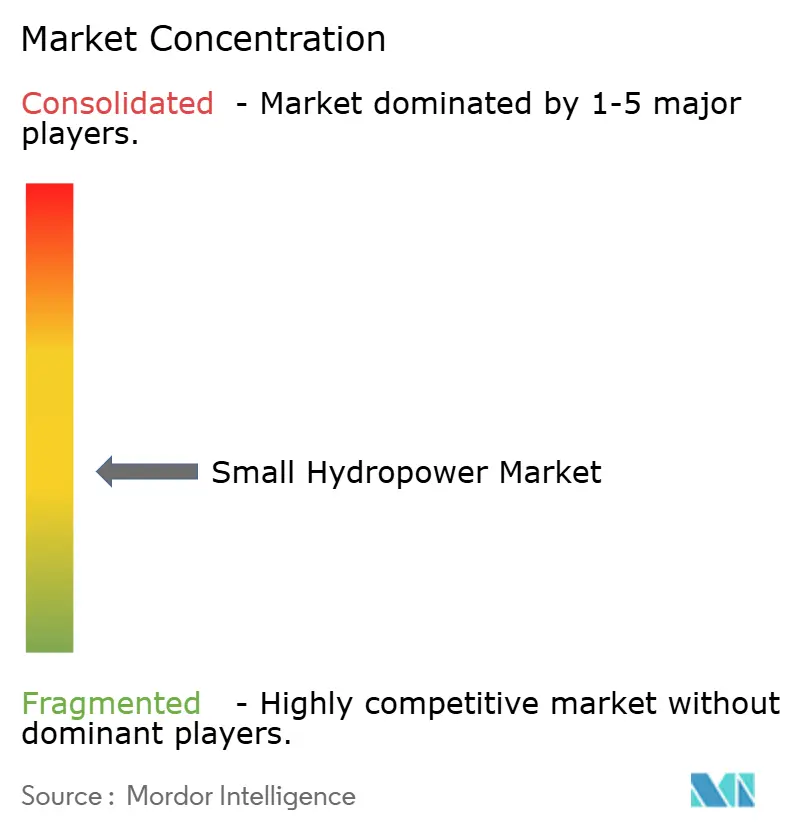
| Market Concentration | Medium |
Major Players *Disclaimer: Major Players sorted in no particular order Image © Mordor Intelligence. Reuse requires attribution under CC BY 4.0. | |
Small Hydropower Market Analysis by Mordor Intelligence
The Small Hydropower Market size was valued at 87.45 gigawatt in 2025 and estimated to grow from 95.14 gigawatt in 2026 to reach 144.93 gigawatt by 2031, at a CAGR of 8.79% during the forecast period (2026-2031).
This expansion stems from the technology’s ability to supply steady baseload power without grid-scale storage, a feature that increasingly appeals to corporate renewable-energy buyers seeking 24/7 clean electricity. Rural electrification programs in emerging economies, especially in Asia-Pacific and Africa, are turning to distributed small hydropower assets to anchor mini-grids where transmission extension is uneconomical. Continuous innovations in fish-friendly turbines have opened previously restricted rivers, accelerating project pipelines in Europe and North America. Meanwhile, digitalization, through IoT sensors and predictive maintenance, lowers operating costs and extends asset life, strengthening the small hydropower market’s competitiveness against falling solar-plus-storage prices.
Key Report Takeaways
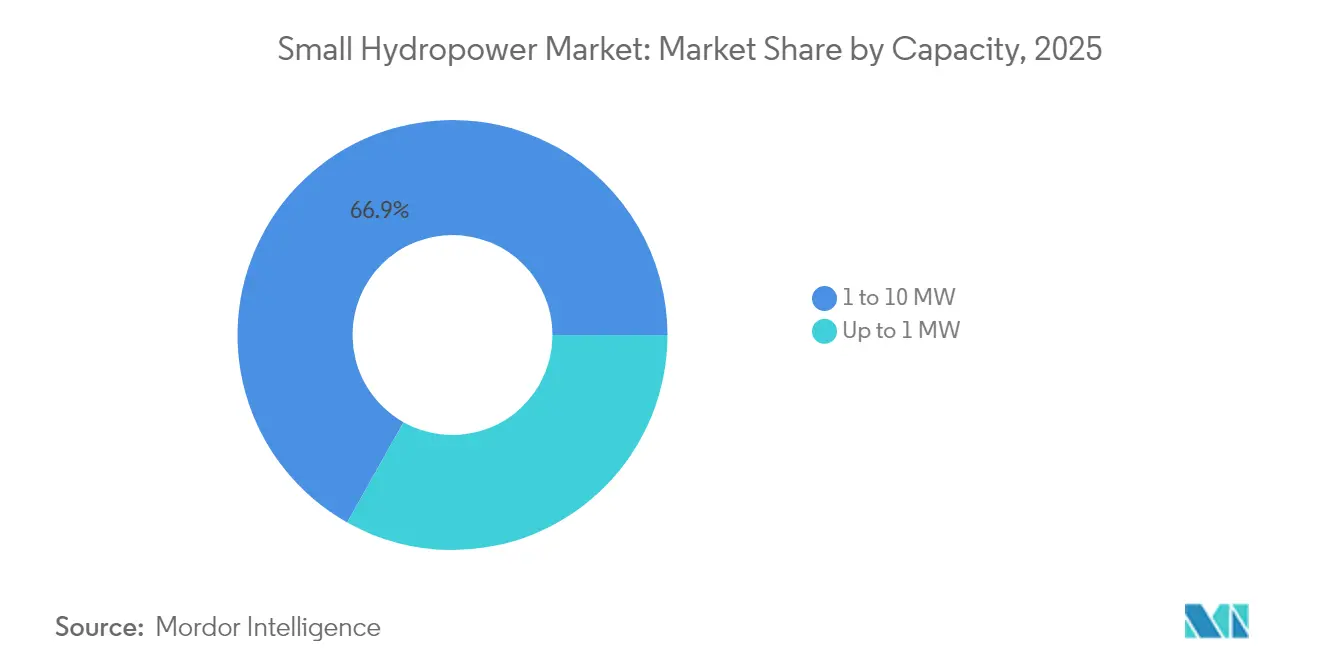
- By capacity, the 1–10 MW segment held 66.85% of the small hydropower market share in 2025, while micro systems up to 1 MW are expanding at a 10.26% CAGR through 2031.
- By technology, run-of-river installations retained 60.35% revenue share in 2025; in-stream and micro-conduit projects record the fastest growth at 10.72% CAGR to 2031.
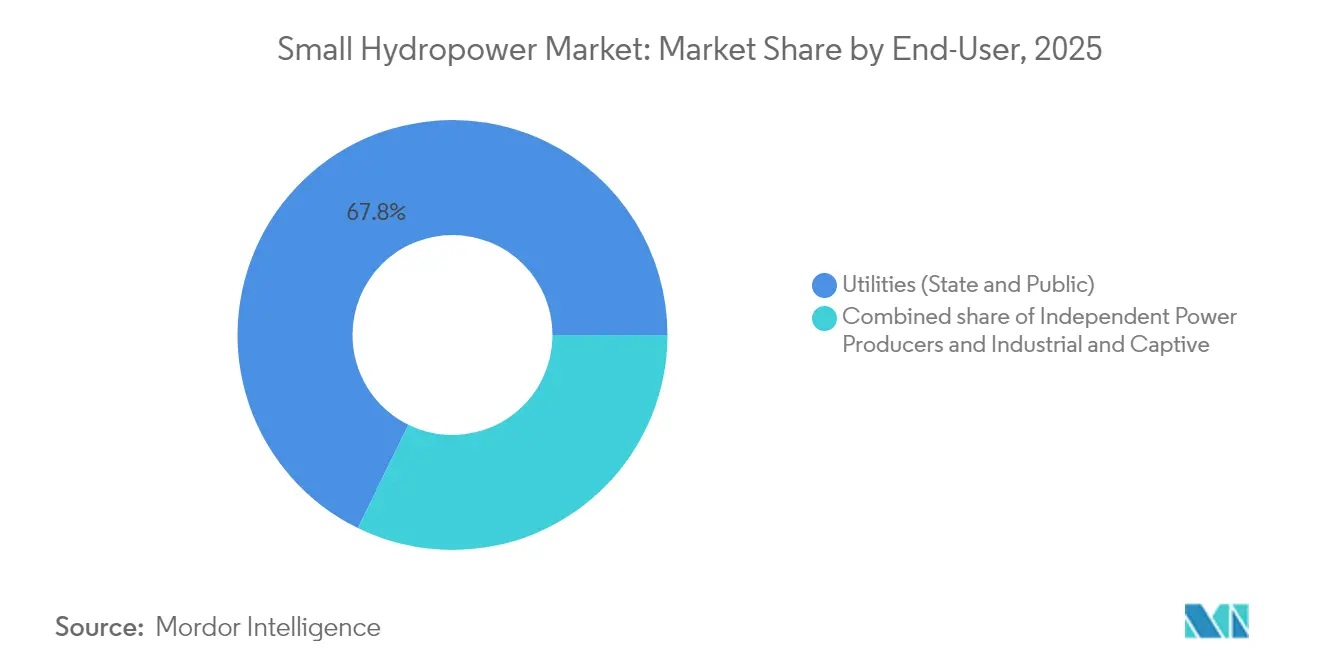
- By end-user, utilities captured 67.75% revenue in 2025; independent power producers show the highest growth momentum at 11.03% CAGR through 2031.
- By geography, Asia-Pacific commanded 63.55% revenue in 2025; the Middle East & Africa leads growth with a 14.31% CAGR toward 2031.
Note: Market size and forecast figures in this report are generated using Mordor Intelligence’s proprietary estimation framework, updated with the latest available data and insights as of 2026.
Market Trends and Insights
Drivers Impact Analysis of Small Hydropower Market*
| Driver | (~) % Impact on CAGR Forecast | Geographic Relevance | Impact Timeline |
|---|---|---|---|
| Surge in demand for clean & sustainable power | 1.20% | Global, with concentration in Europe & North America | Medium term (2-4 years) |
| Rural electrification programmes for off-grid communities | 2.10% | APAC core, spill-over to MEA and South America | Long term (≥ 4 years) |
| Modernisation & repowering of ageing small-hydro assets | 1.80% | Europe & North America, selective APAC markets | Medium term (2-4 years) |
| Fish-friendly micro-turbine innovations unlocking new sites | 1.50% | North America & EU regulatory zones | Short term (≤ 2 years) |
| Water-energy-food nexus projects attracting blended finance | 0.90% | MEA & South America, selective APAC regions | Long term (≥ 4 years) |
| Corporate renewable PPAs seeking baseload renewables | 0.70% | Global, concentrated in developed markets | Medium term (2-4 years) |
| Source: Mordor Intelligence | |||
Surge in Demand for Clean & Sustainable Power
Corporate sustainability mandates now prize around-the-clock renewable procurement, and small hydropower’s baseload profile matches that goal better than wind or solar paired with costly batteries. The International Renewable Energy Agency anticipates corporate-led clean-power contracting to exceed 100 GW annually by 2030, with baseload sources commanding premium contract prices. Utility-scale buyers, including data-center operators, increasingly bundle small hydropower with intermittent renewables to meet internal carbon accounting frameworks. These trends channel investment toward new projects in Europe and North America, where certificate markets allow differentiated pricing. The result reinforces long-term offtake certainty that de-risks financing and accelerates construction starts.
Rural Electrification Programmes for Off-Grid Communities
Government-backed rural-energy programs allocate sizable funding to distributed hydropower mini-grids because steep terrain makes long transmission lines cost-prohibitive. India’s Deen Dayal Upadhyaya Gram Jyoti Yojana earmarked USD 2.5 billion for electrification in 2024, with 15% of new megawatts sourced from small hydropower. Community ownership models ensure tariffs remain affordable and profits stay local, strengthening social acceptance. World Bank initiatives now blend concessional finance with technical assistance to replicate similar approaches across sub-Saharan Africa. As local industry grows around agro-processing and cold storage, demand curves align with steady river-based generation, reinforcing revenue stability for operators.
Modernisation & Repowering of Ageing Small-Hydro Assets
Much of Europe and North America’s installed base dates to the 1980s and now benefits from sensor-driven upgrades that raise output while lowering operations costs.[1]European Commission, “REPowerEU Plan – Hydropower Modernisation Grants,” ec.europa.eu The EU’s REPowerEU fund committed EUR 1.2 billion in 2024 to modernize turbines and automate controls, driving 15-25% capacity uplifts. Norwegian utility Statkraft retrofitted 12 plants by embedding machine-learning algorithms that adjust wicket gates in real time, extending useful life by up to 30 years. By integrating predictive maintenance, owners can curb unscheduled outages and stagger refurbishment capital more efficiently. The repowering wave also supports stricter fish passage standards without sacrificing energy yield.
Fish-Friendly Micro-Turbine Innovations Unlocking New Sites
Certification of three new turbine designs under the U.S. Department of Energy’s HydroWIRES program lowered fish mortality to below 2%, unlocking rivers long barred from hydropower. Manufacturers such as Natel Energy and Siemens Energy now deploy compact runners that deflect aquatic species rather than fragment them, simplifying regulatory approval. Early pilots in Pacific Northwest salmon habitats demonstrate economic feasibility and environmental compliance in tandem. As permitting hurdles shrink, up to 40% more U.S. sites could qualify for low-impact development, expanding the small hydropower market without large civil works. Similar policy shifts in the EU encourage rapid replication across biodiversity-sensitive regions.
Restraints Impact Analysis of Small Hydropower Market*
| Restraint | (~) % Impact on CAGR Forecast | Geographic Relevance | Impact Timeline |
|---|---|---|---|
| Climate-driven flow variability & unstable output | -1.40% | Global, acute in drought-prone regions | Long term (≥ 4 years) |
| Lengthy, uncertain environmental-permitting cycles | -0.90% | North America & EU regulatory zones | Medium term (2-4 years) |
| Falling solar-plus-storage LCOE compressing hydro IRRs | -0.70% | Global, concentrated in high-solar regions | Short term (≤ 2 years) |
| Siltation & sedimentation raising O&M costs | -0.50% | APAC & South America, selective global sites | Long term (≥ 4 years) |
| Source: Mordor Intelligence | |||
Climate-Driven Flow Variability & Unstable Output
Intensifying droughts reduce river discharge and erode capacity factors, undercutting the dependable-power narrative that originally justified many projects. The IPCC expects flow variability to rise 20-30% by 2030. In 2024, average capacity factors in southern Europe fell 8%, forcing generators to buy balancing power on spot markets. Hybridization with solar offers a partial hedge but inflates capital budgets by 10-15%. Without dedicated climate-resilience finance, smaller developers could struggle to absorb higher insurance premiums and debt-service cushions required by lenders.
Lengthy, Uncertain Environmental-Permitting Cycles
Multi-agency oversight extends licensing to an average of 4.2 years in the United States, with environmental studies accounting for 60% of that period.[2]Federal Energy Regulatory Commission, “2024 Hydropower Licensing Timeframes,” ferc.gov Europe’s patchwork of fish-passage standards compounds complexity: developers must tailor designs across borders, driving engineering costs higher. Financing charges accumulate during these delays, raising all-in project costs by up to one-third. Only a handful of jurisdictions fast-track truly low-impact installations; elsewhere, lengthy reviews remain standard practice, limiting deployment speed even where economics are favorable.
*Our forecasts treat driver/restraint impacts as directional, not additive. The impact forecasts reflect baseline growth, mix effects, and variable interactions.
Small Hydropower Market Segment Analysis
By Capacity:
Mid-Scale Dominates, Micro Momentum AcceleratesThe 1–10 MW tier continues to anchor the small hydropower market, holding 66.85% revenue in 2025 thanks to proven utility business models and bankable levelized costs of USD 0.05–0.08 per kWh. Asset developers favor this bracket because equipment vendors offer standardized packages and lenders perceive lower execution risk. With many rivers already assessed for such projects, brownfield upgrades further solidify the segment’s revenue base through repowering.
Micro units under 1 MW, however, expand at a brisk 10.26% CAGR through 2031, reflecting streamlined permitting pathways and innovative funding such as community cooperatives. Certification of sub-2% fish-mortality turbines mitigates biodiversity objections that once sidelined small creeks. For remote villages in India or mountainous areas in Peru, ownership stakes keep cash flows local, improving tariff recovery and social license. These attributes ensure the micro tier remains the principal growth engine within the small hydropower market.


By Technology:
Run-of-River Reigns, In-Stream and Conduit Gain ShareRun-of-river schemes account for 60.35% of 2025 revenue owing to favorable environmental profiles and the absence of large reservoirs. Financiers value predictable output matched to natural hydrology without major civil works. Automation upgrades, such as real-time gate control, optimize spill and maximize dispatched energy, reinforcing the technology’s leadership.
In-stream and micro-conduit devices register 10.72% CAGR, leveraging existing canals and water-supply networks to circumvent land-acquisition battles. Modern designs slide into irrigation channels or city pipelines, using excess head to produce distributed power without altering flow regimes. Municipal utilities in France and Morocco adopt these solutions to monetize water infrastructure, confirming rapid commercial acceptance. Collectively, such systems erode run-of-river dominance while diversifying the small hydropower market’s technology mix.
By End-User:
Utility Hegemony Tested by Independent Power ProducersUtilities retained 67.75% revenue in 2025 as regulators often mandate them to extend service to rural areas that private players deem uneconomic. Access to concessional capital and integrated grid control further cements their position, ensuring priority dispatch and simplified interconnection approvals.
Independent power producers, however, compound capacity at 11.03% CAGR, spurred by deregulated markets and corporate power-purchase agreements that reward firm renewable output. Community-backed IPPs in Kenya and Chile combine equity crowdfunding with multilateral guarantees, closing finance faster than many utilities. As carbon-accounting rules tighten, corporate offtakers lock in multidecade contracts, reinforcing IPP project pipelines and challenging utility hegemony in the small hydropower market.
Geography Analysis
APAC Small Hydropower Market
Asia-Pacific dominated with 63.55% revenue in 2025, led by China’s USD 8.5 billion commitment to add 15 GW by 2030 and India’s expedited permitting for sub-5 MW projects. Upgrades in Japan, 15 sites retrofitted by Tokyo Electric Power, demonstrate a mature yet evolving landscape, where digitalization raises output without fresh ecological footprints. Indonesia and the Philippines rely on small hydropower anchor plants to energize island mini-grids, translating resource endowment into inclusive growth.
MEA Small Hydropower Market
The Middle East & Africa is the fastest-growing region at 14.31% CAGR toward 2031, buoyed by Morocco’s eight-plant rollout totaling 45 MW and Kenya’s rural-electrification partnerships that served 50,000 residents in 2024. Uganda streamlines approvals for under-5 MW projects, slashing regulatory timelines 40%. In the Democratic Republic of Congo, Chinese finance underwrites schemes that power mineral processing while expanding access for off-grid villages. These initiatives validate the water-energy-food nexus model that integrates irrigation, electricity, and local value addition.
Europe and the Americas Small Hydropower Market
Europe and North America concentrate on repowering and environmental compliance. The EU’s EUR 1.2 billion REPowerEU fund targets efficiency gains and fish-passage retrofits, while Norway’s Statkraft achieves 20% capacity boosts on 12 plants through machine-learning optimization. In the United States, FERC certified three fish-friendly turbines in 2024, enabling projects once barred by salmon-protection rules. South America centers on Brazil and Chile, leveraging robust hydrology to extend grids into remote agrarian zones, proving that modernization and greenfield builds can coexist.
Regulatory Landscape
Policy support and environmental compliance continue to influence project bankability and timelines for small hydropower, particularly in jurisdictions that apply stringent aquatic-biodiversity requirements and multi-agency reviews. In the United States, licensing complexity remains a key constraint, with an average hydropower licensing timeline of 4.2 years reported by the Federal Energy Regulatory Commission (FERC) in 2024, which keeps developer attention focused on low-impact designs and refurbishment of existing sites.
In India, the support framework tightened into a clearer national program during 2026. The Union Cabinet approved the Small Hydro Power (SHP) Development Scheme in March 2026 with an outlay of INR 25.85 billion for FY 2026-27 to FY 2030-31, targeting 1,500 MW of new SHP capacity in the 1-25 MW range, and the Ministry of New and Renewable Energy (MNRE) issued administrative approval and operational guidelines in May 2026. Central Financial Assistance caps vary by region, with higher support for North-Eastern States and international border districts. The Solar Energy Corporation of India (SECI) was designated as the National Programme Implementing Agency, which formalizes the appraisal and monitoring pathway for eligible projects and reduces execution ambiguity.
Competitive Landscape
Competition remains moderate, with legacy turbine makers, Voith, Andritz, GE Renewable Energy, Siemens Energy, sharing space with disruptors such as Natel Energy and Turbulent NV. Market leaders deploy IoT-enabled condition monitoring to cut downtime and use predictive analytics to defer major overhauls by fine-tuning operating parameters. Fish-friendly design expertise is now a key differentiator because regulatory acceptance increasingly hinges on aquatic-biodiversity performance. This pivot has led to Andritz’s 2024 purchase of Canyon Hydro for USD 85 million, adding low-head specialization and a North American foothold.
Larger firms pursue bolt-on acquisitions to enter the micro-conduit niche, reflecting the segment’s double-digit growth rate. Partnerships are likewise gaining traction: GE’s venture with Bharat Heavy Electricals aligns foreign technology with local fabrication, reducing cost and shortening lead time for South Asian developers. Price pressure from solar-plus-storage, whose LCOE continues to fall, forces turbine vendors to emphasize life-cycle value rather than headline capex. Consequently, service-based contracts that guarantee output and share performance risk are proliferating, tightening the bond between OEMs and asset owners within the small hydropower industry.
Small Hydropower Industry Leaders
Andritz AG
Voith GmbH & Co. KGaA
Siemens Energy AG
Toshiba Energy Systems & Solutions Corp.
GE Vernova, Inc
- *Disclaimer: Major Players sorted in no particular order
Small Hydropower Market Companies Covered in this Report
- Voith GmbH & Co. KGaA
- Andritz AG
- GE Vernova, Inc.
- Siemens Energy AG
- Toshiba Energy Systems & Solutions Corp.
- PJSC RusHydro
- Statkraft AS
- Gilbert Gilkes & Gordon Ltd.
- FLOVEL Energy Pvt Ltd.
- Natel Energy Inc.
- Mavel a.s.
- Bharat Heavy Electricals Ltd. (BHEL)
- SNC-Lavalin Group Inc. (AtkinsRéalis)
- CKD Blansko Holding
- Canyon Hydro
- American Hydro Corp.
- Litostroj Power
- Turbulent NV
- Blueline Manufacturing
- Voith Hydro Italy

Market Opportunities and Future Outlook
Near-term opportunity is concentrated in policy-anchored buildouts in hilly and remote electrification geographies, where small hydropower can act as a mini-grid anchor and reduce dependence on long transmission extensions. India offers a clear investment runway through the 2026-2031 MNRE SHP Development Scheme (INR 25.85 billion outlay, 1,500 MW target). The stated resource base of 21,133.61 MW across 7,133 sites, with about 24.5% harnessed as of early 2026, also leaves room for developers and OEMs across turbine-generator packages, balance-of-plant, and controls.
A second opportunity lies in repowering and incremental uprates, supported by project activity across multiple markets and by owner preference for lower civil-works risk. In Nepal, the Bagmati small hydropower project moved into test production after a 10 MW expansion to 32 MW (March 2026), illustrating how brownfield optimization matters where hydrology and interconnection already exist. In Europe, commissioning and tender activity, including Koncar’s 1.5 MW Otocac project in Croatia (March 2026) and tenders tied to EPCG’s Otilovici (3.2 MW, Montenegro), indicate continued demand for standardized equipment and faster installation methods. It also points to lifecycle services, as operators increasingly emphasize automation and condition monitoring to protect performance under hydrological volatility.
Recent Industry Developments in Small Hydropower Market
- July 2026: ANDRITZ announced modernization contracts for existing hydro assets in multiple markets, including turbine-generator unit upgrades at the McCormick hydropower plant in Baie-Comeau, Quebec, for Societe en Commandite Hydroelectrique Manicouagan (SCHM). The work reflects a shift toward refurbishment-driven capacity and efficiency gains, and it highlights service and modernization backlogs as a recurring revenue stream for OEMs.
- June 2025: The World Bank approved a USD 150 million concessional credit to support Uzbekistan’s small hydropower sector with an implementation approach that includes private sector participation. The financing structure improves project bankability for local developers and banks while expanding a pipeline tied to grid-strengthening objectives.
- December 2024: Bhutan’s Department of Hydropower and Power Systems (DHyE) awarded civil works contracts for phase two of four small hydropower projects totaling 195 MW (Jomori, Gamri-I, Druk Bindu I and II, and Begana) with a total budget of Nu 20 billion. The awards move near-term construction forward and signal continued government-led capacity additions that support equipment demand and EPC participation.


Small Hydropower Market Report Scope and Research Methodology
Market Definition and Coverage
For this methodology, the market covers installed small hydropower capacity globally, where a plant is treated as small when nameplate capacity is below 10 MW, and totals are expressed in gigawatts (GW).
The scope excludes large hydropower (above 10 MW) and pumped storage projects from the market totals.
Segments Covered in This Report
- By Capacity
- Up to 1 MW
- 1 to 10 MW
- By Technology
- Reservoir-Based
- Run-of-River
- Pumped-Storage
- In-Stream and Micro-conduit
- By Component (Qualitative Analysis only)
- Turbines
- Generators
- Control and Automation
- Balance-of-Plant
- By End-User
- Utilities (State & Public)
- Independent Power Producers
- Industrial and Captive
- By Geography
- North America
- United States
- Canada
- Mexico
- Europe
- France
- Italy
- Spain
- Norway
- Turkey
- Russia
- Rest of Europe
- Asia-Pacific
- China
- India
- Japan
- South Korea
- Indonesia
- Philippines
- Tajikistan
- Australia and New Zealand
- Rest of Asia-Pacific
- South America
- Brazil
- Chile
- Colombia
- Honduras
- Rest of South America
- Middle East and Africa
- South Africa
- Uganda
- Morocco
- Kenya
- Democratic Republic of the Congo
- Rest of Middle East and Africa
- North America
Data Sources, Market Sizing, and Validation
Desk Research
Desk work was used to build the factual base around small hydropower capacity, additions, and the project pipeline, and then to set practical checks for the model. Public sources such as IRENA capacity statistics, the IEA electricity and renewables trackers, World Bank data, and UNIDO publications helped align the definition boundary and the high-level installed base direction.
We also reviewed sources like national energy agencies and grid operators for policy targets, auction outcomes, and commissioning timelines, then followed up with company annual reports, investor presentations, and reputable press for project announcements and refurbishment activity. When needed, we used paid subscriptions focused on company financials and intelligence, and a patent database subscription, to sense-check investment focus and technology activity. The desk sources listed above are illustrative, and other public and paid references were used for data collection, validation, and clarification during the study.
Primary Interviews and Surveys
Primary work focused on interviews and structured surveys with developers, EPC and component suppliers, utilities, investors, and regulatory and planning experts, so that assumptions on build rates and retrofit cycles could be verified. Coverage was balanced across APAC, EMEA, and the Americas, since permitting steps, grid connection lead times, and incentive designs can shift yearly additions and replacement demand in a measurable way.
Distribution of primary research fieldwork respondents
| Company type | Respondent position | Region |
|---|---|---|
| Top tier: 39% | CXOs: 12% | APAC: 43% |
| Mid tier: 43% | Functional/Unit leaders: 28% | EMEA: 32% |
| Smaller Players: 18% | Managers: 60% | Americas: 25% |
Market-Sizing & Forecasting
Sizing starts with a top-down build where national and regional capacity series, commissioning news, and known pipeline visibility are used to reconstruct the installed base and annual additions for small hydropower under 10 MW. Once that backbone is set, we corroborate it with selective bottom-up approximations such as sampled project counts by capacity band, typical MW per site for run-of-river and small reservoir setups, and channel checks on delivery timing. These inputs are then used to adjust totals where gaps appear.
Key model inputs include the installed base by country, expected annual MW additions, refurbishment and upgrade cycles for aging plants, permitting and grid connection lead times, and policy signals like feed-in tariffs and auction allocations where they exist. For the forecast, scenario analysis was used because additions can jump when permitting clears or financing conditions change. The scenarios were tuned using expert views on pipeline conversion rates and likely delay patterns. Where bottom-up visibility was weak, we used conservative conversion assumptions and then re-checked the outcome against independent capacity signals before finalizing.
Data Validation & Update Cycle
Outputs are validated through several checks so that the final totals track real world capacity signals rather than relying on a single input series. We compare results against independent indicators such as regional installed capacity totals, publicly announced commissioning schedules, and the implied annual build rate versus recent history. Any outliers are reviewed and corrected.
Before sign-off, the model and assumptions go through multi-step internal reviews, and respondents are re-contacted when a large variance is found for a key country or capacity band. Reports are refreshed annually, with interim updates when material policy shifts, project delays, or commissioning waves change the outlook, and a final pre-delivery pass is completed so clients receive the latest view.
Mordor Intelligence's Small Hydropower Market Sizing Compared With Other Published Estimates
Published estimates for small hydropower often differ because the market can be expressed in capacity (GW) or revenue (USD), and because some studies combine small hydro with adjacent hydro assets that do not share the same demand drivers. Differences also come from how refurbishments are treated, how project pipelines are converted into additions, and how frequently assumptions get refreshed when policy and permitting changes occur.
By tracking installed capacity additions and refurbishment driven upgrades, Mordor Intelligence keeps the 2025 market size tied to GW under 10 MW and avoids mixing in broader hydro revenue pools, which is a common reason totals spread apart.
Benchmark comparison
| Source | Market Size | Gaps in Research Methodology |
|---|---|---|
| Mordor Intelligence | USD 87.45 B (2025) | |
| Industry Report Aggregator A | USD 15.22 B (2025) | This estimate is presented as revenue, and the scope and conversion logic from capacity to dollars are not clearly stated, which can undercount project and refurbishment activity that is visible in capacity series. |
| Market Portal B | USD 2.40 B (2025) | The number appears to reflect a narrow definition of small hydro and a limited spend boundary, with minimal transparency on whether EPC, equipment, and upgrade spending are included, thereby compressing the total versus capacity-based sizing. |
The table indicates that the widest gaps come from mixing units and from unclear boundaries, especially when revenue is reported without a traceable capacity-to-value bridge. A consistent definition under 10 MW, clear treatment of refurbishments, and repeatable checks against installed base and additions help keep the estimate stable and explainable year to year.


Key Questions Answered in the Report
What is the projected installed capacity for small hydropower by 2031?
Global capacity is forecast to reach 144.93 GW, up from 95.14 GW in 2026.
How fast is small hydropower capacity expected to grow annually?
The sector is advancing at an 8.79% CAGR through 2031, reflecting sustained policy and corporate demand for 24/7 clean power.
Which region leads in small hydropower deployment currently?
Asia-Pacific holds 63.55% of worldwide installed capacity, driven by programs in China and India that prioritize rural electrification.
Why are fish-friendly turbines important for small hydropower projects?
Turbines that cut fish mortality to below 2% unlock previously restricted river sites and help projects clear stringent environmental reviews faster.
What role does small hydropower play in corporate renewable-energy procurement?
Its steady baseload output lets companies pair it with intermittent solar and wind to meet 24/7 carbon-free power targets without large battery systems.
Who are some leading companies modernizing small hydropower plants?
Voith, Andritz, GE Vernova, Siemens Energy, and Statkraft are investing in IoT monitoring, predictive maintenance, and fish-friendly upgrades to boost efficiency and extend asset life.
Page last updated on:


 Your data is secure and never sold or shared.


