
Market Overview
| Study Period | 2020 - 2031 |
|---|---|
| Forecast Data Period | 2026 - 2031 |
| Base Year Market Size (2025) | USD 1.07 Billion |
| Market Size (2026) | USD 1.16 Billion |
| Market Size (2031) | USD 1.7 Billion |
| Growth Rate (2026 - 2031) | 8.01 % |
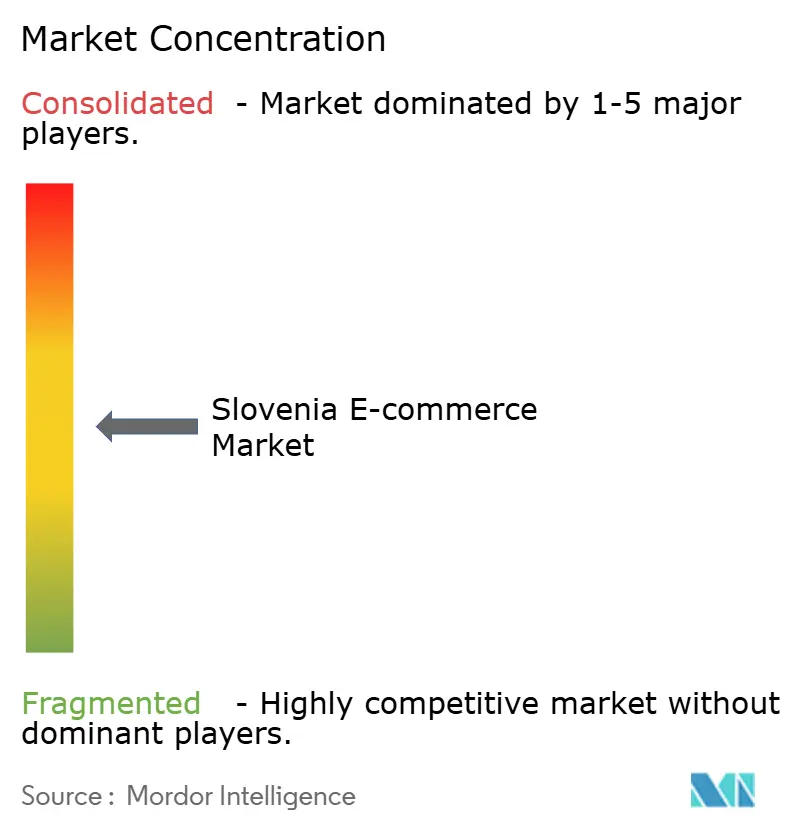
| Market Concentration | Medium |
Major Players *Disclaimer: Major Players sorted in no particular order Image © Mordor Intelligence. Reuse requires attribution under CC BY 4.0. | |
Slovenia E-commerce Market Analysis by Mordor Intelligence
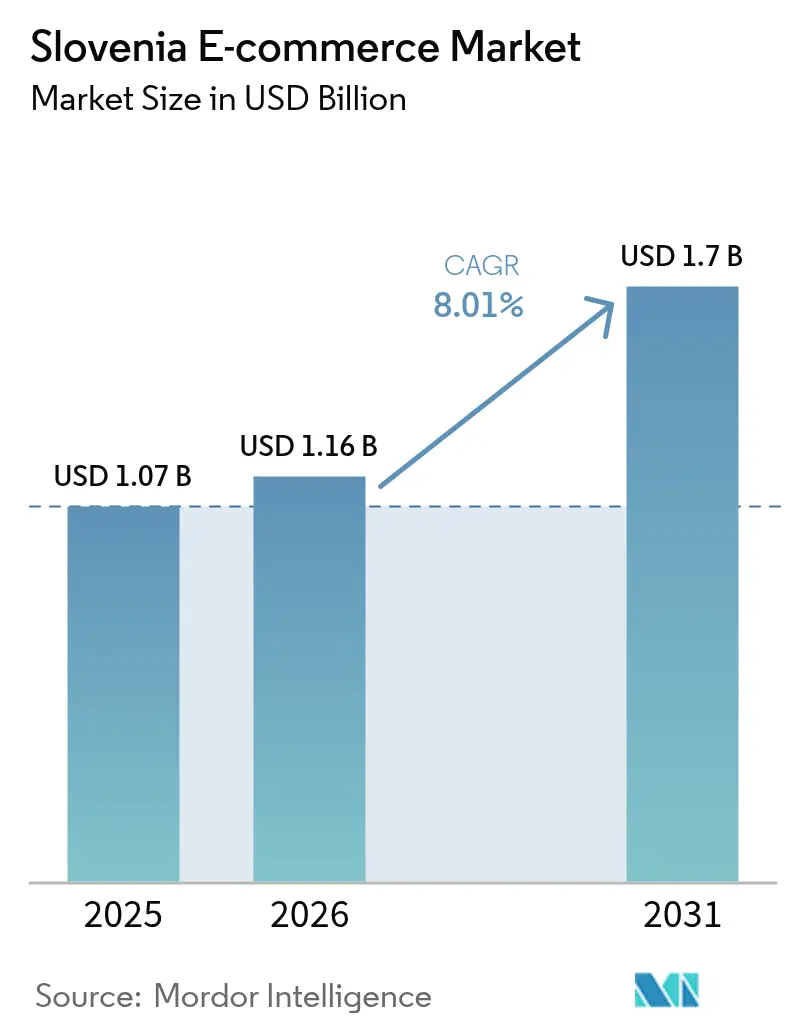
The Slovenia e-commerce market size was valued at USD 1.07 billion in 2025 and estimated to grow from USD 1.16 billion in 2026 to reach USD 1.7 billion by 2031, at a CAGR of 8.01% during the forecast period (2026-2031). Faster broadband roll-outs, a 90% internet-user base among residents aged 16–74, and rising disposable incomes are driving the momentum. Mobile devices now originate more than 75% of site visits, prompting merchants to rebuild digital journeys around thumb-friendly interfaces and single-click payments. Domestic platforms still capture 77% of transactions, yet cross-border orders are climbing as EU Digital Single Market rules trim delivery frictions. Competitive intensity is escalating as global giants such as Amazon and AliExpress enter a landscape already contested by regional firms like About You and local leader Mimovrste. On the operations side, partnerships such as Pošta Slovenije–China Post are turning logistics sophistication into a key source of advantage. Although thin warehousing capacity and rural cash-on-delivery habits curb margins, EU-funded gigabit projects are laying the infrastructure for long-term growth in the Slovenia e-commerce market.[1]
Key Report Takeaways
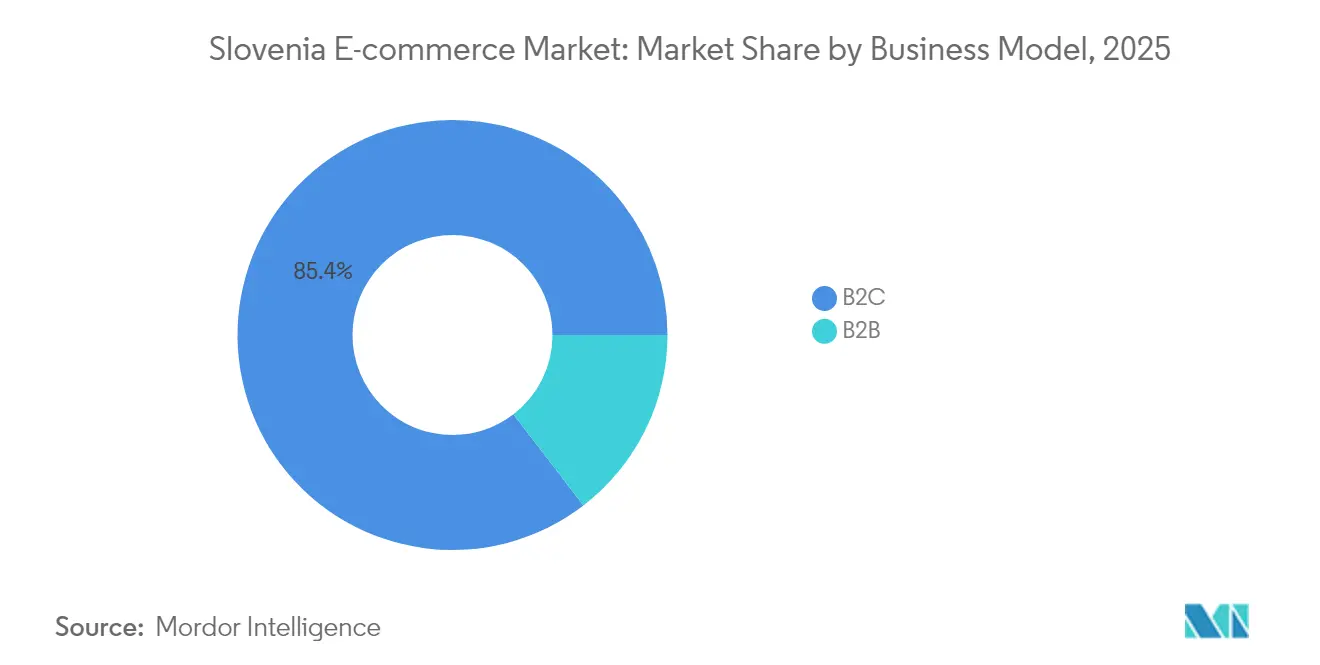
- By business model, the B2C segment commanded 85.42% revenue share in 2025, while B2B is projected to expand at a 9.54% CAGR through 2031.
- By device type, mobile commerce captured 74.88% of the Slovenia e-commerce market share in 2025 and is advancing at a 9.18% CAGR through 2031.
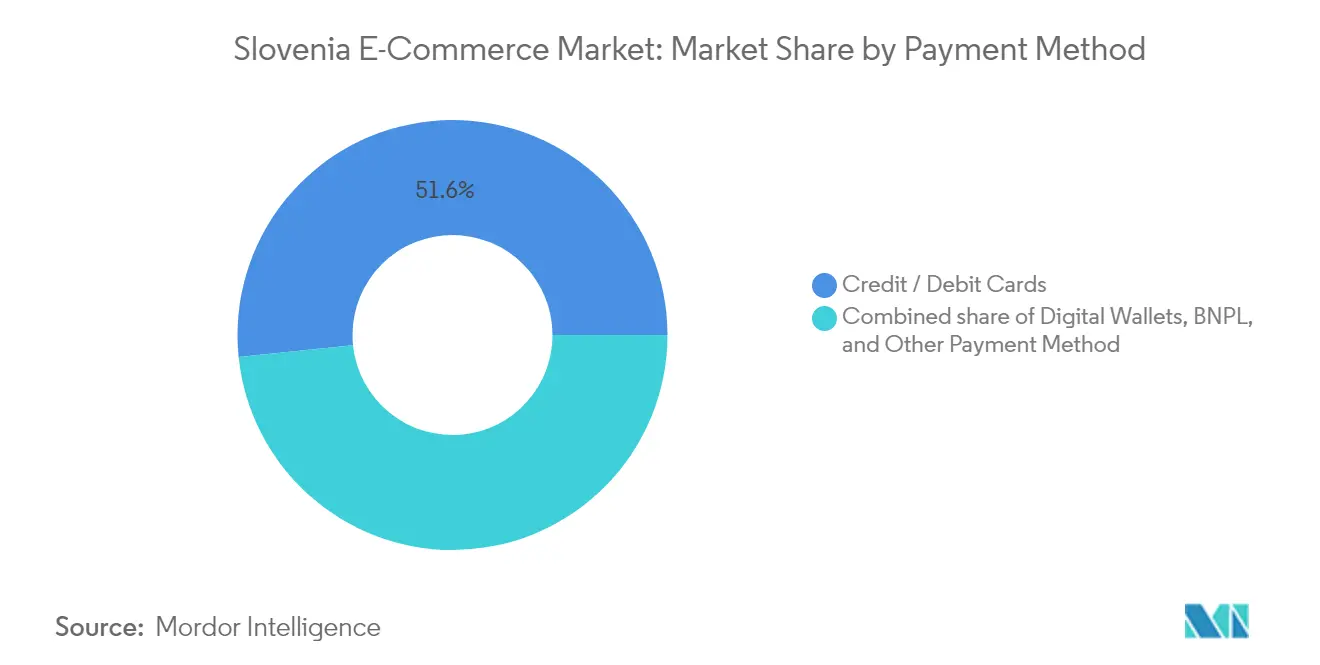
- By payment method, credit/debit cards led with 51.63% share in 2025; digital wallets exhibit the fastest trajectory at 10.39% CAGR to 2031.
- By product category, fashion & apparel secured 28.74% of 2025 revenue, whereas food & beverages is forecast to post a 12.22% CAGR up to 2031.
Note: Market size and forecast figures in this report are generated using Mordor Intelligence’s proprietary estimation framework, updated with the latest available data and insights as of 2026.
Market Trends and Insights
Drivers Impact Analysis of Slovenia E-commerce Market*
| Driver | (~) % Impact on CAGR Forecast | Geographic Relevance | Impact Timeline |
|---|---|---|---|
| Accelerated rollout of same-day delivery networks concentrated around Ljubljana | +1.8% | Urban centers, primarily Ljubljana with expansion to Maribor and Celje | Medium term (2-4 years) |
| Surge in mobile-only shoppers among Gen-Z & Millennial cohorts (≥70% of online traffic) | +2.1% | National, with higher concentration in urban areas | Short term (≤ 2 years) |
| Government-subsidised digital vouchers for SMEs adopting e-commerce platforms | +1.2% | National, with emphasis on less developed regions | Medium term (2-4 years) |
| Rapid penetration of BNPL (Buy-Now-Pay-Later) solutions led by Klarna & Leanpay | +1.5% | National, with higher adoption in urban centers | Short term (≤ 2 years) |
| Growth of cross-border shopping via EU Digital Single Market logistics corridors | +0.9% | National, with concentration along major transportation routes | Medium term (2-4 years) |
| EU cohesion-fund grants upgrading broadband to >1 Gbps in rural Slovenia | +0.6% | Rural regions, particularly in Alpine and eastern areas | Long term (≥ 4 years) |
| Source: Mordor Intelligence | |||
Accelerated rollout of same-day delivery networks
Same-day delivery is redefining service benchmarks in the Slovenia e-commerce market. Micro-fulfilment hubs positioned around Ljubljana shrink delivery windows below three hours, nudging consumers toward higher purchase frequency and bigger baskets. Logistics specialists are replicating the model in Maribor and Celje, widening the service footprint to roughly half the population. The April 2024 Pošta Slovenije–China Post alliance boosts cross-border parcel velocity, enabling Chinese sellers to treat Slovenia as a Central-European gateway. Retailers respond by integrating inventory visibility across stores and dark warehouses, reducing stock-outs and raising conversion rates. As service expectations climb, smaller merchants are outsourcing fulfilment to third-party logistics providers to stay competitive in the Slovenia e-commerce market.
Surge in mobile-only shoppers
Mobile screens now dominate the Slovenia e-commerce market, with 75.43% of traffic arriving via smartphones in 2024. Gen-Z and Millennials drive this shift, bypassing desktops altogether and elevating swipe-able interfaces as table stakes. Conversion funnels increasingly leverage biometric log-ins and digital wallets, trimming checkout steps to a few seconds. Retailers optimize search results for vertical scrolling patterns and embed shoppable videos to capture short attention spans. Mobile-driven demand concentrates order peaks in evening hours, prompting adaptive staffing in fulfilment centers. This behavioral sea change is pressuring legacy merchants to migrate from responsive sites to progressive web apps that mimic native-app speed without the download hurdle, preserving share in the Slovenia e-commerce market.
Government-subsidised digital vouchers
Digital vouchers worth EUR 1,000–9,999 (USD 1,083–10,815) co-finance website launches, cybersecurity upgrades, and marketing campaigns for SMEs. By lowering upfront technology outlays, the program has enrolled micro-enterprises in remote regions that previously lacked online channels. Voucher recipients must shoulder 40% of project costs, ensuring skin in the game while accelerating digital skills. Early beneficiaries report revenue lifts of 12–15% within one year, according to ministry monitoring. Platform vendors partner with local chambers of commerce to pre-package compliant SaaS storefront bundles, shortening deployment cycles to weeks. The subsidy pipeline consequently enlarges the addressable merchant base and injects fresh inventory into the Slovenia e-commerce market.[2]
Rapid penetration of BNPL solutions
Klarna and home-grown Leanpay push flexible instalments to the mainstream, lifting conversion on higher-ticket items such as consumer electronics by double digits. BNPL apps increasingly double as discovery channels, recommending curated catalogues and steering demand toward partner merchants. Credit-risk algorithms that tap open-banking data enable near-instant approvals, marginalising traditional revolving credit cards. However, rising BNPL penetration raises regulatory oversight on responsible lending, compelling providers to invest in transparency dashboards and repayment-reminder tooling. Merchants welcome the uplift in average order value but face higher interchange fees, which they offset through pricing levers. Payment innovation thus reinforces spend velocity in the Slovenia e-commerce market. [3]
Restraints Impact Analysis of Slovenia E-commerce Market*
| Restraint | (~) % Impact on CAGR Forecast | Geographic Relevance | Impact Timeline |
|---|---|---|---|
| High last-mile fulfilment costs for dispersed Alpine populations | -1.2% | Alpine regions and rural areas | Medium term (2-4 years) |
| Sub-scale domestic warehousing capacity versus seasonal demand spikes | -0.9% | National, with concentration in logistics hubs | Short term (≤ 2 years) |
| Low online basket value vs. Western Europe, squeezing retailer margins | -0.7% | National | Medium term (2-4 years) |
| Persistent preference for cash-on-delivery outside urban centres | -0.5% | Rural and suburban areas | Long term (≥ 4 years) |
| Source: Mordor Intelligence | |||
High last-mile fulfilment costs
Mountainous terrain inflates route length and limits drop density, adding up to 30% on delivery expenses relative to Ljubljana. Couriers experiment with crowd-shipping, tapping commuters and retirees for parcel hand-offs, yet adoption remains patchy due to privacy worries and technology gaps. Retailers set higher free-shipping thresholds for remote postcodes, dampening basket growth. Drone pilot programs are under regulatory review but face payload limits. Until cost curves bend, fulfilment surcharges undermine price parity and restrain penetration in outlying districts of the Slovenia e-commerce market.
Sub-scale domestic warehousing capacity
Peak-season surges strain Slovenia’s modest inventory footprint, triggering stock-outs or costly short-term leases. Legacy facilities lack automation, resulting in lower pick rates and channel-wide delays. Investors now channel capital into multi-tenant warehouses with mezzanine floors and robotics-ready layouts, but capacity will trail demand through 2026. Merchants hedge by holding safety stock in neighbouring Austria and Italy, elongating replenishment cycles. These inefficiencies shave margin headroom in the Slovenia e-commerce market.
*Our forecasts treat driver/restraint impacts as directional, not additive. The impact forecasts reflect baseline growth, mix effects, and variable interactions.
Slovenia E-commerce Market Segment Analysis
By Business Model:
B2B momentum accelerates digital diversificationThe B2C arm dominated revenue in 2025, holding 85.42% of spend as local shoppers embraced mobile-led convenience. This dominance lifted the Slovenia e-commerce market size for consumer retail to USD 0.91 billion, yet the corporate channel is gaining ground. The B2B sector is forecast to grow at 9.54% CAGR, outpacing headline expansion. Digital vouchers and favourable tax credits encourage SMEs to streamline procurement via online portals, trimming transaction overheads and broadening supplier options. Early movers in manufacturing tools and hospitality supplies record double-digit online conversion, signalling a structural shift toward platform purchasing.
Rising cross-border trade integration gives Slovenian exporters a cost-effective path to reach EU partners, underpinned by harmonised invoicing standards. Multi-language catalogues and embedded financing differentiate B2B platforms chasing higher-margin niches. As procurement officers prioritise speed and transparency, sellers deploy punch-out catalogues and API connections for real-time stock levels. This interoperability deepens wallet share and boosts the Slovenia e-commerce market in the enterprise segment.

By Device Type:
Mobile commerce shapes the engagement blueprintSmartphones generated 74.88% of traffic and 67.23% of sales in 2025, making mobile the undisputed gateway to the Slovenia e-commerce market. It has highest growth rate of 9.18%. Responsive layouts now give way to progressive web apps that pre-cache images for sub-second load times on 4G and emerging 5G networks. Retailers embed virtual try-ons and AR sizing guides to counter return risks, particularly in fashion and furniture. Meanwhile, desktops retain relevance for complex B2B configurations and multi-item cart assembly, indicating a bifurcated device journey.
Device convergence drives omnichannel behaviours: shoppers scan QR codes in physical stores to access richer online assortments, then finalise payment through mobile wallets. Push notifications re-engage dormant carts, leveraging precise geo-fencing to time offers during commute hours. Voice commerce remains nascent but is expected to capture incremental share as Slovene-language assistants reach critical accuracy. Consequently, mobile optimisation remains mission-critical for sustained growth of the Slovenia e-commerce market size in the years ahead.
By Payment Method:
Digital wallets and BNPL recast checkout economicsCard rails still dominate with 51.63% share, yet wallet transactions surge as Apple Pay, Google Pay, and local schemes integrate instant SEPA transfers. Wallets post a forecast 10.39% CAGR, tightening settlement cycles and reducing chargeback exposure. The Slovenia e-commerce market share of BNPL climbed steadily, hitting mid-single-digit penetration within electronics and home appliances. Providers extend loyalty programmes, offering cashback on punctual instalments to reinforce repayment discipline.
Merchants deploy payment-orchestration platforms that route transactions dynamically to the lowest-cost processor, shaving fee expense. Strong Customer Authentication (SCA) mandates elevate the role of frictionless biometrics to maintain conversion parity with one-click cards. As digital wallets absorb identity and loyalty credentials, checkout flows compress to two taps, strengthening user lock-in across the Slovenia e-commerce market.
By B2C Product Category:
Food & Beverages surges on delivery densityFashion & apparel kept the revenue crown with 28.74% share in 2025, but food & beverages races ahead at a 12.22% CAGR. Regional grocers expand dark-store networks within a 10-kilometre radius of dense districts, slashing delivery windows below 60 minutes. Temperature-controlled tote systems preserve freshness, encouraging consumers to migrate weekly shops online. Electronics stay resilient as gamers and remote workers upgrade hardware, while homeware benefits from AR layout tools that shortcut the imagination gap.
Subscription beauty boxes combine AI-driven skin diagnostics with personalised replenishment schedules, lifting repeat rates. Toy and DIY categories leverage influencer tutorials and user-generated reviews to unlock cross-sell synergies. As assortment breadth widens and logistics performance solidifies, category diversification broadens the Slovenia e-commerce market’s addressable wallet share.
Geography Analysis
Proximity to major EU trade corridors bestows Slovenia with cross-border leverage, but internal demand still anchors the Slovenia e-commerce market. Metropolitan Ljubljana accounts for roughly 40% of national online spend, propelled by higher purchasing power and same-day fulfilment saturation. Maribor and Celje follow, aided by university demographics and growing warehouse clusters along the A1 motorway. Alpine municipalities exhibit lower order frequency due to delivery surcharges and patchy broadband, yet forthcoming fibre projects aim to close the gap.
EU cohesion funds of EUR 147 million (USD 159 million) earmarked in 2025 target fibre backbones and 5G rollout across underserved valleys, catalysing digital adoption. The RUNE rural network’s 1,600 km optical build will bring gigabit speeds to 52,000 homes, creating new demand pockets. Improved connectivity underpins video-rich product pages and live-shopping events, previously bandwidth-constrained.
Cross-border flows through the Port of Koper and rail links to Austria shorten inbound transit times for international sellers, enhancing category diversity. Slovenia’s inclusion in major international parcel networks positions it as a springboard for Central-European distribution. Domestic merchants leverage the same lanes to reach Italy, Croatia, and Hungary within 48 hours, monetising scale despite the country’s small population. This logistical fluidity cements Slovenia’s strategic role and sustains long-run growth in the Slovenia e-commerce market.
Regulatory Landscape
Slovenia e-commerce operators comply with a mix of EU digital-market rules and national consumer and tax frameworks, with enforcement anchored by named public bodies. Under the Act on Implementation of the Regulation (EU) on the Single Market for Digital Services (ZIUETDS), the Agency for Communication Networks and Services of the Republic of Slovenia (AKOS) is designated as the Digital Services Coordinator for applying the EU Digital Services Act (Regulation (EU) 2022/2065), while the Financial Administration of the Republic of Slovenia (FURS) oversees tax compliance and platform reporting.
Recent compliance obligations add operational workload for platforms and marketplaces: FURS communications tied to DAC7 require Slovenian digital platform operators to report relevant 2025 seller and transaction data by January 31, 2026. For B2B commerce, the ZIERDED framework sets a phased transition toward structured e-invoicing and e-documents exchanged through authorized providers connected to the PEPPOL network, with full mandatory usage starting January 1, 2028 (and earlier provisions beginning April 1, 2027), reinforcing the need for PEPPOL-ready checkout, invoicing, and ERP integrations.
Value Chain Analysis
The Slovenia e-commerce value chain starts with merchant onboarding and catalog creation (brand owners, distributors, and SMEs), then flows through storefront and marketplace enablement (web shops, marketplaces, and channel managers) to payments, fulfilment, and last-mile delivery. Digital enablement is supported by public programs and coordination nodes such as DIH Slovenia (a one-stop-shop linking stakeholders including the University of Ljubljana and the Chamber of Commerce and Industry) and national digitisation initiatives that encourage SMEs to adopt web sales, cybersecurity, and digital marketing tools.
On the operational backbone, merchants and logistics providers increasingly rely on standardized data exchange and integration layers: EDI standards (eSlog, EDIFACT, GS1, UBL) and service providers such as bizBox connect ordering, invoicing, and shipping workflows across enterprises. Fulfilment and warehousing are delivered via specialized hubs (for example, Fully) and are integrated into retailer operations using connectors that link ERPs to sales channels (such as nVitamin Exchange) for platforms and retailers including Mimovrste, Petrol, Big Bang, and Shoppster. The main value-chain friction points remain fulfilment economics and capacity (sub-scale warehousing relative to seasonal spikes) and higher last-mile costs outside dense corridors, pushing merchants toward third-party logistics, better inventory visibility, and more automation in picking and returns.
Competitive Landscape
Fragmentation defines the Slovenia e-commerce industry, with no single player holding more than mid-teens revenue share. Local players Mimovrste leads electronics and general merchandise through a blend of broad assortment and local service innovations such as the Smart! unlimited-delivery scheme. BigBang.si and Mercator.si follow, each leveraging offline footprints to offer click-and-collect options. International entrants Amazon, AliExpress, and Temu compete heavily on price breadth, forcing domestic operators to refine differentiation around customer service, faster delivery, and curated assortments.
Fashion competition tightened after Zalando’s EUR 1.1 billion (USD 1.19 billion) acquisition of About You, pooling inventory depth and marketing muscle. This consolidation raises customer-acquisition costs for smaller boutiques, prodding them to specialise in niche labels and local designers. Logistics capabilities emerge as a battleground; Pošta Slovenije’s partnership with China Post grants domestic sellers faster customs clearance and end-to-end tracking, while DHL’s takeover of IDS Fulfilment enriches value-added services such as returns processing and SME onboarding.
Investment flows signal confidence in the sector’s upside. Advance Capital Partners’ buyout of tourism operator Unitur integrates online booking engines with physical leisure assets, pointing to omnichannel synergies. InterCapital’s expansion into Slovenia supplies fresh capital for start-ups innovating in payment orchestration, last-mile robotics, and cross-border compliance. These moves collectively intensify rivalry yet lift customer expectations, fuelling advancement across the Slovenia e-commerce market.
Slovenia E-commerce Industry Leaders
-
Mimovrste d.o.o.
-
Merkur Trgovina d.o.o.
-
Big Bang d.o.o.
-
Petrol d.d.
-
Lekarna Nove Poljane
- *Disclaimer: Major Players sorted in no particular order
Slovenia E-commerce Market Companies Covered in this Report
- Mimovrste d.o.o.
- Merkur Trgovina d.o.o.
- Mercator d.d.
- Big Bang d.o.o.
- Lekarna Nove Poljane
- LES-MMS trgovska družba d.o.o.
- Zooplus AG
- Emundia d.o.o.
- Moja Lekarna d.o.o.
- Petrol d.d.
- Spar Slovenija d.o.o.
- Tuš Holding d.o.o.
- Harvey Norman Trading d.o.o.
- Baby Center d.o.o.
- Studio Moderna d.o.o.
- About You SE and Co. KG
- Amazon EU S.à r.l.
- AliExpress (Alibaba Group)
- eBay Inc.
- Zara.com (Inditex)
Market Opportunities and Future Outlook
A core whitespace sits in expanding the addressable buyer and merchant base outside urban centers by converting connectivity gains into transactional adoption. In Q1 2025, 53% of residents aged 16 to 74 made at least one online purchase, indicating room to deepen penetration among the remaining population and to increase purchase frequency through improved service levels and trust-building (for example, clearer returns, faster delivery, and localized customer support). Enterprise-side digitization is also material: enterprises generated about EUR 4,890 million in turnover from web sales in 2024, and the e-commerce share of enterprise turnover stood at 16.78% as of December 2025, supporting investment cases for better product information management, multi-channel inventory, and B2B catalog and ordering capabilities.
Logistics and platform restructuring are creating concrete execution paths for cross-border marketplaces and local sellers. In July 2026, Pošta Slovenije signed an agreement with Temu to expand logistics cooperation tied to Temu’s Local Seller Program, which elevates requirements for domestic pick-up, sorting, and delivery integration and can pull more Slovenian merchants into marketplace-led demand. In March 2026, Mutares completed the acquisition of Mimovrste (along with Mall.hr and dedicated IT resources), spotlighting modernization and operational turnaround as a lever for competitiveness against international entrants. On the policy side, upcoming EU transposition deadlines in 2026, including Directive 2024/825 (Empowering Consumers for the Green Transition, March 27, 2026) and Directive 2024/1799 (Right to Repair, July 31, 2026), create demand for more robust product claims governance, sustainability disclosures, and after-sales workflows, favoring retailers that invest early in compliant content, repair-friendly service models, and returns optimization.
Recent Industry Developments in Slovenia E-commerce Market
- June 2026: Merkur trgovina opened its first Merkur HUB in Naklo, positioning the site as a specialized center for B2B procurement and support. The move strengthens Merkur's ability to serve business buyers with faster availability, structured ordering, and service-led differentiation that can spill over into its online sales experience.
- May 2025: DHL acquired IDS Fulfilment, expanding its portfolio in flexible warehousing, returns management, and SME onboarding services. The acquisition deepens third-party fulfilment options for Slovenian merchants and raises competitive pressure on smaller logistics providers that serve e-commerce sellers.
- August 2024: Telemach Slovenia agreed to acquire telecom rival T-2, consolidating broadband and mobile infrastructure ownership in the local market. The deal supports more bundled connectivity propositions, which can influence e-commerce traffic acquisition and mobile-first shopping behavior through data plans and customer-base cross-promotion.
Slovenia E-commerce Market Report Scope and Research Methodology
Market Definition and Coverage
This market is sized as the value of goods and services ordered through online interfaces in Slovenia, where the order is placed digitally and payment is made online or on delivery. We treat this as the transaction value captured by merchants and platforms, reported net of VAT.
Scope exclusions: digital-only subscriptions, informal peer-to-peer swaps, and in-app micro-payments that do not reach a normal checkout flow are excluded.
Segments Covered in This Report
- By Business Model
- B2C
- B2B
- By Device Type
- Smartphone / Mobile
- Desktop and Laptop
- Other Device Types
- By Payment Method
- Credit / Debit Cards
- Digital Wallets
- BNPL
- Other Payment Method
- By B2C Product Category
- Beauty and Personal Care
- Consumer Electronics
- Fashion and Apparel
- Food and Beverages
- Furniture and Home
- Toys, DIY and Media
- Other Product Categories
Data Sources, Market Sizing, and Validation
Desk Research
Desk work starts with Slovenia-specific signals that explain how fast online buying can grow and what categories drive spending. We reviewed public statistics and policy materials such as the Statistical Office of the Republic of Slovenia (SURS) releases, Eurostat digital economy tables, Bank of Slovenia payments indicators, and European Commission Digital Economy and Society Index (DESI) notes, then used customs and trade references when category coverage needed context.
To translate those signals into a usable model, we also used broader public sources such as industry association publications, merchant and logistics press releases, and company annual reports or investor materials when available. A paid subscription covering company financials and a separate news and financials source were used selectively to sanity check revenue direction and major event timing. These examples are not exhaustive, and we referred to other public sources for data collection, validation, and research clarification.
Primary Interviews and Surveys
Interviews and surveys with CXOs, functional/unit leaders, and managers across Slovenian merchants, marketplaces, logistics providers, payment specialists, and service businesses help test order frequency, average order value, category mix, cross-border activity, and platform use. Respondent input helps fill gaps in published data and challenge unusual assumptions within the Slovenia market. Responses are compared with desk findings before the final model is set.
Distribution of primary research fieldwork respondents
| Company type | Respondent position |
|---|---|
| Top tier: 28% | CXOs: 15% |
| Mid tier: 47% | Functional/Unit leaders: 32% |
| Smaller Players: 25% | Managers: 53% |
Market-Sizing & Forecasting
Sizing begins from a top-down demand pool build, where online purchasing incidence and spend intensity in Slovenia are used to reconstruct total online transaction value by year, then reconciled to observed payments and retail activity direction. Once the full-year total is established, it is filtered through category-level online adoption and typical order values, which helps keep the number aligned with what consumers and businesses can realistically spend.
We then corroborate results with selective bottom-up approximations, such as sampled merchant sales disclosures, scaled order value checks, and channel mix checks shared in interviews. Where gaps remain, we use conservative proxies from adjacent categories and re-test them with experts. Key inputs used in the model include internet and smartphone usage penetration, e-commerce buyer share, card and transfer payment usage for online purchases, delivery and returns intensity (which affects realized value), and inflation-linked pricing trends that influence average order value. For forecasting, scenario analysis uses agreed variable paths from primary discussions, with adoption growth and pricing progression tested under steady, conservative, and faster digitalization cases, and then narrowed to a single base case.
Data Validation & Update Cycle
Validation is done through triangulation between the modeled totals and independent signals, including household consumption direction, online payments growth, and reported retail and services trends, then any large variance is investigated before sign-off. We also run reasonableness checks on year-over-year changes to ensure one-off shocks, currency timing, or unusually strong promotion periods do not distort the series.
Before finalization, the model and assumptions go through a multi-step analyst review, and re-contacts are triggered when a major driver conflicts with what experts report on adoption or pricing. Reports are refreshed annually, with interim updates when material events occur, and an analyst completes a final data pass close to delivery so clients receive the latest updated view.
Mordor Intelligence's Slovenia Ecommerce Market Size Compared With Other Published Estimates
Published market values for Slovenia e-commerce often do not match, and differences usually come from what is counted as e-commerce value, how taxes and returns are treated, and the year used for currency conversion. Another common cause is that some estimates rely heavily on a single data stream, which can miss smaller merchants or overstate cross-border flows.
Digital-only subscriptions sit outside Mordor Intelligence's scope for this market, and that single exclusion alone can shift totals when other sources bundle streaming, gaming, or app-based spending into e-commerce. Gaps also show up when some publishers report gross values including VAT, or apply aggressive average order value growth without checking it against payment usage and buyer penetration trends in Slovenia.
Benchmark comparison
| Source | Market Size | Gaps in Research Methodology |
|---|---|---|
| Mordor Intelligence | USD 1.07 B (2025) | |
| Trade Journal A | USD 1.22 B (2025) | Often reports GMV-like totals that can include VAT and higher assumed cross-border share, and it may also bundle selected digital subscription spend into online commerce value. |
| Industry Association B | USD 0.96 B (2025) | May focus on a narrower merchant panel and card-only tracked spending, which can undercount COD orders and smaller sellers that are visible in broader buyer and payments checks. |
The spread across the table is mostly explained by what gets counted as transaction value (VAT treatment, cross-border capture, and whether digital subscriptions are included) and how order value growth is projected. By keeping assumptions tied to buyer penetration, payments signals, and interview-based channel checks, we keep the estimate repeatable and easier to audit year to year.
Key Questions Answered in the Report
How fast is the Slovenia e-commerce market expected to grow between 2026 and 2031?
It is projected to expand at an 8.01% CAGR, rising from USD 1.16 billion in 2026 to USD 1.7 billion by 2031.
Which business model is expanding the quickest in Slovenian online retail?
The B2B segment is set to grow at 9.54% CAGR, benefiting from government vouchers that subsidise SME digital upgrades.
What share of online orders originates from mobile devices?
Smartphones generated 74.88% of e-commerce traffic in 2025 and are forecast to sustain a 9.18% CAGR through 2031.
Which payment method is gaining momentum most rapidly?
Digital wallets are the fastest-growing option, recording a projected 10.39% CAGR and challenging the 51.63% card share.
Why is food & beverage the breakout product category?
Investments in same-day grocery delivery, particularly around Ljubljana, are pushing the category to a 12.22% CAGR up to 2031.
What infrastructure projects support future e-commerce penetration in rural Slovenia?
EU-funded fibre deployments aim for 100 Mbps coverage by 2025 and gigabit speeds by 2030, widening access for 52,000 rural households.