
Sleep Tech Devices Market Size and Share
Market Overview
| Study Period | 2020 - 2031 |
|---|---|
| Market Size (2026) | USD 34.74 Billion |
| Market Size (2031) | USD 79.88 Billion |
| Growth Rate (2026 - 2031) | 18.12 % |
| Fastest Growing Market | Asia Pacific |
| Largest Market | North America |
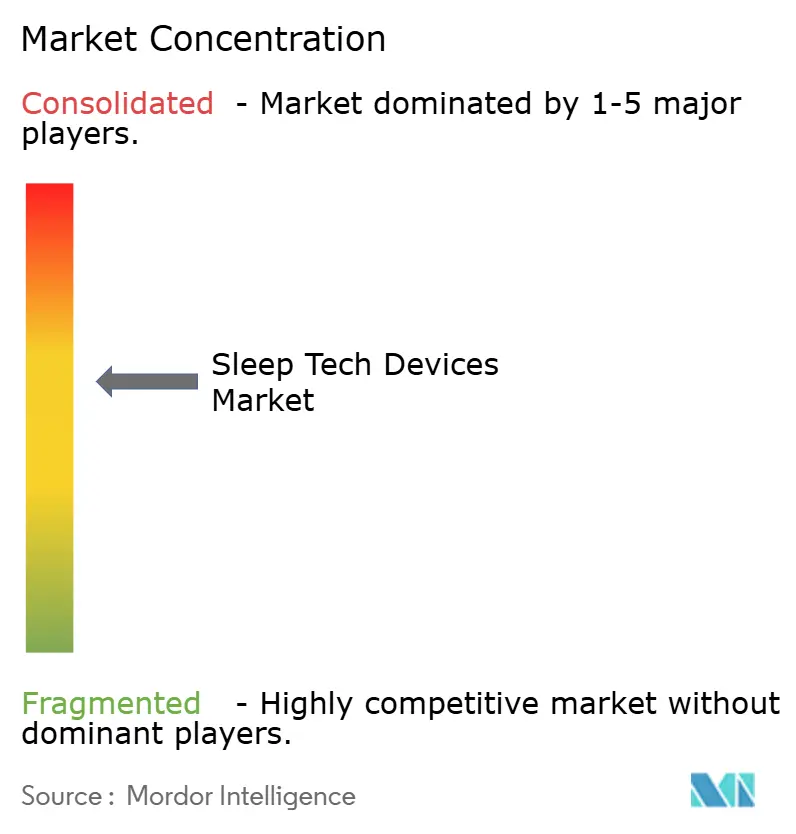
| Market Concentration | Medium |
Major Players *Disclaimer: Major Players sorted in no particular order Image © Mordor Intelligence. Reuse requires attribution under CC BY 4.0. | |
Sleep Tech Devices Market Analysis by Mordor Intelligence
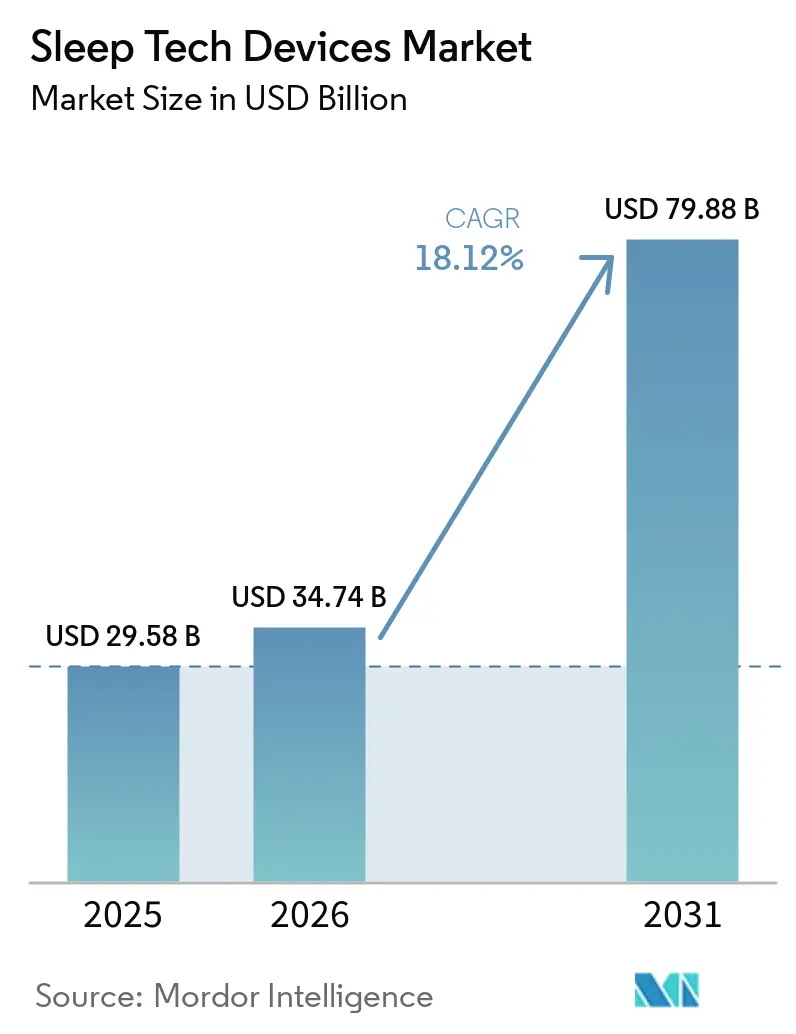
The Sleep Tech Devices Market size is projected to be USD 29.58 billion in 2025, USD 34.74 billion in 2026, and reach USD 79.88 billion by 2031, growing at a CAGR of 18.12% from 2026 to 2031.
This growth reflects a significant transition from clinic-centric diagnostics to connected, at-home solutions that integrate hardware with subscription-based analytics. Wearable devices are driving value creation, supported by FDA clearances that have elevated products like the Apple Watch Series 10 and Samsung Galaxy Watch7 from wellness trackers to reimbursable diagnostic tools. Regulatory advancements, such as the European Union's Medical Device Regulation and expanded Medicare coverage for home testing, are expediting market entry for new players. Additionally, Edge AI chips, such as the SleepViT ASIC designs, operate on just 0.56 milliwatts, enabling real-time device inference while reducing recurring cloud costs. However, inconsistent enforcement of data privacy regulations under HIPAA and GDPR presents challenges, requiring brands to adapt their go-to-market strategies to align with jurisdiction-specific requirements.
Key Report Takeaways
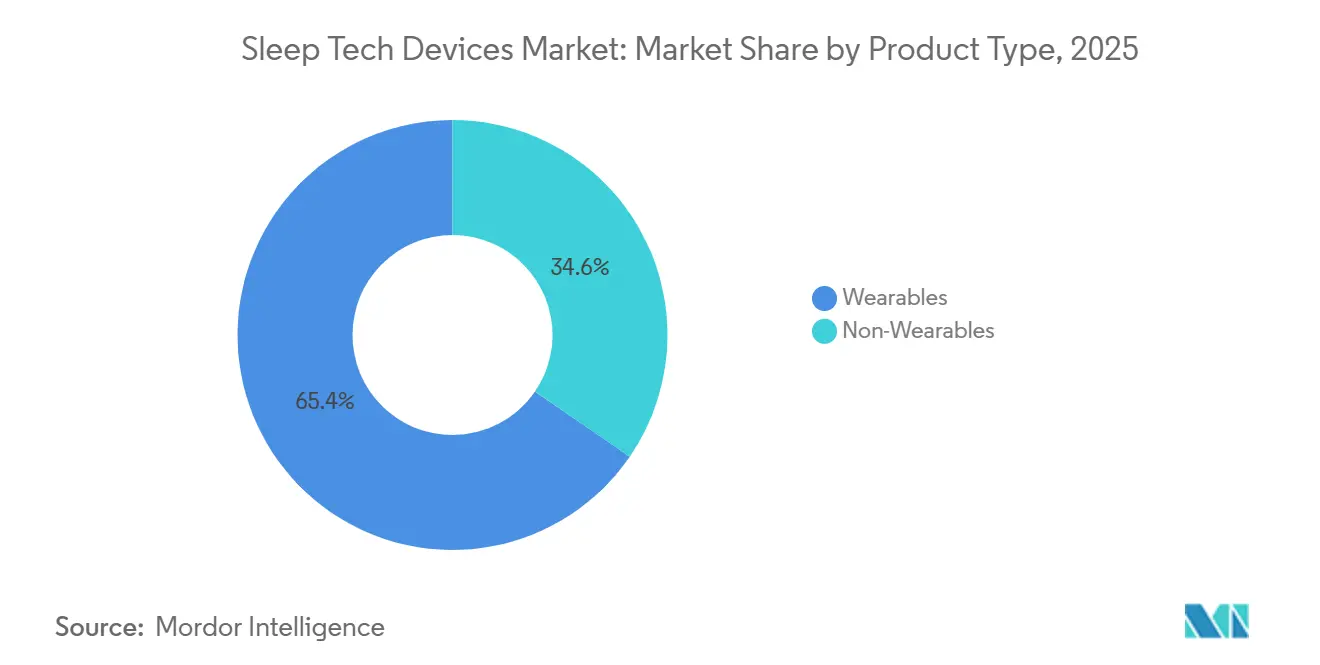
- By product type, wearables led the sleep tech devices market with a 65.43% share in 2025, and the segment is projected to grow at a 20.43% CAGR through 2031.
- By application, insomnia captured 42.45% of the revenue in 2025; narcolepsy devices are projected to record the highest CAGR at 20.55% from 2026 to 2031.
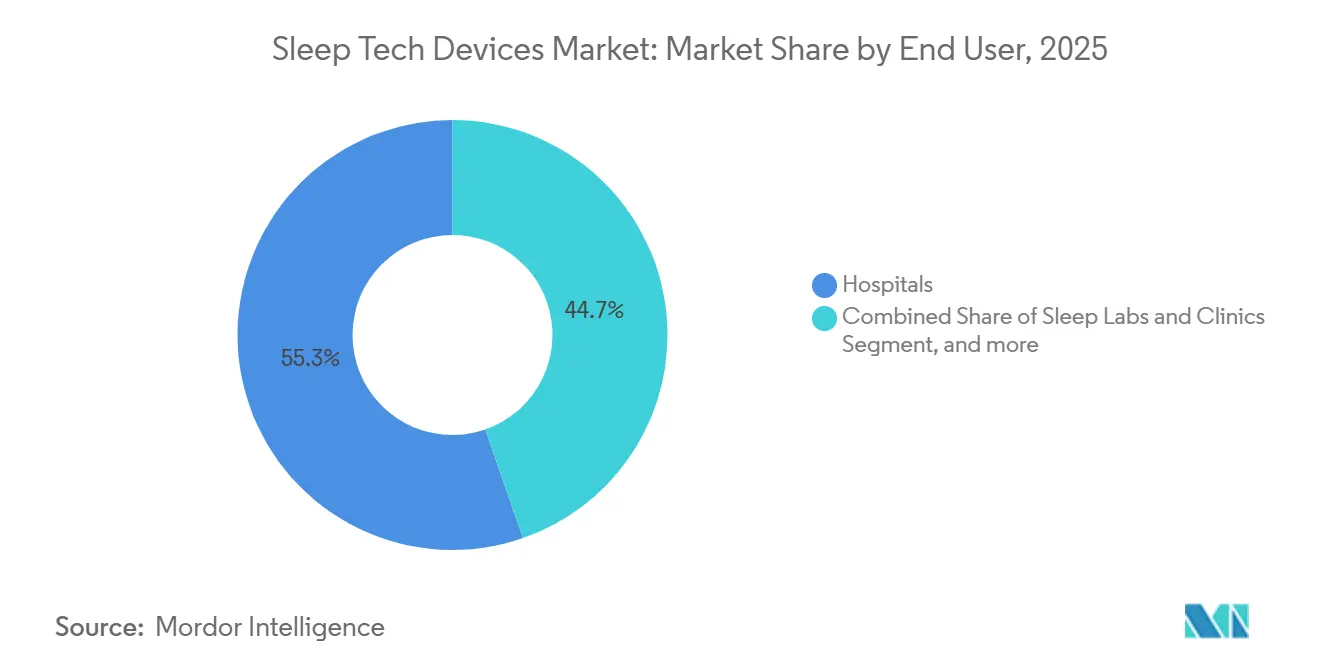
- By end user, hospitals held 55.32% of revenue in 2025, whereas home care settings are advancing at a 21.56% CAGR.
- By distribution channel, offline retail accounted for 41.45% of sales in 2025, while direct-to-consumer e-commerce is projected to post a 21.45% CAGR.
- By geography, North America led with 42.87% share in 2025, while Asia-Pacific is pacing at a 19.43% CAGR through 2031.
Note: Market size and forecast figures in this report are generated using Mordor Intelligence’s proprietary estimation framework, updated with the latest available data and insights as of January 2026.
Global Sleep Tech Devices Market Trends and Insights
Drivers Impact Analysis*
| Driver | ( ~) % Impact on CAGR Forecast | Geographic Relevance | Impact Timeline |
|---|---|---|---|
| Increasing Prevalence of Sleep Disorders | +4.2% | Global, especially North America and Asia-Pacific cities | Medium term (2-4 years) |
| Technological Advancements in Wearables, Sensors & AI | +5.1% | North America, Europe, Asia-Pacific tech hubs | Short term (≤ 2 years) |
| Growing Adoption of Smart-Home Ecosystems for Sleep Optimization | +2.8% | North America, Europe, early Middle East spillover | Medium term (2-4 years) |
| Regulatory Support for Home Sleep Testing & Reimbursement Expansion | +3.4% | North America, Europe, gradual Asia-Pacific uptake | Long term (≥ 4 years) |
| Integration of Sleep Data into Insurance Wellness Programs | +1.9% | North America, pilots in Europe and Asia-Pacific | Long term (≥ 4 years) |
| Edge AI Chips Enabling Real-Time, On-Device Sleep Analytics | +2.3% | Global, led by U.S. and Asia-Pacific fabs | Short term (≤ 2 years) |
| Source: Mordor Intelligence | |||
Increasing Prevalence of Sleep Disorders
An estimated 852 million adults reported experiencing insomnia symptoms in 2024, representing 16.2% of the global adult population[1]. Obstructive sleep apnea diagnoses reached 936 million, yet 80% remain undiagnosed because clinic capacity cannot meet demand. In the United States, 36% of adults disclosed a diagnosed sleep disorder in 2024, underscoring a care gap that home testing can fill. FDA approval of Wakix for pediatric narcolepsy broadened the treated population, elevating demand for monitoring wearables in younger cohorts. Aging populations and rising obesity rates, notably in India and China, further intensify the worldwide incidence of sleep-disordered breathing.
Technological Advancements in Wearables, Sensors & AI
The Oura Ring Generation 4 reduced motion artifacts by 30% compared to its earlier model and introduced Advisor AI for personalized coaching. The Apple Watch Series 10 detects sleep apnea with a sensitivity above 85% using accelerometer and heart rate data. SleepViT’s ultra-low-power ASIC executes sleep-stage classification locally, minimizing latency and cloud fees[2]. Samsung Galaxy Watch7 raised sleep-stage concordance to 78%, narrowing the gap with clinical actigraphy. These improvements narrow the performance gap between consumer wearables and lab-grade devices, fostering physician endorsement and insurance reimbursement.
Growing Adoption of Smart-Home Ecosystems for Sleep Optimization
The Matter protocol, supported by Apple, Google, and Samsung, unifies smart-home devices so that temperature, lighting, and sound adjust to biometric cues in real-time. The Google Nest Hub utilizes Soli radar to gather contactless respiratory signals, achieving 92% accuracy compared to pulse oximetry. Withings Sleep Mat offers under-mattress sensing for users who prefer not to wear devices during the night. Circadian-aligned lighting systems that shift from 2,700 Kelvin at night to 5,500 Kelvin in the morning cut sleep-onset latency by 19% in peer-reviewed trials. As ecosystems converge, platform owners consolidate value while standalone trackers face interoperability headwinds.
Regulatory Support for Home Sleep Testing & Reimbursement Expansion
The FDA cleared ResMed’s NightOwl in April 2025, a USD 149 disposable home test that operates at one-third the cost of polysomnography. The United Kingdom’s NICE endorsed six home tests in December 2024, including AcuPebble SA100 priced at GBP 40 to GBP 60 per use, legitimizing lower-cost diagnostics. The American Academy of Sleep Medicine published technical guidance in 2024 supporting Type III home tests with up to seven channels. Medicare raised reimbursement for home testing to 80% of the allowable amount in 2025, removing a major adoption hurdle for seniors. This policy momentum compresses the path from symptom recognition to treatment initiation.
Restraints Impact Analysis*
| Restraint | (~) % Impact on CAGR Forecast | Geographic Relevance | Impact Timeline |
|---|---|---|---|
| High Cost of Advanced Sleep Tech Devices | -2.7% | Global, acute in emerging economies | Medium term (2-4 years) |
| Data Privacy and Security Concerns | -1.8% | Europe, North America, Asia-Pacific | Short term (≤ 2 years) |
| Lack of Standardized Clinical Validation Protocols | -1.5% | Worldwide | Long term (≥ 4 years) |
| Supply-Chain Volatility in Sensor Components | -1.3% | Global, centered in Asia-Pacific fabs | Medium term (2-4 years) |
| Source: Mordor Intelligence | |||
High Cost of Advanced Sleep Tech Devices
Eight Sleep’s Pod 4 Ultra retails for between USD 2,000 and USD 3,000, positioning it as a luxury purchase rather than a mass-market health tool. Sleep Number’s Climate360 bed ranges from USD 10,000 to USD 13,500, which limits its uptake to households in the highest income decile. The Oura Ring costs between USD 299 and USD 399 and requires a monthly subscription of USD 5.99 for premium analytics, which raises the total first-year ownership cost above USD 370. CPAP therapy can exceed USD 3,000 when diagnostic polysomnography is needed, delaying initiation for uninsured users. Subscription models heighten affordability concerns, especially in markets where the annual per-capita healthcare expenditure is below USD 200.
Data Privacy and Security Concerns
GDPR classifies sleep metrics as sensitive data that require explicit user consent, resulting in granular permission flows that may hinder feature adoption[3]. HIPAA applies inconsistently to wellness devices, creating gray zones that insurers exploit when underwriting policies based on biometric data. A 2024 consumer survey found that 62% of respondents were reluctant to share their sleep data with third parties, citing concerns about discriminatory pricing. Independent penetration testing revealed firmware vulnerabilities in nine of the fifteen most popular wearables, allowing for unauthorized biometric access. GDPR fines can reach 4% of global revenue, and HIPAA breaches cost up to $50,000 per compromised record, prompting manufacturers to adopt conservative data-handling practices.
*Our forecasts treat driver/restraint impacts as directional, not additive. The impact forecasts reflect baseline growth, mix effects, and variable interactions.
Segment Analysis
By Product Type: Wearables Dominate Through Subscription Monetization
Wearables accounted for 65.43% of 2025 revenue, with the segment on track to grow at 20.43% through 2031, as edge analytics and large installed bases reinforce network effects. Oura generated USD 500 million in revenue in 2024 and converted more than 30% of owners into monthly subscribers, a model that lifts margins beyond hardware sales. Apple Watch Series 10 capitalizes on over 200 million active devices, transforming existing users into sleep-apnea patients without incremental bill-of-materials costs. The Samsung Galaxy Watch7 improved sleep-stage accuracy by 12 percentage points over the prior model, bringing the device closer to clinical relevance.
Non-wearables cater to consumers who prefer passive or environmentally friendly interventions. Eight Sleep’s Pod 4 Ultra delivers 32% gains in self-reported sleep quality via dual-zone thermal control. Sleep Number’s Climate360 integrates responsive air chambers at price points beyond USD 10,000, catering to affluent wellness adopters. ResMed’s NightOwl disposable test democratizes diagnostics at USD 149, capturing users who avoid lab studies. The Withings Sleep Mat offers under-mattress sensing but lacks multi-sensor fidelity, which limits its clinical use.

By Application: Insomnia Leads, Narcolepsy Accelerates
Insomnia accounted for 42.45% of application revenue in 2025, as cognitive behavioral therapy modules embedded in wearables gained traction. Apple’s breathing-exercise sequences reduced sleep-onset latency by 12 minutes in trials, highlighting the convergence of mental health. CPAP and related sleep-apnea devices target a diagnosed base of 936 million, yet most cases remain untreated, leaving a vast diagnostic pool. ResMed’s AirSense 11 utilizes adaptive algorithms that reduce abandonment by 18% compared to fixed-pressure systems.
Narcolepsy devices are advancing at a 20.55% CAGR, the fastest-growing segment, driven by FDA approvals that now include pediatric patients aged six and above. LUMRYZ extended-release sodium oxybate gained clearance in September 2024, with wearables offering objective adherence metrics. Restless-leg monitoring through accelerometers generates an ancillary revenue stream as limb-movement data are validated for clinical decision-making. As real-time data becomes accessible, treatment can shift from episodic office visits to continuous titration.
By End User: Homecare Settings Surge
Hospitals accounted for 55.32% of revenue in 2025, as polysomnography and surgical interventions continue to originate in inpatient settings. However, home care settings are expected to enjoy a 21.56% CAGR as Medicare reimbursement improves and cloud platforms transmit CPAP adherence data directly to clinicians. ResMed’s AirView platform reduced therapy abandonment by 22% compared to quarterly check-ups, demonstrating the efficacy of remote monitoring.
Sleep labs are facing shrinking volumes after the AASM guidelines allowed Type III home testing for moderate-risk patients. Employer wellness programs, such as UnitedHealthcare Motion, pay members up to USD 1,500 per year for meeting sleep targets and integrating devices into productivity strategies. The migration from hospital to home aligns with broader value-based care models that reward outcomes rather than service intensity.
By Distribution Channel: E-Commerce Gains Share
Offline retail accounted for 41.45% of 2025 sales, driven by consultative selling that eases buyers into high-ticket purchases. Best Buy’s partnership with Oura lets shoppers verify ring sizing in more than 850 U.S. outlets. Durable-equipment suppliers bundle insurance pre-authorizations with CPAP sales, sustaining brick-and-mortar relevance.
Direct-to-consumer e-commerce is projected to rise at 21.45% through 2031, as brands capture full margins and mine first-party data. Eight Sleep’s Plus plan generates USD 24 monthly per user, adding recurring revenue on top of a USD 2,000 base product. Amazon processed over 40 million sleep-related orders in 2024, utilizing Prime logistics to reduce delivery friction. For wearables priced below USD 400, online convenience outweighs showroom experiences, steering share away from physical channels.
Geography Analysis
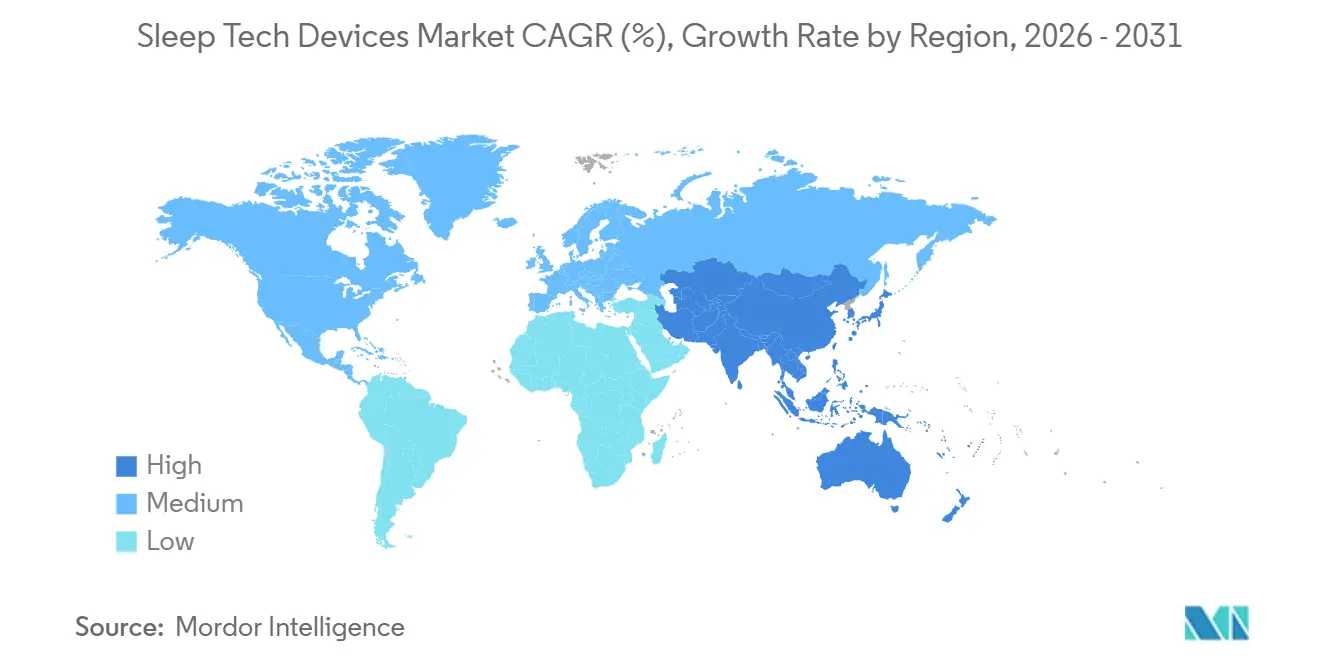
North America retained 42.87% of revenue in 2025 as high insurance coverage and early FDA clearances fostered adoption. ResMed generated USD 2.3 billion in 2024 Americas revenue, reflecting robust CPAP uptake and growth in cloud subscriptions. Canada expanded provincial reimbursement for home testing, extending access beyond urban sleep labs.
The Asia-Pacific region records the fastest trajectory, with a 19.43% CAGR. China’s sleep tech devices market surpassed USD 1.2 billion in 2024, driven by e-commerce penetration exceeding 50% and the government's emphasis on preventive health. India’s market, estimated at USD 300 million in 2024, benefits from a shift to local manufacturing that lowers average retail prices. Xiaomi’s Mi Band 8 Pro, selling for USD 50, democratizes tracking for cost-sensitive buyers. Huawei captured a 15% share of China’s wearables segment by integrating TruSleep algorithms into the Watch GT 4.
Europe’s growth lags due to GDPR compliance costs and country-specific reimbursement hurdles. NICE guidance in the United Kingdom approved six home tests priced well below lab studies, signaling payer openness to lower-cost diagnostics. Germany’s statutory insurance now funds CE-marked wearables for insomnia, provided there is evidence of equivalence to CBT-I. The Middle East and Africa, while smaller, are expanding in double digits as Gulf states invest in digital health strategies. South America’s adoption trails because average device prices equal more than 20% of monthly household income, restricting uptake to affluent urban users.
Regulatory Landscape
Sleep tech devices sit across consumer wellness and regulated medical devices, with classification driven by intended use and the claims made about performance. In the United States, the FDA typically places sleep-related diagnostic and therapeutic products such as home sleep testing components and sleep apnea therapy equipment under medical device controls (often Class II), requiring pathways such as 510(k) when they are intended for diagnosis, monitoring, or treatment. Products positioned as low-risk general wellness may fall outside active medical-device oversight depending on claims.
In Europe, the EU Medical Device Regulation (EU) 2017/745 and MDCG software guidance (including Rule 11) shape market access for software used for sleep diagnosis or therapy, often moving analytics and digital modules into Class IIa or higher when a medical purpose is stated. Standards updates are also influencing compliance roadmaps for sleep apnea therapy ecosystems. ISO 80601-2-70:2025 updates safety and essential performance requirements for sleep apnea breathing therapy equipment, and ISO 17510:2025 updates requirements for masks and accessories, creating a newer reference point for manufacturers and suppliers selling into regulated CPAP and related workflows. These changes keep labeling, clinical validation, cybersecurity, and data handling for connected sleep platforms central to early regulatory planning.
Value Chain Analysis
The sleep tech devices value chain begins with sensor, electronics, and component inputs (PPG/ECG modules, accelerometers, radar/ultrasound elements in some concepts, batteries, plastics, and textiles), then moves through industrial design, firmware, and algorithm development, followed by assembly and quality systems. Medical-grade categories, including CPAP-related therapy and clinically positioned diagnostics, typically follow regulated design controls, verification and validation, and documentation aligned to regional requirements, while consumer-focused wearables emphasize rapid iteration and app-driven feature delivery. As a result, the software and data layer has become a primary value capture point, with brands monetizing subscriptions, coaching, and remote monitoring by linking device data to clinician dashboards and payer or employer programs.
Downstream routes split between clinical channels and consumer channels. For therapy and home sleep testing, distribution often involves sleep labs, hospitals, and DME/HME providers that handle prescriptions, reimbursement paperwork, and adherence workflows (including cloud monitoring platforms used in CPAP ecosystems). For wearables and non-wearables, direct-to-consumer e-commerce and large-format retail remain important, alongside partnerships that embed sleep analytics into broader hardware ecosystems and smart-home platforms. Supply risk clusters in semiconductor and sensor availability and in globalized assembly footprints for consumer devices, while regulated products face longer lead times tied to testing, documentation, and post-market surveillance requirements.
Competitive Landscape
Competition is intensifying as consumer electronics leaders exploit their installed bases to layer medical features onto mainstream devices. ResMed and Philips still command about 60% of the therapeutic hardware space yet increasingly contend with wearables that claim diagnostic-grade accuracy. Apple’s September 2024 clearance enables it to target 936 million potential sleep apnea users through its existing smartwatch ecosystem. Oura, a private firm, scaled revenue to USD 500 million in 2024 by combining hardware margins with a subscription share above 30%.
Eight Sleep employs a hardware-as-a-service model, charging monthly fees to deliver continuous firmware upgrades and concierge support, thereby insulating itself from the commoditization of hardware. Qualcomm amassed a dozen 2024 patents covering low-power neural processors that underpin next-generation wearables, while Google advances Soli radar for contactless monitoring. Smaller innovators such as Dreem SAS secure high-grade EEG accuracy but struggle with distribution scale, revealing a barrier for clinically focused startups.
White-space opportunities lie in pediatric monitoring and sub-USD 100 wearables optimized for offline analytics in emerging markets. As reimbursement frameworks mature and regulators close the gap between wellness and medical devices, incumbents with silicon design capabilities and cloud platforms will likely consolidate their share.
Sleep Tech Devices Industry Leaders
-
Casper
-
Compumedics Limited
-
Huawei Technologies Co., Ltd.
-
Nihon Kohden Corporation
-
Koninklijke Philips N.V.
- *Disclaimer: Major Players sorted in no particular order
Market Opportunities and Future Outlook
One major opportunity area is the continued migration from clinic-centric sleep diagnostics to validated home pathways, supported by clear regulatory and payer signals. The United Kingdom NICE endorsement of multiple home tests (December 2024) and Medicare reimbursement policy that raised coverage for home testing to 80% of the allowable amount in 2025, along with FDA clearances such as ResMed NightOwl (April 2025), create room for lower-friction home sleep testing solutions, including disposable formats. There is also demand for platforms that connect test results to therapy initiation and ongoing adherence monitoring within clinician workflows.
Another visible whitespace is building clinical-grade evidence and standardized outcomes for consumer-grade sleep tracking as the market moves from proprietary sleep scores to measures clinicians can use. Activity in 2026 reinforces this direction: the American Academy of Sleep Medicine referenced expanding use of AI-enabled physiological analysis in research settings (Q1 2026), while emerging noninvasive stimulation concepts progress through human testing, including the University of Texas at Austin work on an ultrasound patch (NEUSLeeP) reported in July 2026. Together, these developments support opportunities for manufacturers that pair new sensing or stimulation modalities with robust validation, privacy-by-design data governance (GDPR/HIPAA alignment), and interoperable data pipelines that can integrate with care delivery and employer or insurer programs.
Recent Industry Developments
- June 2026: Nihon Kohden broadened the positioning of its NomadAir with Connect at-home sleep apnea diagnostic workflow into dental sleep medicine, following its 2026 rollout communications. The update expands the buyer set beyond sleep physicians and labs to dental providers involved in oral appliance therapy, tightening the diagnostic-to-therapy loop through connected data sharing.
- September 2025: Compumedics Limited received FDA 510(k) clearance for the Somfit-D single-use home sleep testing device. The clearance expands its US home sleep testing portfolio by adding a disposable option alongside reusable formats, supporting higher-throughput deployments and simplifying logistics for testing programs.
- December 2024: NICE in the United Kingdom endorsed multiple home sleep tests, including AcuPebble SA100, as part of guidance that legitimized lower-cost, out-of-lab diagnostic options. This payer-facing validation reduced reliance on in-lab polysomnography for appropriate pathways and encouraged suppliers to compete on ease of use, per-test economics, and clinical evidence.
Research Methodology Framework and Report Scope
Market Definition and Coverage
For this methodology, the sleep tech devices market covers device hardware used to monitor, screen, diagnose, or support better sleep outcomes across consumer and care settings, including connected wearables and non-wearable devices used for common sleep disorders.
Scope exclusions: We exclude sleep apps or coaching services sold without a device, plus general bedroom furniture and non-medical supplements.
Segmentation Overview
- By Product Type
- Wearables
- Smart Watches & Bands
- Smart Rings
- Other Wearable Devices
- Non-Wearables
- Sleep Monitors (Under-Mattress / Bedside)
- Smart Beds & Mattresses
- Other Non-Wearable Devices
- Wearables
- By Application
- Insomnia
- Obstructive Sleep Apnea
- Narcolepsy
- Restless Leg Syndrome & Other Disorders
- By End User
- Hospitals
- Sleep Labs & Clinics
- Homecare Settings
- Wellness Centers & Corporate Programs
- By Distribution Channel
- Online (E-Commerce & D2C)
- Offline Retail & Specialty Stores
- Geography
- North America
- United States
- Canada
- Mexico
- Europe
- Germany
- United Kingdom
- France
- Italy
- Spain
- Rest Of Europe
- Asia-Pacific
- China
- Japan
- India
- Australia
- South Korea
- Rest Of Asia-Pacific
- Middle East And Africa
- GCC
- South Africa
- Rest Of Middle East And Africa
- South America
- Brazil
- Argentina
- GCC
- Rest Of South America
- Turkey
- North America
Data Sources, Market Sizing, and Validation
Desk Research
Desk research started with mapping what counts as a sleep tech device and where demand shows up in the real world. We relied on public health and burden-of-disease indicators, device usage patterns, and care pathway signals to keep the market tied to measurable need.
Common inputs came from open and official sources such as CDC sleep and sleep disorder statistics, NIH and NHLBI content for sleep health, WHO health data, OECD health indicators, and peer reviewed clinical journals covering sleep apnea and insomnia diagnostics. We also used company filings, investor presentations, product regulatory listings where available, and reputable press to understand launches, pricing direction, and channel shifts. For normalization and cross checks, we used paid subscriptions for company financials and intelligence, plus a patent database to track device innovation themes. These sources are illustrative only, and additional references were used to collect data, validate assumptions, and clarify gaps.
Primary Interviews and Surveys
Primary work focused on aligning the model with how devices are actually purchased and used, which differs by disorder focus and setting. We spoke with stakeholders across device makers, distributors and retail channels, sleep labs and clinics, homecare providers, and clinical experts, and we balanced coverage across major regions to avoid over-weighting any one market. The respondent input was used to refine how we treat device-led pathways, especially where home testing and lab testing split.
Distribution of primary research fieldwork respondents
| Company type | Respondent position | Region |
|---|---|---|
| Top tier: 34% | CXOs: 13% | APAC: 45% |
| Mid tier: 44% | Functional/Unit leaders: 27% | EMEA: 37% |
| Smaller Players: 22% | Managers: 60% | Americas: 18% |
Market-Sizing & Forecasting
Sizing was built using a top-down demand pool approach where prevalence and diagnosis patterns for key sleep disorders are translated into addressable device need, then shaped by adoption rates across homecare, sleep labs, and hospital pathways. After this demand view was in place, selective bottom-up checks were used, such as sampled ASP x volume builds by device group and channel checks, to adjust totals when pricing or mix looked off.
Inputs were chosen because they are traceable and can be refreshed, including sleep disorder prevalence and screening rates, share of home sleep testing versus lab testing, penetration of wearables for sleep tracking, replacement cycles for durable devices, and regional pricing differences tied to reimbursement and retail mix. Where country-level indicators were missing, we handled gaps through proxying from similar markets using income levels and care access, then confirmed the directional estimates through expert feedback.
For the forecast, scenario analysis was used so growth can flex with changes in diagnosis intensity, online channel expansion, and the pace of feature upgrades that influence replacement. The final curve was kept practical by tying each scenario to variables that can be monitored annually.
Data Validation & Update Cycle
After the first model run, outputs were compared against independent signals such as device adoption narratives from interviews, changes in disorder screening intensity, and broad direction in healthcare spending and consumer electronics. Any large jumps were rechecked at the assumption level, and outliers were traced back to either a pricing input, an adoption rate, or a region weighting.
Before sign-off, the work goes through multi-step analyst review where calculations, unit logic, and currency timing are checked, followed by targeted re-contact when a key assumption shows high sensitivity. Reports are refreshed annually, with interim updates when material events shift pricing, reimbursement access, or channel structure. Right before delivery, a fresh pass is completed so clients receive the latest updated view.
Mordor Intelligence's Sleep Tech Devices Market Size Compared With Other Published Estimates
Published market sizes for sleep tech devices do not always match because publishers draw the boundary in different places and then apply different pricing and adoption assumptions. The year used as the starting point, the way currency is converted, and how quickly assumptions are refreshed can also move the final number.
By tracking disorder-led demand indicators and then refreshing key adoption and ASP inputs with interview checks, Mordor Intelligence keeps the total focused on device hardware tied to sleep monitoring and intervention, instead of blending in app-only revenue or broad wellness spending.
Benchmark comparison
| Source | Market Size | Gaps in Research Methodology |
|---|---|---|
| Mordor Intelligence | USD 34.74 B (2026) | |
| Global Consultancy A | USD 29.30 B (2025) | Uses an earlier base year and appears to treat 2025 as the anchor, which can understate value when recent price mix shifts and adoption gains are not carried into the base. |
| Trade Journal B | USD 20.52 B (2024) | Broader sleep tech framing is often reported at a higher level with lighter device scope controls, and the older base year can miss the current split toward higher value non-wearables and home testing devices. |
The spread in the table mostly comes down to time base, what is counted as device revenue, and how pricing is updated as product mix changes. When the scope is kept to device hardware and the inputs are tied to measurable care and consumer adoption signals, the size becomes easier to explain and to replicate from year to year.
Key Questions Answered in the Report
What is the current valuation of the sleep tech devices market?
The sleep tech devices market size reached USD 34.74 billion in 2026 and is projected to climb to USD 79.88 billion by 2031.
Which product category holds the largest revenue share?
Wearables lead the field, accounting for 65.43% of 2025 revenue thanks to their continuous monitoring and subscription models.
Which region is expected to expand fastest through 2031?
Asia-Pacific posts the quickest growth with a forecast 19.43% CAGR, driven by urbanization and rising middle-class spending.
How are regulatory changes influencing adoption?
FDA and Medicare decisions that reimburse home sleep tests at higher rates reduce barriers and accelerate at-home diagnostics.
What factors limit mass-market penetration?
High device prices and persistent data-privacy concerns continue to constrain uptake, especially in emerging economies.
Which application segment is growing most rapidly?
Devices aimed at managing narcolepsy show the highest growth, projecting a 20.55% CAGR as pediatric approvals widen the user base.