
Market Overview
| Study Period | 2021 - 2031 |
|---|---|
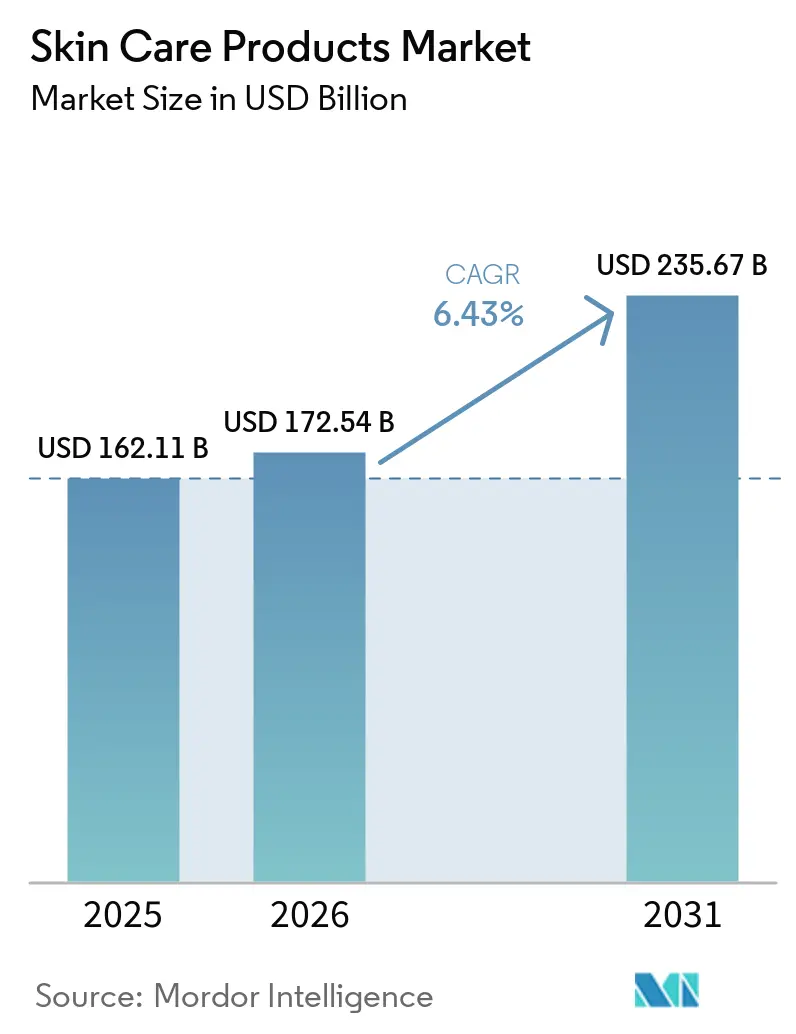
| Market Size (2026) | USD 172.54 Billion |
| Market Size (2031) | USD 235.67 Billion |
| Growth Rate (2026 - 2031) | 6.43 % |
| Fastest Growing Market | Asia Pacific |
| Largest Market | Asia Pacific |
| Market Concentration | Medium |
Major Players *Disclaimer: Major Players sorted in no particular order Image © Mordor Intelligence. Reuse requires attribution under CC BY 4.0. | |
Skin Care Products Market Analysis by Mordor Intelligence
Skin care products market size in 2026 is estimated at USD 172.54 billion, growing from 2025 value of USD 162.11 billion with 2031 projections showing USD 235.67 billion, growing at 6.43% CAGR over 2026-2031. As consumers increasingly seek science-backed, high-efficacy products, the skin-care products industry is witnessing steady growth. South Korea, a leader in Asian markets, is at the forefront of innovations, introducing trends like snail mucin serums and ginseng creams, which align with the rising multi-step, cosmeceutical trend. Platforms like TikTok have revolutionized brand visibility and sales dynamics. For instance, Glow Recipe’s Watermelon Glow AHA Night Treatment and Pore-Tight Toner saw surges in popularity, directly boosting sales and integrating social-commerce storefronts within the app. Sustainability is shaping product development: brands are reformulating body lotions with sugarcane-derived squalane to lessen environmental impact and introducing refillable hyaluronic creams to cut down on packaging waste. Furthermore, as counterfeiting becomes a growing concern, luxury facial creams are now equipped with QR-code authentication, and premium lip balms come with tamper-evident packaging to guarantee authenticity.
Key Report Takeaways
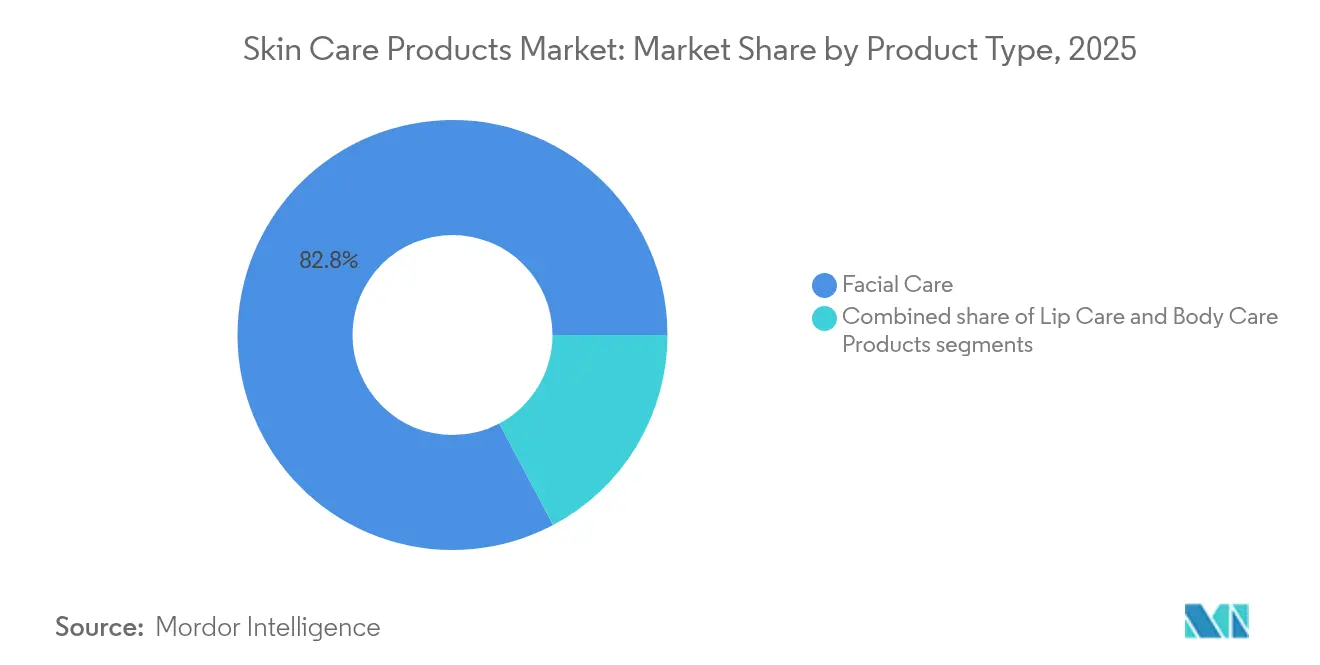
- By product type, facial care captured 82.75% of the skin care products industry share in 2025 and is progressing at a 6.46% CAGR through 2031.
- By category, the mass segment held 67.65% revenue share in 2025, while the luxury/premium tier is forecast to expand at a 7.21% CAGR to 2031.
- By end user, women commanded 89.20% of 2025 sales, whereas the kids segment is registering the highest projected CAGR at 8.33% over the forecast horizon.
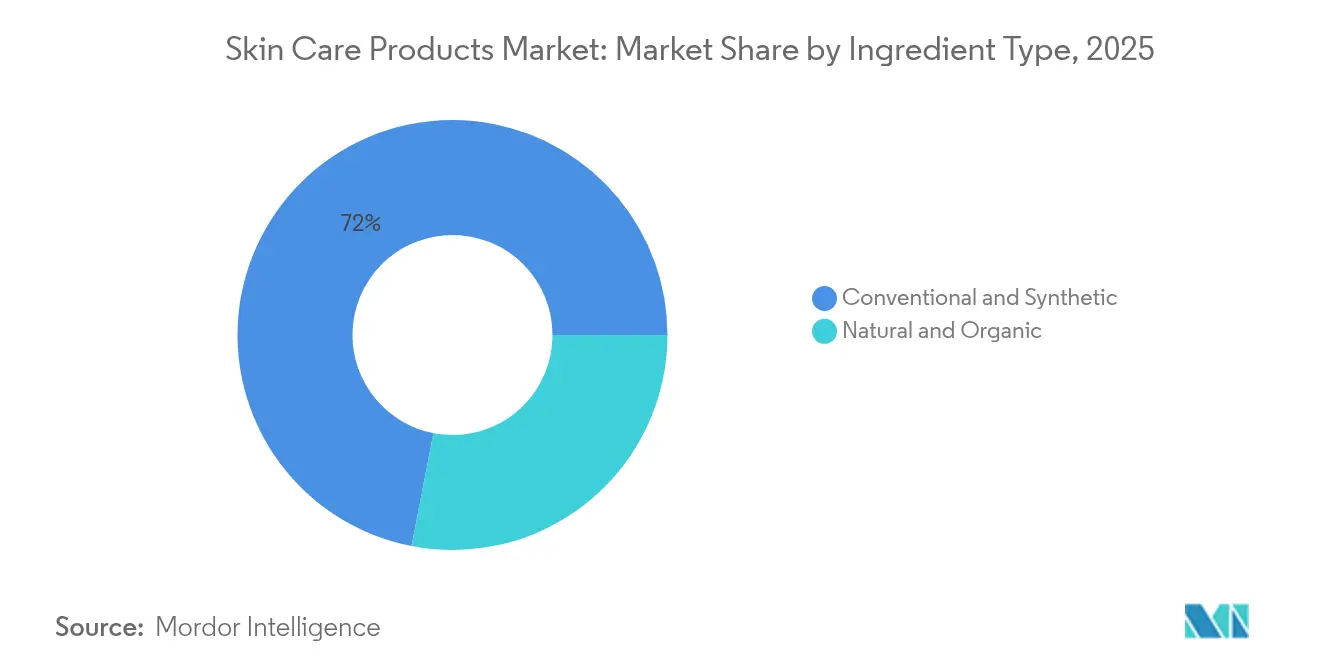
- By ingredient type, conventional and synthetic inputs contributed 71.95% of 2025 revenue, yet natural and organic formulations are advancing at a 6.71% CAGR through 2031.
- By distribution channel, health and beauty stores led with 34.20% share in 2025; online retail is the fastest-growing path to purchase with a 7.62% CAGR to 2031.
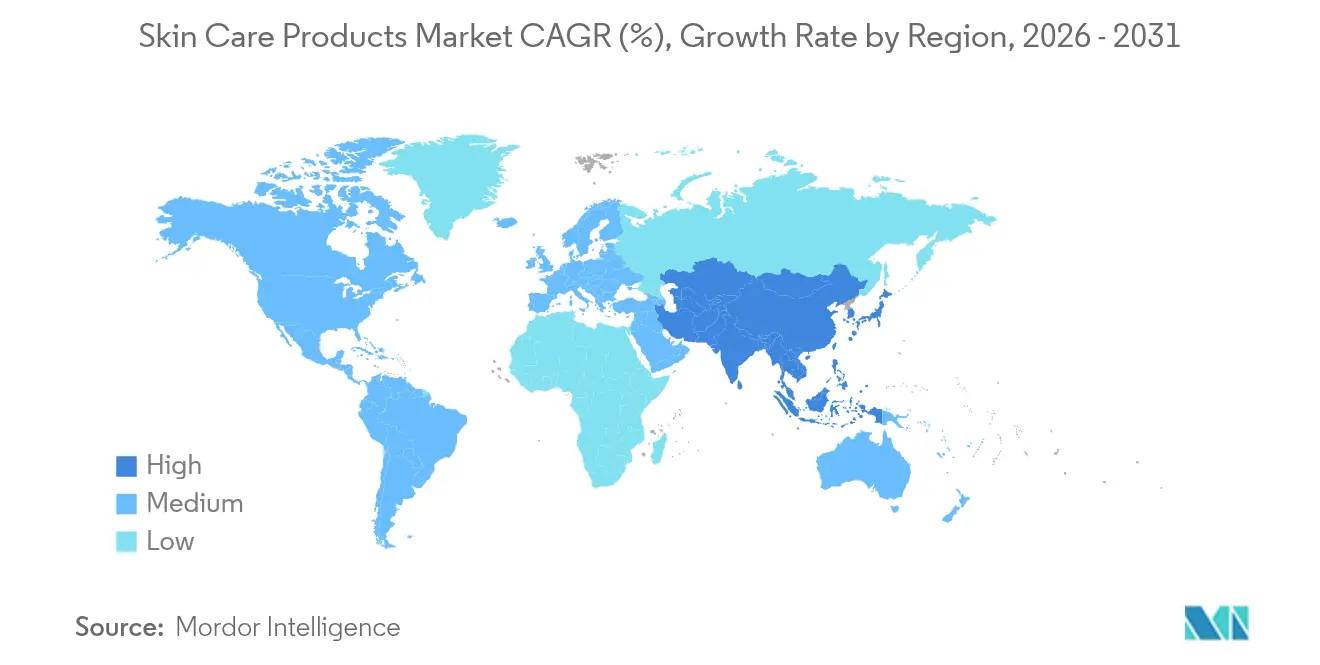
- By geography, Asia-Pacific held 37.40% of global 2025 revenue and is the fastest-growing region with a 7.38% CAGR projected through 2031.
Note: Market size and forecast figures in this report are generated using Mordor Intelligence’s proprietary estimation framework, updated with the latest available data and insights as of 2026.
Market Trends and Insights
Drivers Impact Analysis of Skin Care Products Market*
| Driver | (~) % Impact on CAGR Forecast | Geographic Relevance | Impact Timeline |
|---|---|---|---|
| Consumer inclination toward organic and natural products | +1.2% | North America, Europe, emerging Asia | Medium term (2-4 years) |
| Influence of social media and celebrity endorsement | +0.9% | Asia-Pacific, North America | Short term (≤2 years) |
| Technological innovations in product formulations | +1.1% | Developed markets worldwide | Long term (≥4 years) |
| Increasing demand for anti-aging products | +1.0% | Premium segments globally | Medium term (2-4 years) |
| Growing demand for multifunctional facial care products | +0.8% | Urban centers worldwide | Medium term (2-4 years) |
| Growing awareness regarding skin-related issues | +0.7% | Global | Short term (≤2 years) |
| Source: Mordor Intelligence | |||
Consumer Inclination Towards Organic and Natural Products
As consumers prioritize transparency, safety, and ingredient integrity, the facial care products market is shifting towards natural, organic, and scientifically-backed solutions. Urban and premium-market shoppers are opting for gentle, plant-based, or clinically-proven alternatives, steering clear of synthetic additives, harsh chemicals, and artificial fragrances. A March 2025 study by NSF, a global public health and safety organization, revealed that 74% of consumers deem organic ingredients vital in beauty and personal care products, highlighting the surge of the clean beauty movement [1]. In response, brands are revamping their offerings - from moisturizers and serums to toners and cleansers - infusing them with trusted botanicals like aloe vera, chamomile, and green tea, and opting for coconut-derived surfactants for a milder cleanse. Industry stalwarts like Weleda and Dr. Hauschka champion COSMOS- and NATRUE-certified lines, while Tata Harper emphasizes farm-to-face formulations. Herbivore Botanicals caters to the ingredient-conscious with its minimalist lists, and Dr. Weil melds mushroom-based actives with clinically-validated blends in his serums and creams. Today's consumers are delving deep into labels, sourcing, and efficacy online before making a purchase. This research-driven approach has fueled demand for products like antioxidant-rich vitamin C serums, probiotic moisturizers, and other facial care products.
Technological Innovations in Product Formulations
As consumers increasingly seek targeted solutions, the facial care products market is undergoing a significant transformation. Shoppers now prioritize products that tackle specific issues, from sensitivity and dullness to acne, pigmentation, and environmental stress. Formulations are now centered around active ingredients like niacinamide, hyaluronic acid, vitamin C, and ceramides, offering benefits that span barrier repair, hydration, brightening, and anti-aging. Aveeno’s 2024 State of Skin Sensitivity report highlights this trend, revealing that 71% of global consumers report skin sensitivity [2]. This statistic underscores the growing demand for gentle yet effective products, steering clear of harsh surfactants, allergens, and superfluous fragrances. Brands are rising to the occasion, introducing science-backed, dermatologist-tested innovations that redefine the skincare industry landscape. For instance, Plum and Deconstruct are making waves with their fragrance-free serums, moisturizers, and cleansers tailored for acne and redness-prone skin. Meanwhile, CeraVe is championing barrier support by integrating ceramide complexes into its cleansers, creams, and facial lotions. The trend of multifunctionality is evident in products like Dot & Key’s Cica and Niacinamide Face Wash with SPF 20 and Laneige’s Radian-C Cream, which meld hydration with brightening properties. This evolution underscores a market increasingly driven by ingredient transparency, performance, and bespoke solutions, catering to a discerning audience that demands results.
Increasing Demand for Anti-Aging Products
As consumers increasingly prioritize prevention and visible results, the demand for anti-aging products is propelling growth in the skincare market. Shoppers are gravitating towards multifunctional solutions: retinol-infused moisturizers, peptide-rich serums, and antioxidant creams. These products not only tackle fine lines and uneven skin tone but also hydrate and protect. Premium brands are taking notice. Estée Lauder has broadened its Advanced Night Repair line to include targeted eye treatments. Meanwhile, L’Oréal Paris is rolling out combinations of hyaluronic acid and retinol in both serums and sheet masks, aiming for a broader audience. K-beauty frontrunners, Sulwhasoo and Laneige, are merging traditional botanicals like ginseng with contemporary delivery methods, catering to consumers who seek both efficacy and a natural touch. Even mainstream brands like Olay and Pond’s are revamping their day creams and night masks, infusing them with actives like niacinamide and collagen boosters. This move not only makes anti-aging solutions accessible to younger consumers but also highlights how preventive care is shaping trends in the skincare market. With a steady stream of innovations and social media amplifying education on early skin aging, consumers of all ages are now weaving anti-aging products into their daily routines, boosting both product frequency and market penetration.
Influence of Social Media and Celebrity Endorsement
In 2024, the skin care products industry is witnessing rapid growth, largely driven by social media and celebrity endorsements. A survey from the University of Portsmouth in 2024 found that 60% of consumers place their trust in influencer recommendations, with nearly half of all purchasing decisions influenced by these endorsements [3]. Platforms like TikTok and Instagram frequently catapult niche products into global bestsellers. For instance, Glow Recipe’s Watermelon Glow Niacinamide Dew Drops saw a surge in demand after trending in skincare routines, and Drunk Elephant’s Bronzing Drops gained widespread attention through influencer tutorials. Brands founded by celebrities are further propelling this expansion. Hailey Bieber’s Rhode has garnered a loyal following for its peptide lip treatments and barrier creams. Rihanna’s Fenty Skin consistently launches SPF-infused moisturizers and cleansers tailored for diverse skin tones. Meanwhile, Kim Kardashian’s SKKN by Kim is championing minimalist, active-rich facial care systems. These endorsements not only heighten brand awareness but also encourage consumers to explore new categories, reshaping trends in the skincare industry from overnight masks to multi-tasking serums and skin barrier repair creams. This has led to an increase in both purchase frequency and average spending.
Restraints Impact Analysis of Skin Care Products Market*
| Restraint | (~) % Impact on CAGR Forecast | Geographic Relevance | Impact Timeline |
|---|---|---|---|
| Proliferation of counterfeit products | -0.8% | Developing e-commerce markets | Short term (≤2 years) |
| Health concerns over chemical ingredients | -0.6% | North America, Europe | Medium term (2-4 years) |
| Growing adoption of at-home skin treatment services | -0.4% | High-income developed markets | Long term (≥4 years) |
| Fluctuating raw-material prices | -0.5% | Global | Short term (≤2 years) |
| Source: Mordor Intelligence | |||
Proliferation of Counterfeit Products
Counterfeit skin care products are undermining market growth by eroding consumer trust, diverting revenue from genuine brands, and shaking confidence in both online and offline sales channels. Often laced with harmful or ineffective ingredients, these counterfeit creams lead to adverse outcomes, pushing consumers away from authentic products. In early 2025, U.S. Customs and Border Protection intercepted fake luxury creams, including Estée Lauder and Clinique serums, en route to Pennsylvania. This incident underscores the infiltration of counterfeit items into mainstream distribution, siphoning sales from premium brands. In a parallel event, Thai authorities in March 2025 dismantled a vast warehouse operation, revealing counterfeit cosmetics worth TBH 46 billion being sold online. Such revelations spotlight the overwhelming presence of counterfeiters in digital marketplaces. These widespread counterfeiting activities compel brands to allocate resources towards enforcement and damage control. This not only weakens consumer confidence but also decelerates the industry's growth. Furthermore, the persistence of large-scale counterfeiting stifles innovation, hampers new product launches, and invites heightened regulatory scrutiny, erecting additional hurdles to market expansion.
Growing Adoption of At-Home Skin Treatment Services
As consumers increasingly turn to at-home skin treatment services, traditional skincare products are feeling the pinch. Devices like LED masks, microcurrent tools, and laser gadgets are becoming the go-to for many, often sidelining topical creams and serums. Take, for example, Foreo’s UFO 2 mask treatment and NuFace’s microcurrent facial toning device; both are emerging as popular substitutes for extensive daily routines. Dr. Dennis Gross Skincare’s LED masks and L’Oréal’s foray into personalized beauty tech underscore this tech-driven consumer shift. While many of these devices still pair with serums or gels, they narrow the demand to specific products, curbing broader category purchases. Dermatologists have voiced concerns over potential misuse of devices like LED masks, which can exacerbate issues such as melasma. This has led companies to pivot resources towards safety education and compliance, rather than focusing solely on core formulation innovations. With media and retail amplifying the visibility of these devices, a notable shift in consumer spending and trust is evident. This trend is not just reshaping purchasing behaviors but is also pushing established brands to reevaluate their product development and marketing strategies.
*Our forecasts treat driver/restraint impacts as directional, not additive. The impact forecasts reflect baseline growth, mix effects, and variable interactions.
Skin Care Products Market Segment Analysis
By Product Type:
Facial Care Dominance Drives InnovationIn 2025, facial care products command a dominant 82.75% share of the skincare market, emerging as both the largest and the fastest-growing segment, projected to expand at a 6.46% CAGR through 2031. This trend underscores consumers' heightened focus on facial routines, largely driven by concerns like aging, acne, and hyperpigmentation. Brands are responding with cutting-edge, science-driven formulations. For instance, Shiseido’s Ultimune Power Infusing Concentrate and Olay’s Regenerist Micro-Sculpting Cream are marketed as potent anti-aging solutions.
Meanwhile, La Roche-Posay’s Vitamin C10 serum and Clarins’ Double Serum underscore the rising demand for concentrated actives. Additionally, face masks bolster this segment's growth, with L’Oréal’s Revitalift Derm Intensives sheet masks and Kiehl’s overnight hydration masks leading the charge, due to their convenience and visible results. Moreover, body care, often swayed by hydration needs and seasonal trends, sees brands like Nivea and Vaseline catering to the mass market. Lip care, though niche, remains steadfast, with premium offerings like Dior’s Lip Glow Oil and Laneige’s Lip Sleeping Mask ensuring consumer loyalty through targeted benefits.

By Category:
Premium Segment Captures Value MigrationIn 2025, the mass segment commands a dominant 67.65% share of the global skincare products market, due to its affordability and extensive distribution in both developed and emerging regions. Catering primarily to price-sensitive consumers, this segment addresses fundamental skincare needs. Brands like Nivea and Garnier anchor the demand with everyday essentials like moisturizers, cleansers, and lotions. These brands are also evolving, introducing value-driven innovations to meet changing consumer preferences. To stay competitive, players in the mass segment are rolling out budget-friendly product lines infused with sought-after ingredients like hyaluronic acid and vitamin C, offering a premium feel without the hefty price tag.
On the other hand, the luxury and premium segment is witnessing the fastest growth, expanding at a 7.21% CAGR. Today's consumers are placing greater emphasis on product efficacy, scientifically-backed claims, and ingredient transparency, often sidelining price. Brands such as Estée Lauder, with its Advanced Night Repair, and Lancôme's Génifique serums, are at the forefront, providing clinically validated formulations that appeal to those willing to invest in visible results. This trend of premiumization is especially pronounced in the Asia-Pacific region, where a surge in social media-driven beauty awareness is fueling demand for luxury products and continues to transform the skincare industry. While mass products still lead the market, niche categories like lip care and body care are holding their ground. Innovations, including Laneige’s Lip Sleeping Mask and The Body Shop’s body butters, are keeping consumers engaged.
By End User:
Women's Dominance Challenged by Emerging SegmentsIn 2025, women command a dominant 89.20% share of the global facial care product market. Their leadership is driven by a commitment to comprehensive skincare routines, encompassing everything from cleansers and serums to moisturizers and masks. Moreover, they exhibit a pronounced willingness to experiment with new formats and ingredients. Esteemed brands like Estée Lauder and Lancôme are reaping the rewards of women's embrace of premium anti-aging lines. Simultaneously, K-beauty stalwarts such as Innisfree and Sulwhasoo are deepening engagement through their signature multi-step regimens. This unwavering dedication positions women as the most influential consumer base, bolstering demand across both mass and premium market segments.
Parents' proactive approach to skincare and the early adoption of these practices by younger consumers have propelled the kids’ category to the forefront, boasting an impressive 8.33% CAGR. Brands like Bubble Skincare and Evereden are capitalizing on this trend with their youth-centric lines. Meanwhile, the men's segment, especially in the Asia-Pacific region, is emerging as a significant opportunity in the skincare market, driven by changing grooming perceptions. Brands such as L’Oréal Men Expert and Shiseido Men are witnessing a surge in popularity, reflecting a shift in grooming attitudes where skincare is increasingly viewed as essential. These evolving dynamics hint at a broader demographic transition, reshaping traditional age and gender patterns and expanding the market's growth horizons beyond its historically female-centric focus.
By Ingredient Type:
Natural Ingredients Gain MomentumIn 2025, conventional and synthetic ingredients command a dominant 71.95% share of the global skin care products industry, a testament to their proven effectiveness, consistency, and affordability. These ingredients form the backbone of popular lines, such as L’Oréal’s Revitalift creams, which harness synthetic retinol for reliable anti-aging results, and Neutrogena’s Hydro Boost range, anchored in hyaluronic acid for consistent hydration at a budget-friendly price. Their reliable performance and scalable production solidify these ingredients' role in mass-market formulations across the industry.
On the other hand, natural and organic ingredients are rapidly gaining ground, expanding at a robust 6.71% CAGR. This surge is driven by consumers' growing emphasis on ingredient transparency, environmental sustainability, and clean-label formulations. Leading this transformation are brands like True Botanicals and OSEA. True Botanicals garners praise for its organic, wildcrafted offerings, such as the Pure Radiance Oil, which enhances skin texture and luminosity. Meanwhile, OSEA champions eco-consciousness with its seaweed-infused, plant-based skincare line. Reinforcing the clean-beauty movement, brands like Herbivore Botanicals, Juice Beauty, and 100% PURE offer ethically sourced or organic products, striking a chord with environmentally and health-conscious consumers. Furthermore, biotech innovations, exemplified by bio-derived squalane, are carving a niche by merging synthetic-level efficacy with a natural allure.
By Distribution Channel:
Digital Transformation AcceleratesIn 2025, health and beauty stores command a dominant 34.20% share of the skin care products industry, bolstered by their curated selections and trusted expertise, which boost consumer confidence. Retail giants like Sephora and Ulta Beauty lead the pack, blending global and niche brands with in-store consultations and exclusive launches, setting them apart from general retailers. Their knack for merging product discovery with personalized service keeps them relevant, even as consumers increasingly pivot to online shopping.
Conversely, online retail emerges as the fastest-growing channel, boasting a 7.62% CAGR, driven by consumer preferences for convenience, competitive pricing, and peer reviews. E-commerce behemoths like Amazon and Tmall Global play pivotal roles, especially for premium and niche brands eyeing digitally savvy shoppers. Supermarkets and hypermarkets, with players like Walmart and Carrefour, cater to everyday skincare needs through broad distribution and competitive pricing. Pharmacies and specialty retailers, such as Boots and Douglas, focus on niche segments, offering clinical skincare and organic products. This diverse distribution landscape highlights a channel convergence, where entities like Sephora, through its partnership with Kohl’s, and Amazon, with its foray into physical beauty retail, stand poised to harness significant growth.
Geography Analysis
APAC Skin Care Products Market
In 2025, the Asia-Pacific region commands a dominant 37.40% share of the global skin care products industry and is poised to lead growth with the fastest CAGR of 7.38% through 2031. This trend underscores the region's deep-rooted beauty culture, increasing incomes, and the surge of digital retail. Anchoring this dominance are China, Japan, and South Korea, where consumers are adopting sophisticated beauty routines that transcend basic care. Local brands exemplify this strength: Shiseido from Japan pioneers high-tech anti-aging innovations, reaffirming Asia-Pacific’s leadership in the global skincare market. South Korea's Amorepacific rides the global wave of K-beauty with its popular sheet masks and serums, and China's Proya caters to Gen Z's appetite for affordable yet effective skincare. These industry players underscore Asia-Pacific's dual leadership in both scale and innovation, setting global beauty benchmarks.
North America and Europe Skin Care Products Market
North America and Europe, while mature markets, wield significant influence in the skincare domain. Here, premiumization and stringent regulatory oversight shape consumer choices. Although growth rates lag behind Asia's, these regions champion a demand for clinically validated, science-backed formulations. In North America, brands like Estée Lauder and CeraVe (under L’Oréal) have garnered consumer trust, due to their dermatological credibility and cutting-edge research and development. Meanwhile, across the Atlantic in Europe, L’Oréal Paris and Beiersdorf’s Nivea stand tall, bolstered by robust brand equity and adherence to stringent EU safety standards. These dynamics showcase how, even in a crowded marketplace, trust is cultivated through transparency, rigorous research, and a premium brand positioning.
MEA and South America Skin Care Products Market
Regions like South America, the Middle East, and Africa, though currently holding smaller market shares, are witnessing a surge in beauty demand, fueled by economic growth and evolving cultural dynamics. In South America, Brazilian giant Natura & Co. champions sustainable and ethically sourced skincare, making waves both locally and on the global stage. The UAE's Huda Beauty, renowned in color cosmetics, is making significant inroads into skincare. Meanwhile, in Africa, Shea Radiance from Nigeria is harnessing indigenous ingredients to cater to both local and diaspora markets. These developments underscore how regional heritage, abundant natural resources, and a burgeoning middle class are charting distinct growth paths in the global skincare arena.
Regulatory Landscape
Regulation continues to tighten around ingredient safety, traceability, and manufacturer accountability across major skin care markets. In the United States, the FDA is implementing the Modernization of Cosmetics Regulation Act of 2022 (MoCRA), which introduces requirements such as facility registration with biennial renewal and product listing for cosmetic manufacturers and processors, raising the baseline for documentation and quality systems across both mass and premium skin care portfolios.
In Europe, the cosmetics framework under Regulation (EC) No 1223/2009 has been updated through new restrictions in 2026. Commission Regulation (EU) 2026/78 applied in January 2026 to further restrict CMR substances, and Regulation (EU) 2026/909 (April 2026) introduced additional ingredient limits, including a ban on Triphenyl Phosphate and restrictions affecting substances such as Benzyl Salicylate and Citral. In China, the National Medical Products Administration (NMPA) issued Announcement No. 59 of 2026 to adjust the New Cosmetic Ingredient (NCI) approach, narrowing the scope of higher-risk ingredients requiring registration with changes effective July 15, 2026, supporting faster iteration for certain innovation pathways while maintaining oversight for higher-risk inputs.
Competitive Landscape
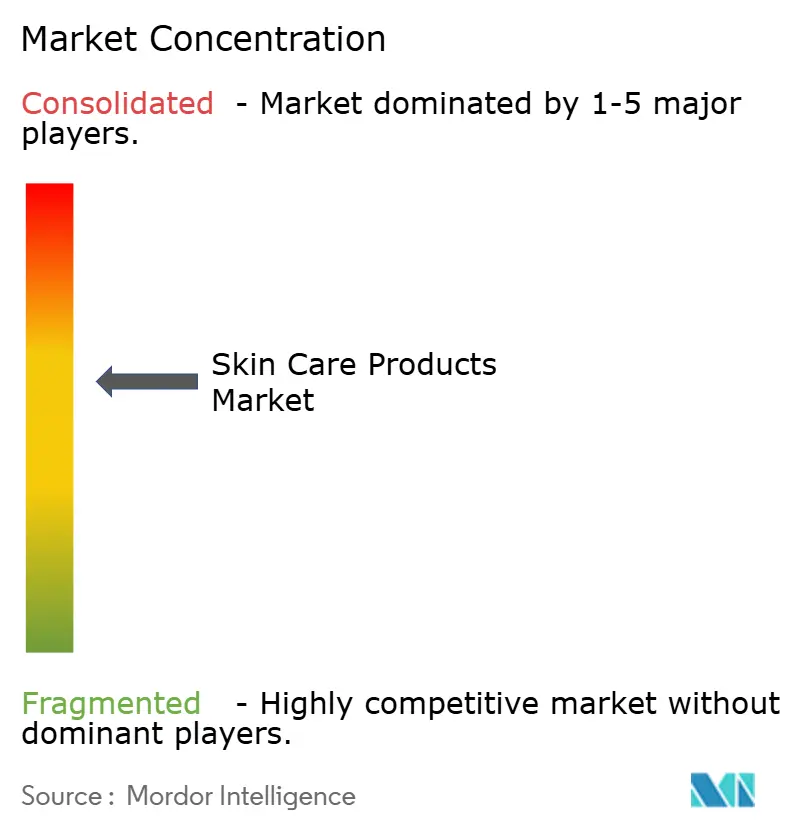
The skin care products industry is moderately consolidated, and marketing strategies increasingly dictate brand visibility and consumer loyalty. Established players like L’Oréal, Unilever, and Estée Lauder emphasize premium positioning through dermatologist-backed claims, influencer collaborations, and heavy investments in experiential retail formats. In contrast, mass-market brands such as Nivea (Beiersdorf) and Olay (P&G) compete on affordability, wide distribution, and product accessibility. Meanwhile, digitally-native disruptors like The Ordinary (DECIEM) and Drunk Elephant prioritize transparency, minimalist ingredient lists, and robust community engagement on platforms like TikTok and Instagram.
Technology adoption has emerged as a pivotal competitive lever within the skincare industry, enhancing personalization and sustainability. L’Oréal has taken the lead with AI diagnostics and augmented reality tools like ModiFace, allowing consumers to virtually test products pre-purchase. Concurrently, Estée Lauder pours resources into predictive analytics for tailored online recommendations. Unilever and Johnson & Johnson harness biotechnology and green chemistry to lessen environmental impact, appealing to eco-conscious consumers.
Smaller challengers utilize advanced contract manufacturing, enabling swift product iterations in response to micro-trends and within the skincare market, keeping pace with shifting consumer preferences, all without hefty research and development budgets. This tech-savvy approach not only enhances consumer engagement but also streamlines efficiency and innovation throughout the supply chain. Strategic growth manifests through partnerships, mergers, and global expansion. L’Oréal’s acquisition of Youth to the People bolstered its presence in the clean, vegan skincare arena. Shiseido, by divesting from mass-market brands, sharpened its focus on premium and Asian-centric lines. Natura & Co. made waves by acquiring Avon, emphasizing ethical sourcing for differentiation.
Skin Care Products Industry Leaders
-
L'Oréal S.A.
-
Unilever PLC
-
Procter & Gamble Company
-
The Estée Lauder Companies Inc.
-
Shiseido Company Limited
- *Disclaimer: Major Players sorted in no particular order
Skin Care Products Market Companies Covered in this Report
- The Procter & Gamble Company
- Unilever PLC
- L'Oreal S.A.
- Kenvue Inc.
- Colgate-Palmolive Company
- Beiersdorf AG
- L'Occitane International S.A.
- The Estee Lauder Companies Inc.
- Shiseido Company, Limited
- Kao Corporation
- Amorepacific Corporation
- Honasa Consumer Limited
- Reckitt Benckiser Group plc
- Coty Inc.
- Church & Dwight Co., Inc.
- Edgewell Personal Care Company
- Natura &Co Holding S.A.
- Unicharm Corporation
- Godrej Consumer Products Limited
- Dabur India Limited
Market Opportunities and Future Outlook
Manufacturing scale-up for premium dermocosmetics skin care appears concentrated where brands can translate science-backed claims into reliable output, especially under higher regulatory scrutiny. In February 2026, Hindustan Unilever Limited approved an INR 2,000 crore, two-year investment to expand manufacturing capacity for premium Beauty and Wellbeing categories, linking new capacity to renewable-energy goals. In May 2026, Laboratoires Pierre Fabre announced a nearly EUR 50 million investment to double production capacity at its Avene plant in France by 2029 as part of a broader 2023-2027 industrial master plan, indicating continued build-out for dermatology-linked skin care supply in Europe.
Compliance-led reformulation and digital substantiation also create near-term opportunity for brands and suppliers that can operationalize ingredient traceability, safety dossiers, and faster reformulation cycles across geographies. EU updates in 2026, including Regulation (EU) 2026/78 and Regulation (EU) 2026/909, add ingredient restrictions and concentration limits that increase the value of modular formulations and regional SKU management, while MoCRA requirements in the United States elevate expectations around facility registration, product listing, and quality documentation. Companies that pair innovation in actives for anti-aging, brightening, and barrier repair with repeatable compliance workflows can better support both online and offline channel execution, including efforts around authentication and transparency to counter counterfeiting risks highlighted in major 2025 enforcement actions.
Recent Industry Developments in Skin Care Products Market
- July 2026: L'Oréal Group signed an agreement to acquire a majority stake in India's Innovist, expanding its exposure to digital-first personal care brands. The agreement increases L'Oréal's access to fast-iteration product development and online-led distribution in one of the fastest-scaling skincare consumption markets.
- June 2026: Procter & Gamble launched the Olay Science Cell Repair collection in the United States via Amazon, bringing a peptide-led range previously sold in Asia to a wider market. The launch shows how major brands use e-commerce as a primary route for cross-region portfolio transfer and faster consumer feedback loops.
- May 2024: Aveeno published its 2024 State of Skin Sensitivity report, highlighting the breadth of sensitivity concerns among consumers. The data point has supported product development emphasis on barrier-support, fragrance-conscious, and dermatologist-tested claims across mass and premium facial care lines.
Skin Care Products Market Report Scope and Research Methodology
Market Definition and Coverage
For this study, the skincare products market covers the sales value of products used to cleanse, moisturize, protect, and treat skin concerns across face, body, and lip use. Value is captured for products sold through retail and professional channels, and then aggregated at a global level.
Scope exclusions: We exclude skin care services, aesthetic procedures, and diagnostic or medical care delivered as a service, even when they are sold alongside products.
Segments Covered in This Report
- Product Type
- Facial Care Products
- Cleansers
- Moisturizers and creams
- Serums and Essence
- Toners
- Face Masks
- Other Facial Care Products
- Body Care Products
- Body Lotion
- Foot and Hand Cream
- Other Body Care Products
- Lip Care Products
- Facial Care Products
- Category
- Mass
- Luxury/Premium
- End User
- Men
- Women
- Kids/Children
- Ingredients Type
- Natural and Organic
- Conventional and Synthetic
- Distribution Channel
- Supermarkets/Hypermarkets
- Health and Beauty Stores
- Online Retail Stores
- Other Channels
- By Geography
- North America
- United States
- Canada
- Mexico
- Rest of North America
- Europe
- Germany
- United Kingdom
- Italy
- France
- Spain
- Netherlands
- Poland
- Belgium
- Sweden
- Rest of Europe
- Asia-Pacific
- China
- India
- Japan
- Australia
- Indonesia
- South Korea
- Thailand
- Singapore
- Rest of Asia-Pacific
- South America
- Brazil
- Argentina
- Colombia
- Chile
- Peru
- Rest of South America
- Middle East and Africa
- South Africa
- Saudi Arabia
- United Arab Emirates
- Nigeria
- Egypt
- Morocco
- Turkey
- Rest of Middle East and Africa
- North America
Data Sources, Market Sizing, and Validation
Desk Research
Desk research was used to set the market boundaries, build a clean demand context, and anchor inputs that can be checked year over year. We referenced public sources such as the US Food and Drug Administration (cosmetics guidance), the European Commission cosmetics rules, UN Comtrade trade statistics, national statistics offices for consumer spending and CPI series, and World Bank macro indicators for currency and income context.
To shape the structure of the model, we also reviewed company annual reports and investor presentations, category updates from major retailer and brand websites, and coverage from reputable business press. Where needed, we used paid subscriptions for company financials and news screening, and patent databases to track new active ingredients and formulation activity. These desk sources are not exhaustive, and other public references were used for cross-checks and clarification during the work.
Primary Interviews and Surveys
Primary work focused on validating what is counted as skincare in practice, and pressure testing pricing and mix changes that do not show up clearly in public series. We spoke with a mix of brand managers, distributors, ingredient-side experts, and retail channel leaders across APAC, EMEA, and the Americas, so assumptions could be confirmed by people closer to purchasing, launches, and promotions.
Distribution of primary research fieldwork respondents
| Company type | Respondent position | Region |
|---|---|---|
| Top tier: 39% | CXOs: 14% | APAC: 46% |
| Mid tier: 45% | Functional/Unit leaders: 31% | EMEA: 29% |
| Smaller Players: 16% | Managers: 55% | Americas: 25% |
Market-Sizing & Forecasting
Sizing starts with a top-down build where category consumption is reconstructed using a mix of public demand signals, and then is aligned to the defined product boundary. In skincare, the model is guided by variables such as per capita beauty and personal care spend, urbanization and income trends, inflation and currency movement, channel shift toward online, and the mix tilt toward sun care, premium facial care, and treatment-led formats (like serums).
Once the global and regional totals are formed, we corroborate them with selective bottom-up approximations such as sampling average selling price bands by channel and multiplying them by estimated unit movement, followed by distributor and retailer channel checks. When a country or subcategory lacks a reliable public time series, gaps are handled using proxy indicators (like CPI for personal care, import trends, and peer-market penetration), and the assumption is re-checked with interviews before being kept.
Forecasting is built using scenario analysis supported by trend-linked inputs, and then adjusted with expert views on promotion intensity, premiumization pace, and product innovation cadence. This approach keeps the forward view explainable, and it remains easy to rerun when a key driver like inflation or currency shifts materially.
Data Validation & Update Cycle
Validation is done in steps so the final number is not driven by one dataset or one assumption. Outputs are compared with independent signals such as trade flows for key finished formats, consumer spending direction, and company-reported category performance, and then any large variances are traced back to either scope, pricing, or mix.
Before sign-off, checks are repeated across regions to catch anomalies like unrealistic price jumps, sudden channel share breaks, or growth that conflicts with macro conditions. Reports are refreshed annually, and interim updates are triggered when major events can change demand or pricing, such as sharp currency moves, new labeling rules, or sudden shifts in channel inventory. Right before delivery, a final analyst pass is completed so the latest updated view is included.
Mordor Intelligence's Skincare Products Market Size Compared Against Other Published Estimates
Published market sizes for skincare products can differ even when they appear to cover the same thing, because the boundary and pricing basis are not always treated the same way. Differences also show up when the base year is set differently, when currency conversion timing changes, or when forecasts assume a faster premiumization curve than what channels can absorb.
By tracking channel mix shifts and refreshing currency and inflation inputs each cycle, Mordor Intelligence places the model on the 2026 value pool for skincare products and keeps services and aesthetic procedures out. This tightens the definition before the forecast is extended.
Benchmark comparison
| Source | Market Size | Gaps in Research Methodology |
|---|---|---|
| Mordor Intelligence | USD 172.54 B (2026) | |
| Global Research Publisher A | USD 155.84 B (2025) | Uses a different base year and a slower growth path, and the page-level summary does not clearly state the value basis (retail versus ex-factory), which can compress the total versus consumer-spend aligned models. |
| Market Analytics Publisher B | USD 145.76 B (2024) | Anchors the series one to two years earlier and may carry forward broader product baskets without clearly separating adjacent beauty categories, which can shift the counted demand pool and the implied price mix. |
The spread across the three numbers is mostly explained by the year used as the anchor and by how cleanly the skincare-only boundary is kept separate from nearby categories. When the model is tied back to observable demand indicators and then re-checked through channel and pricing conversations, the result becomes easier to replicate and update without hidden scope drift.
Key Questions Answered in the Report
Which region leads global spending on skin-care products?
Asia-Pacific holds 37.40% of worldwide revenue and is expanding at a 7.38% CAGR through 2031.
What is the projected value of online beauty sales?
Online skin-care revenue is on track to hit USD 49.95 billion in 2025 and is growing at 7.62% CAGR.
How fast is the premium tier growing versus the mass tier?
Premium lines are accelerating at 7.21% CAGR, outpacing the mass category’s 5.45% rate through 2031.
Why are tech devices relevant to traditional creams and serums?
LED masks and microcurrent tools complement topical actives, steering consumers toward integrated treatment regimens.
What years does this Skincare Products Market cover?
The report covers the Skincare Products Market historical market size for years: 2019, 2020, 2021, 2022, 2023 and 2024. The report also forecasts the Skincare Products Market size for years: 2026, 2027, 2028, 2029, 2030 and 2031.