
Single Use Plastic Packaging Market Size and Share
Market Overview
| Study Period | 2020 - 2031 |
|---|---|
| Market Size (2026) | USD 51.03 Billion |
| Market Size (2031) | USD 61.07 Billion |
| Growth Rate (2026 - 2031) | 3.66 % |
| Fastest Growing Market | Middle East and Africa |
| Largest Market | Asia-Pacific |
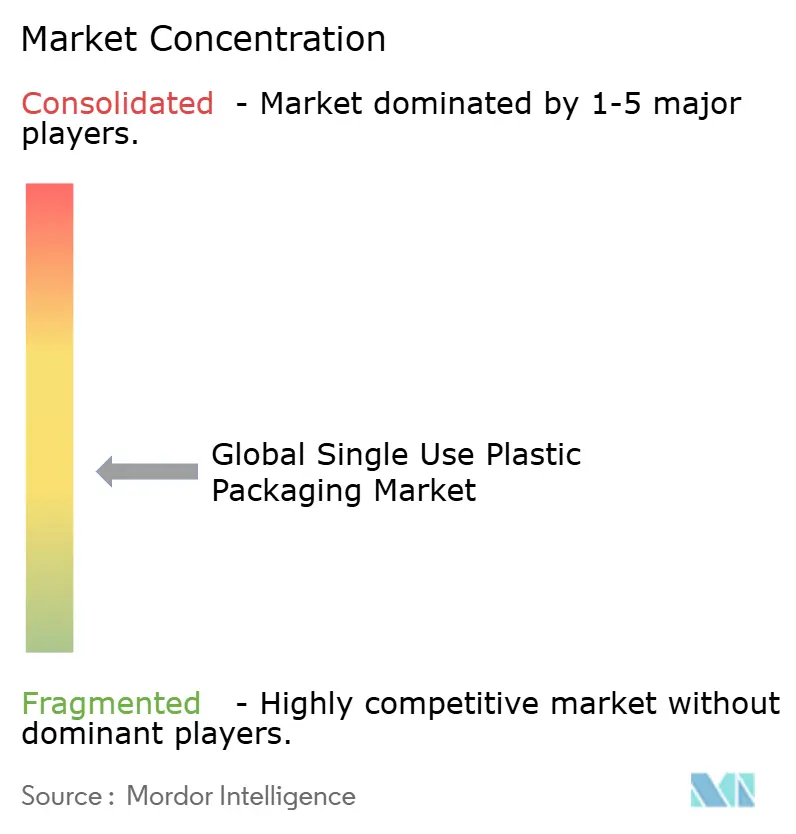
| Market Concentration | Medium |
Major Players *Disclaimer: Major Players sorted in no particular order Image © Mordor Intelligence. Reuse requires attribution under CC BY 4.0. | |
Single Use Plastic Packaging Market Analysis by Mordor Intelligence
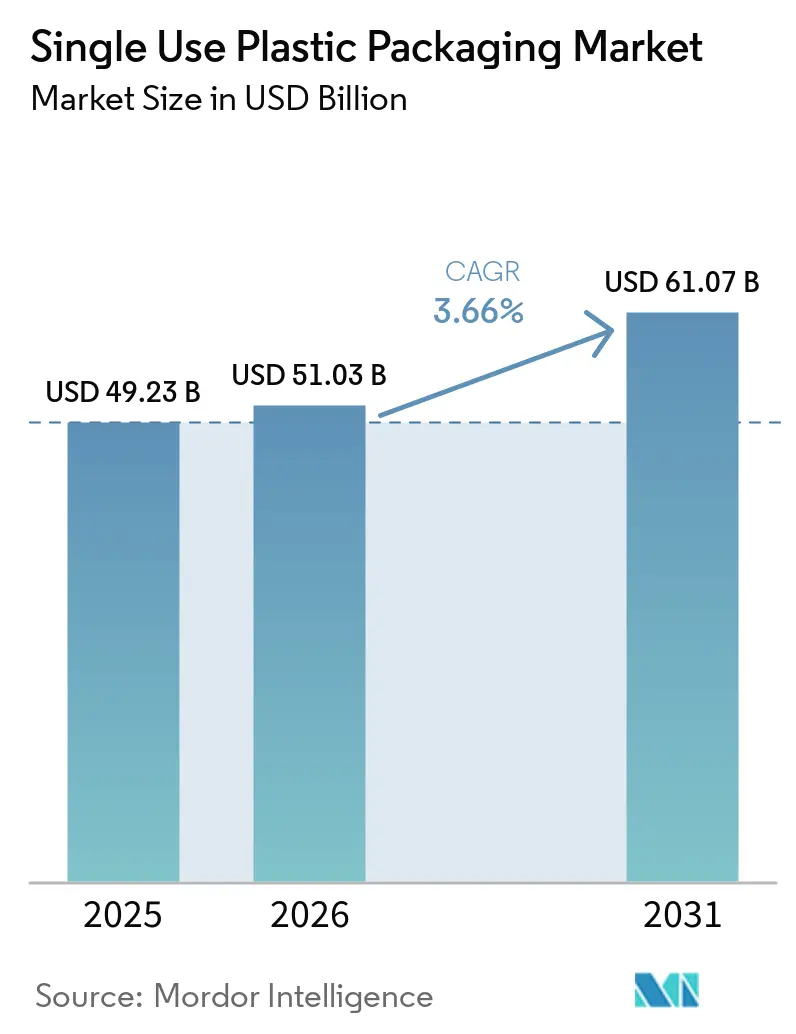
The single-use plastic packaging market size is expected to grow from USD 49.23 billion in 2025 to USD 51.03 billion in 2026 and is forecast to reach USD 61.07 billion by 2031 at 3.66% CAGR over 2026-2031. This outlook captures the sector’s ability to balance tightening regulations with indispensable roles in food safety, pharmaceutical protection and e-commerce fulfillment. Growing demand for ready-to-eat meals, sterile healthcare supplies and logistics-ready formats continues to underpin baseline consumption even as recycled-content mandates and design-for-recycling rules reshape material selection. Scale economies created through recent mega-mergers allow leading suppliers to deploy capital toward circular-economy technologies and to meet diverse regulatory requirements more efficiently. Meanwhile, brand owners emphasize mono-material designs, lightweighting and tethered closures to comply with EU and North American directives without sacrificing performance. Resin price swings linked to crude oil remain a cost variable, but long-term procurement contracts and recycling investments help blunt volatility.
Key Report Takeaways
- By material, PET led with 34.68% of the single-use plastic packaging market share in 2025; it also records the fastest 6.95% CAGR to 2031.
- By product type, bottles commanded 30.12% share of the single-use plastic packaging market size in 2025, while pouches and sachets advance at a 4.98% CAGR through 2031.
- By end-use industry, food and beverages remained dominant at 27.95% revenue share in 2025; healthcare and pharmaceuticals expand at a 4.65% CAGR to 2031.
- By distribution channel, direct sales held 56.10% share in 2025, whereas indirect channels post a 4.52% CAGR through 2031.
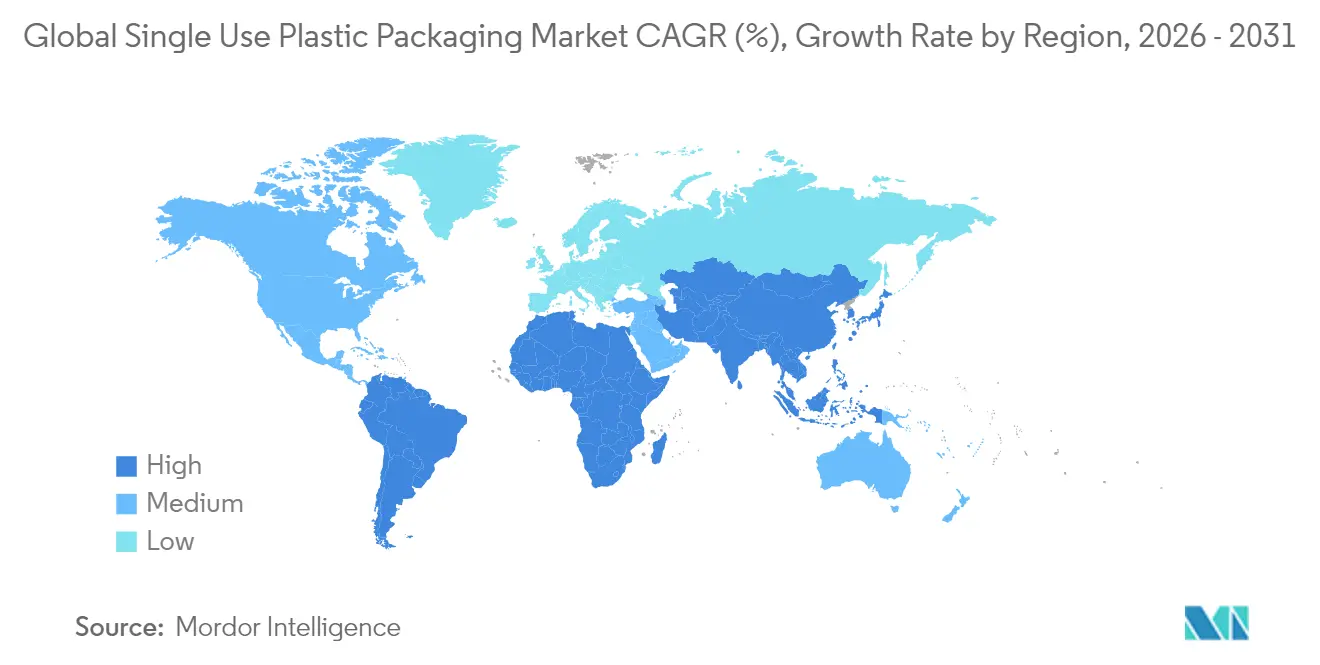
- By geography, Asia-Pacific accounted for 39.85% of the single-use plastic packaging market size in 2025; the Middle East & Africa is projected to grow at 5.45% CAGR to 2031.
- Amcor, Berry Global and Novolex–Pactiv Evergreen together represented 27% of global revenue in 2024, reflecting a moderately concentrated arena.
Note: Market size and forecast figures in this report are generated using Mordor Intelligence’s proprietary estimation framework, updated with the latest available data and insights as of 2026.
Market Trends and Insights
Drivers Impact Analysis of Single Use Plastic Packaging Market*
| Driver | (~) % Impact on CAGR Forecast | Geographic Relevance | Impact Timeline |
|---|---|---|---|
| App-based Food-Delivery Boom in Asian Megacities | +0.8% | APAC core, spill-over to MEA | Medium term (2-4 years) |
| EU Tethered-Cap Rule Accelerating Mono-Material PET Adoption | +0.6% | Europe, spillover to North America | Short term (≤ 2 years) |
| RTD Functional Beverages Spurring Lightweight Barrier Pouches in North America | +0.5% | North America, expanding to Global | Medium term (2-4 years) |
| India's Pharma Blister Outsourcing Surge | +0.4% | APAC core, export-driven global impact | Long term (≥ 4 years) |
| Tourism-Led Bottled-Water Demand Spike in GCC | +0.3% | Middle East, tourism-dependent regions | Short term (≤ 2 years) |
| Urban China Cold-Chain Expansion Driving EPS Trays | +0.4% | China, extending to Southeast Asia | Medium term (2-4 years) |
| Source: Mordor Intelligence | |||
App-based Food-Delivery Boom in Asian Megacities
Indonesia, Thailand and Vietnam continue to report double-digit growth in digital food-delivery transactions, elevating demand for leak-proof, temperature-retentive packs that survive motorcycle logistics. [1]Source: Asian Development Bank, “Digital Entrepreneurship in Food Delivery Industry in Indonesia,” adb.org Jakarta operators now allocate 15-20% of order value to packaging, prompting suppliers to engineer stackable designs that cut spillage and enhance brand visibility. A widening base of single-person households favors smaller portions, spurring mini-tub and two-compartment formats. Delivery-platform standardization simplifies SKUs and aids scale economies, while local governments encourage post-use collection schemes that feed emerging recycling infrastructure. These converging forces lift volume yet accelerate the switch to mono-material laminates to ease downstream sorting.
EU Tethered-Cap Rule Accelerating Mono-Material PET Adoption
Europe’s July 2024 tethered-cap mandate has driven rapid conversion of bottling lines; Coca-Cola alone invested EUR 150 million across 40 sites and achieved 95% consumer acceptance. [2]Source: European Commission, “Directive (EU) 2019/904 on Tethered Caps,” eur-lex.europa.eu Suppliers respond with tethered closures that mate seamlessly to virgin, recycled and bio-PET bottles, boosting capture rates and reinforcing PET’s recycling advantage. California will follow by 2027, creating a de-facto global standard that favors producers able to retrofit at scale. Origin Materials’ cross-compatible caps showcase how regulation spurs differentiated product features such as enhanced ergonomics and tamper evidence.
RTD Functional Beverages Spurring Lightweight Barrier Pouches
North America’s functional-drink category benefits from FDA-cleared barrier coatings that permit 30–40% material weight savings over rigid PET while extending shelf life to 18 months. [3]Source: U.S. Food and Drug Administration, “Barrier Coating Approvals 2024,” fda.gov Brands exploit this headroom to shrink carbon footprints and freight bills. Amcor’s vacuum-paneled 16 oz bottle illustrates parallel progress in rigid formats, though pouch systems now capture energy-drink line extensions seeking premium, resealable options. Material suppliers invest in multi-layer films integrating bio-PE, unlocking compatibility with existing recycling streams.
India’s Pharma Blister Outsourcing Surge
Indian CDMOs booked USD 25.4 billion in pharma exports during 2024, and blister packs are central to meeting regulated-market stability and traceability norms. Mold-Tek’s new facilities add 10,000 tonnes of capacity for alu-alu and PVC-free formats, mirroring broader migration toward higher-value healthcare packaging. Government production-linked incentives and serialization rules reinforce long-term blister demand while motivating investments in cleanroom-grade printing and moisture-barrier enhancements.
Restraints Impact Analysis of Single Use Plastic Packaging Market*
| Restraint | (~) % Impact on CAGR Forecast | Geographic Relevance | Impact Timeline |
|---|---|---|---|
| Easy Availability of Substitutes | -0.9% | Global, particularly Europe and North America | Medium term (2-4 years) |
| EU SUP Directive Pushing Brands to Fiber Substitutes | -0.6% | Europe, spillover to global brands | Short term (≤ 2 years) |
| Crude-Linked Resin Price Volatility | -0.7% | Global, manufacturing-intensive regions | Short term (≤ 2 years) |
| US State-Level Bans on Cutlery and Straws | -0.4% | North America, potential global influence | Medium term (2-4 years) |
| Source: Mordor Intelligence | |||
Easy Availability of Substitutes
Fiber-based lids, molded-pulp trays and bio-derived films erode demand where barrier rigor is moderate. McDonald’s Taiwan removed plastic lamination from menus in 2025, saving 86 t of resin annually and preserving 10,000 trees. EU rules requiring recyclability by 2030 accelerate brand pilots of compostable meat trays containing 54% wood cellulose. Dry-molded fiber technology introduced by Dart Container in North America cuts energy use by 80%, improving cost competitiveness against legacy EPS. As tooling migrates, the single-use plastic packaging market faces intensified competition in low-temperature or short-life applications.
Crude-Linked Resin Price Volatility
Polyethylene and polypropylene posted sequential 6-cent-per-pound swings in 2025 amid weaker export demand and talk of 25% tariffs on Canadian and Mexican imports. Such gyrations compressed Berry Global’s margins by USD 120 million in 2024, triggering formula-price contracts and spot-buy caution. PET moved counter-cyclically on bottle-grade shortages, widening spread risk. Larger converters hedge via multi-year feedstock agreements and invest in recycled-content streams that decouple cost bases from virgin resin indices, yet smaller firms struggle with working-capital strain.
*Our forecasts treat driver/restraint impacts as directional, not additive. The impact forecasts reflect baseline growth, mix effects, and variable interactions.
Single Use Plastic Packaging Market Segment Analysis
By Material:
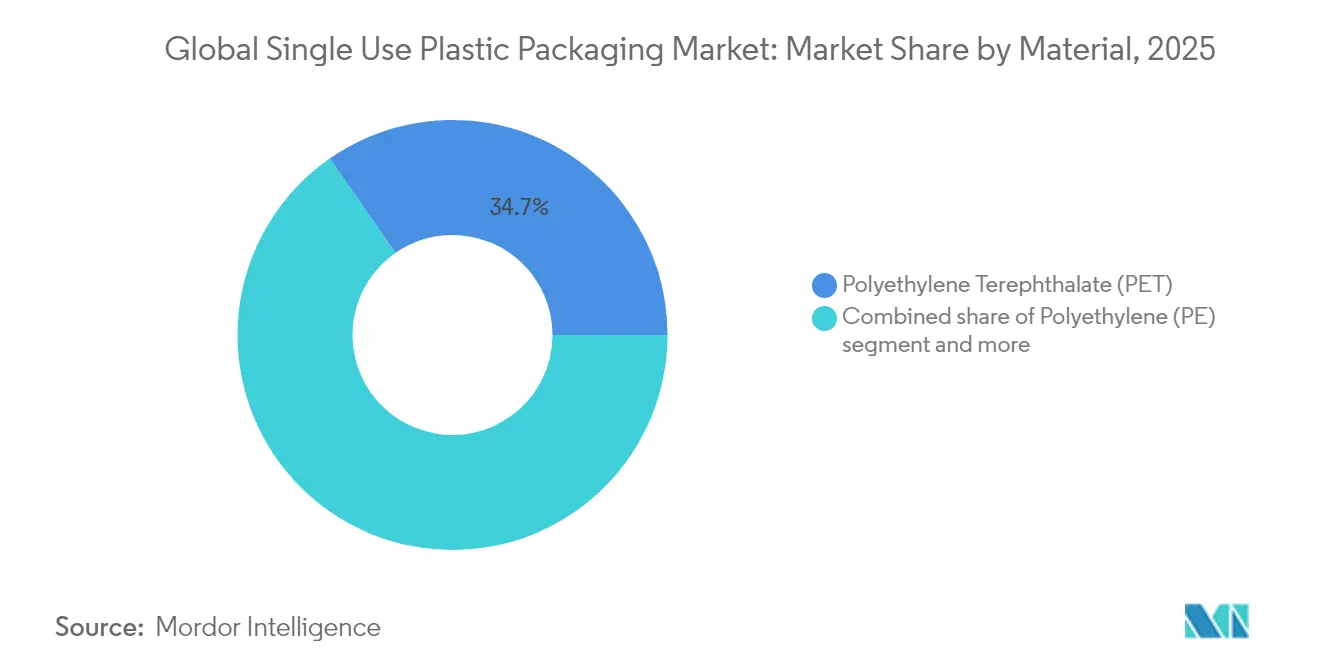
PET Strengthens Its Circular AdvantagePET captured 34.68% of the single-use plastic packaging market share in 2025 and is expected to widen its lead at a 6.95% CAGR as bottle-to-bottle loops mature. Europe’s 30% recycled-content order for beverage bottles underpins premium demand for rPET flake, prompting investments like Ganesha Ecopet’s 42,000 t pa expansion to meet local brand quotas. Recyclability, barrier clarity and tethered-cap compatibility combine to cement PET’s role in beverage and personal-care aisles.
Polyethylene and polypropylene remain workhorses in films, bags and closures thanks to versatility and cost, yet growth lags as regulators target harder-to-recycle multi-layer laminates. Polystyrene loses share in food service due to bans, while bio-based polymers gain niche traction where performance demands align with compostability mandates. Tech giants push chemical recycling pilots, but until scale and economics converge, PET retains its pragmatic superiority in the single-use plastic packaging market.


By Product Type:
Flexible Formats AccelerateBottles retain the largest revenue slice at 30.12% in 2025, benefiting from tethered-cap rollouts and on-the-go hydration trends. Even so, pouches and sachets outpace at 4.98% CAGR, driven by functional drinks, condiments and personal-wash refills. FDA-approved ultra-thin barrier films help brands shed 30% of pack weight while preserving shelf stability, making pouches the go-to for portion control and e-commerce.
Clamshells, trays and cups navigate mixed signals: retail produce favors rPET thermoforms, while quick-service eateries trial fiber bowls to satisfy local ordinances. Films and wraps enjoy e-grocery tailwinds but confront recyclability gaps, prompting consortium efforts to standardize mono-material PE structures. Across formats, design-for-recycling becomes a core selection criterion, steering capital toward solutions compatible with curbside collection in leading regions.
By End-Use Industry:
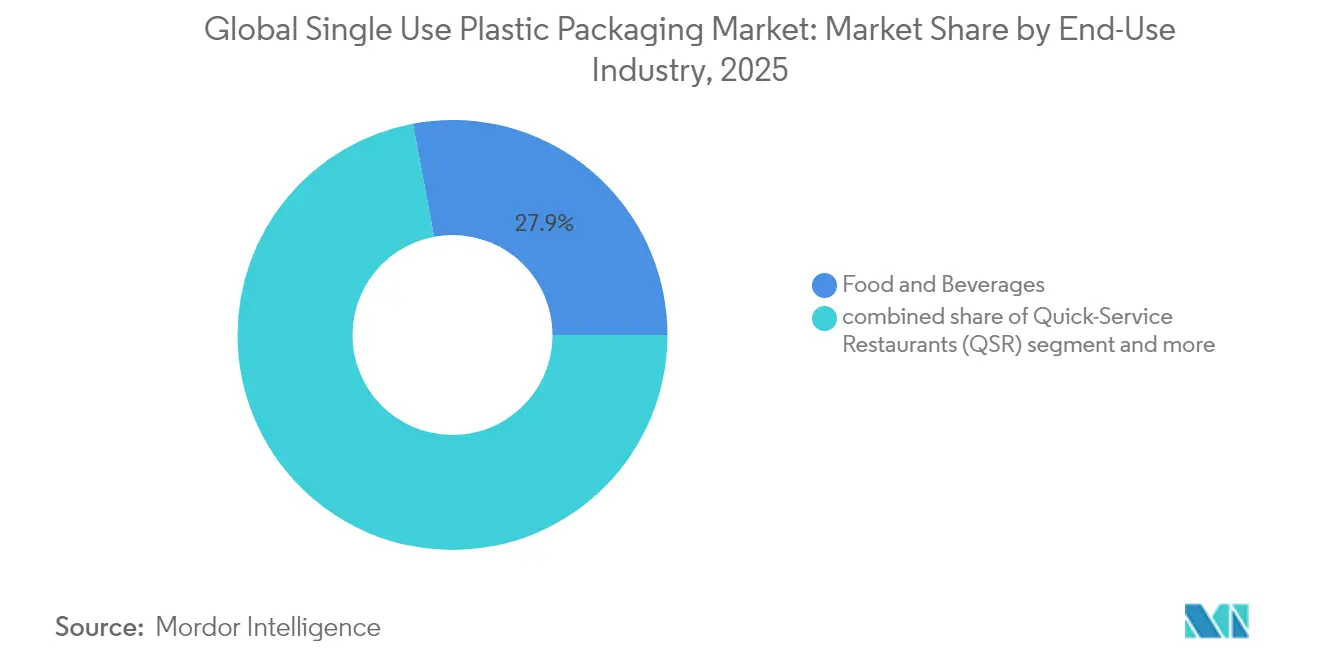
Healthcare Spurs Premium DemandFood and beverages anchored 27.95% of 2025 revenue, yet healthcare and pharmaceuticals present the fastest-rising opportunity with a 4.65% CAGR. Stringent sterility, moisture-barrier and track-and-trace requirements pull through materials such as cyclic olefin polymers and high-barrier blister lids. India’s CDMOs secure western regulatory approvals, multiplying export-grade blister line installations and reinforcing bilateral supply flows.
Meanwhile, restaurant channels pivot to delivery-centric SKUs that demand heat retention and spill prevention. Personal-care brands deploy flexible refill packs and solid concentrates, shaving plastics intensity but raising complexity for recyclers. Industrial shippers, notably in chemicals and lubricants, explore PCR content drums and IBCs to hit corporate carbon pledges, keeping a diversified demand base for the single-use plastic packaging market.
By Distribution Channel:
Hybrid Models EmergeDirect sales dominate with 56.10% share as brand owners lean on converters for co-design and rapid prototyping. The consolidated Amcor-Berry entity fields 400 plants, deepening turnkey appeal for multinationals. Yet indirect channels grow 4.52% CAGR, propelled by digital procurement portals that simplify spot orders for standardized SKUs. Amazon Business logged 45% y-o-y packaging material growth in 2024, spotlighting the ease-of-purchase trend.
Regional distributors enhance value via inventory management, localized regulatory guidance and recycled-content certification audits. Hybrid go-to-market structures surface: suppliers nurture direct key accounts for complex applications while leaning on distributors for mid-tier customers across emerging markets.
Geography Analysis
APAC Single Use Plastic Packaging Market
Asia-Pacific’s 39.85% slice of the single-use plastic packaging market reflects the region’s manufacturing heft, urban population growth and expanding middle class. The Asia Pacific single-use packaging market benefits from manufacturing scale and a growing urban middle class. China’s packaging sector generated RMB 2.3 trillion in output during 2024, supported by e-grocery and cold-chain investment waves that demand EPS and rPET solutions. India adds momentum through blister exports and food-delivery growth, while Southeast Asia posts 35% e-commerce transaction expansion that lifts protective mailer demand.
North America Single Use Plastic Packaging Market
North America exhibits mature but dynamic conditions shaped by state-level bans and recycled-content quotas. California’s extended producer responsibility law influences brand specifications nationwide, pushing 30% PCR PET targets ahead of federal guidelines. Investments in mechanical and chemical recycling proliferate; Amcor entered a multiyear mechanically-recycled PE deal to secure feedstock continuity.
Europe Single Use Plastic Packaging Market
Europe remains the regulatory vanguard, with the Single-Use Plastics Directive, PPWR and tethered-cap law steering global design templates. Compliance costs drive consolidation yet also catalyze innovation in mono-material flexible structures and molded-fiber keepsake lids.
MEA Single Use Plastic Packaging Market
The Middle East & Africa lead growth at 5.45% CAGR through 2031. Saudi Arabia’s Vision 2030 tourism strategy lifted visitor arrivals 56% in 2024, fueling bottled-water packaging spikes; Masafi invested AED 120 million in capacity enhancements to serve hospitality contracts. Infrastructure mega-projects such as NEOM expand demand for protective and barrier materials able to withstand desert logistics stresses, incentivizing suppliers to site recycling hubs regionally.
Brazil Single Use Plastic Packaging Market
Latin America delivers pockets of expansion, notably Brazil where packaging production rose 8% in 2024. Currency fluctuations and uneven regulation temper foreign investment, but local processors upgrade equipment to tap the single-use plastic packaging market opportunity in cross-border e-commerce.
Mordor Intelligence provides coverage of the global single use plastic packaging market across other key regional markets, including Europe, Asia, North America, and South America, each with their regulatory frameworks and demand patterns.

Regulatory Landscape
Regulation-led redesign is intensifying across major consuming regions, with Europe setting the pace. The EU Packaging and Packaging Waste Regulation, Regulation (EU) 2025/40, entered into force on 11 February 2025 and applies from 12 August 2026. It tightens recyclability requirements and introduces format restrictions that directly affect sachets, small portions, and other single-use packaging configurations, alongside recycled-content and labeling obligations.
Implementation is also becoming more prescriptive through EU implementing acts and reporting scrutiny. The European Commission adopted Implementing Decision (EU) 2026/1425 on 30 June 2026, setting rules to calculate, verify, and report recycled plastic content in single-use plastic beverage bottles. An April 2026 Commission report reviewed Member State reporting under the Single-Use Plastics Directive. Outside the EU, city and emirate-level measures continue to expand the compliance perimeter. Dubai broadened restrictions effective 1 January 2026 by prohibiting trading and use of additional single-use plastic products (including plates, food containers, tableware, and beverage cups and lids). At the global level, UNEP-led Intergovernmental Negotiating Committee work on a plastic pollution instrument continued into 2026, keeping producer disclosure, definitions, and circularity obligations on the agenda for multinational supply chains.
Competitive Landscape
Industry concentration rose after Amcor’s USD 8.43 billion union with Berry Global and Novolex’s USD 6.7 billion merger with Pactiv Evergreen, creating two giants controlling a quarter of global revenue. Scale affords leverage in resin procurement and the capital to deploy advanced recycling, smart-pack labeling and AI-driven quality assurance. The Federal Trade Commission green-lit both deals, citing the need for investment heft to meet sweeping sustainability mandates.
Mid-tier players pursue specialization: Sealed Air batteries R&D on ultra-light barrier films and automation to carve higher-margin niches, targeting USD 140–160 million annual savings under its CTO2Grow program. Huhtamaki’s Blueloop initiative channels EUR 100 million toward 100% recyclable portfolios that cater to European compliance first, then global rollout.
Technology forms a second battleground. Patent filings in smart packaging jumped 40% in 2024 as companies integrate NFC tags, QR codes and freshness sensors that guide sorting or deliver consumer engagement. Vertical integration into PET reclamation and chemical recycling grows: ExxonMobil evaluates an USD 8.6 billion PE plant embedded with advanced pyrolysis to close loops. Competitive emphasis thus shifts from pure tonnage to closed-loop credibility, regulatory fluency and data-rich functionality.
Single Use Plastic Packaging Industry Leaders
Amcor plc
Huhtamaki Oyj
Sealed Air Corp.
Dart Container Corp.
Novolex
- *Disclaimer: Major Players sorted in no particular order
Single Use Plastic Packaging Market Companies Covered in this Report
- Amcor plc
- Novolex
- Huhtamaki Oyj
- Sealed Air Corp.
- Dart Container Corp.
- Graphic Packaging International LLC
- Winpak Ltd.
- Sonoco Products Co.
- Reynolds Consumer Products
- Sabert Corp.
- Genpak LLC
- Coveris Holdings
- Fabri-Kal
- Inteplast Group
- Hotpack Packaging Industries LLC
- Alpla Werke Alwin Lehner GmbH
- Plastipak Holdings

Market Opportunities and Future Outlook
Compliance-driven material and infrastructure upgrades create near-term whitespace in recycle-ready designs, compliance data systems, and recycled-content assurance, especially for portfolios exposed to the EU from 12 August 2026 under PPWR (Regulation (EU) 2025/40). The Commission Implementing Decision (EU) 2026/1425 (30 June 2026) increases the need for mass-balance, traceability, and verification workflows for recycled content in beverage packaging. This supports opportunities for converters and resin and recycling partners that can provide audit-ready documentation and consistent rPET and rPP streams.
Upstream polymer and recycling commitments also point to where procurement is moving. Borealis announced a EUR 49 million investment at Burghausen, Germany (January 2026) to scale Borstar Nextension polypropylene for monomaterial, design-for-circularity applications, aligning with brand moves toward simplified structures. In advanced recycling, INEOS signed an MoU with Recuro (July 2026) to develop an advanced plastic recycling facility in Bamble, Norway, with up to 33,000 metric tons per year processing capacity, aimed at improving feedstock availability for recycled-content packaging grades. Alongside these investments, PPWR restrictions on certain single-use formats such as individual condiment sachets and small toiletry portions push brand owners and converters to redesign portioning and dispensing. This opens work for alternative pack formats and downgauged, recyclable structures that maintain barrier performance without falling into restricted configurations.
Recent Industry Developments in Single Use Plastic Packaging Market
- July 2026: INEOS signed an MoU with Recuro to develop an advanced plastic recycling facility in Bamble, Norway, targeting processing capacity of up to 33,000 metric tons of plastic waste annually. The project is aimed at improving recycled-feedstock availability for packaging applications that must document recycled content under tightening EPR and EU-aligned requirements.
- June 2026: Amcor partnered with UK-based startup Kelpi to evaluate seaweed-derived bio-based coating technology intended to improve barrier performance in fiber-based packaging. The work broadens the competitive toolkit for brand owners shifting some formats away from plastics while continuing to require shelf-life and functional protection.
- September 2024: Dart Container introduced dry molded fiber production into the North American market via a collaboration with PulPac. The expansion adds scaled alternatives for foodservice packaging, increasing substitution pressure on certain single-use plastic formats and accelerating material mix changes at large quick-service and retail accounts.


Single Use Plastic Packaging Market Report Scope and Research Methodology
Market Definition and Coverage
This market covers revenue generated from plastic packaging that is designed to be used once and then discarded or sent for recycling, across common consumer and commercial packaging needs.
Scope exclusions: We exclude reusable plastic packaging formats and durable transport packaging that is intended for repeated circulation.
Segments Covered in This Report
- By Material
- Polyethylene Terephthalate (PET)
- Polyethylene (PE)
- Polypropylene (PP)
- Polystyrene (PS)
- Other Materials
- By Product Type
- Bottles
- Pouches and Sachets
- Clamshells
- Trays, Cups and Lids
- Films and Wraps
- Other Product Types
- By End-Use Industry
- Quick-Service Restaurants (QSR)
- Full-Service Restaurants (FSR)
- Food and Beverages
- Healthcare and Pharmaceutical
- Personal Care and Cosmetics
- Other End-Use Industry
- By Distribution Channel
- Direct Sales
- Indirect Sales
- By Geography
- North America
- United States
- Canada
- Mexico
- Europe
- Germany
- United Kingdom
- France
- Italy
- Spain
- Russia
- Rest of Europe
- Asia-Pacific
- China
- India
- Japan
- South Korea
- Australia and New Zealand
- Rest of Asia-Pacific
- Middle East and Africa
- Middle East
- United Arab Emirates
- Saudi Arabia
- Turkey
- Rest of Middle East
- Africa
- South Africa
- Nigeria
- Egypt
- Rest of Africa
- Middle East
- South America
- Brazil
- Argentina
- Rest of South America
- North America
Data Sources, Market Sizing, and Validation
Desk Research
Desk research helps set the structure of the sizing model and keeps assumptions realistic for plastics and packaging. We typically rely on non-paywalled public sources such as the US EPA (waste and recycling indicators), Eurostat (production and trade series), UN Comtrade (trade flows for relevant plastic articles categories), OECD (policy and environment indicators), and association publications such as PlasticsEurope.
To connect market scope to actual revenue pools, we cross check with company annual reports, investor presentations, and business press coverage on resin price direction and packaging demand shifts in foodservice and packaged goods. For selective checks, paid subscriptions are used to speed up company financials and intelligence screening, patent lookups, and shipment level import and export checks where trade patterns matter. The sources listed above are illustrative only, and we also used other public documents for data collection, scope clarification, and validation.
Primary Interviews and Surveys
Primary work was used to confirm what gets counted as single use plastic packaging in day to day buying and supply, and how demand changes by end use. We spoke with participants across packaging conversion, material supply, distribution, and large buying groups in foodservice, retail, healthcare, and personal care, and then reviewed key assumptions across APAC, EMEA, and the Americas. The conversations helped close gaps around typical product mix shifts, timing of pricing pass through, and how recycled content targets are changing product specifications.
Distribution of primary research fieldwork respondents
| Company type | Respondent position | Region |
|---|---|---|
| Top tier: 29% | CXOs: 12% | APAC: 47% |
| Mid tier: 57% | Functional/Unit leaders: 28% | EMEA: 35% |
| Smaller Players: 14% | Managers: 60% | Americas: 18% |
Market-Sizing & Forecasting
We start from a top-down view where packaging demand is reconstructed using consumption signals and packaging intensity patterns by major end uses, and then we test totals using selective bottom-up checks from supplier and converter revenue clues. In practical terms, the model leans on how much packaged food and beverages move through channels, how much foodservice packaging is used per outlet and per order, and how healthcare and personal care packaging needs scale with unit volumes.
Key inputs used to keep the model grounded include resin and packaging price direction (PET, PE, PP, and PS), product mix splits across bottles, pouches and sachets, clamshells, trays, cups and lids, and films and wraps, and the adoption pace of downgauging or format substitution. Regulation timelines that affect specific items, such as restrictions on certain single use products, are treated as scenario levers so the impact is applied as it rolls through contracts and consumer behavior. When bottom-up evidence is incomplete for smaller markets, gaps are handled using ratio based allocations tied back to trade, consumption, and end use intensity checks.
For forecasting, scenario analysis is used so pricing and volume can be separated and stress tested, and then year to year outputs are tuned based on what interviewees expect for input costs, substitution pressure, and demand resilience in food and healthcare packaging. We keep steps repeatable by documenting each assumption so it can be revisited during updates.
Data Validation & Update Cycle
Validation is done through multiple passes where our model outputs are compared against independent signals such as trade direction, reported revenue trends, and demand markers like foodservice activity and packaged goods throughput. If large variances show up at the region or product level, we recheck inputs, revisit conversion steps, and, when needed, reconnect with experts to confirm whether the movement is real or driven by timing and price effects.
Before sign off, the work is reviewed by another analyst to catch outliers, unit errors, and inconsistent assumptions across years. The report is refreshed annually, and interim updates are triggered when material events occur, such as sharp resin price swings, meaningful capacity expansions, or major policy changes. Right before delivery, an analyst performs a fresh pass so clients receive the latest updated view.
Mordor Intelligence's Single Use Plastic Packaging Market Sizing Compared With Other Published Estimates
Published market sizes for single use plastic packaging can look far apart, even when the growth story sounds similar. The gap usually comes from differences in scope, the chosen base year and price basis, and how quickly policy and material substitution effects are applied in the forecast.
Some external estimates appear to bundle a much wider packaging universe by mixing in single use packaging outside plastics or by using broad application groupings that pull in adjacent materials. For Mordor Intelligence, only plastic packaging intended for one time use is counted, with product formats such as bottles, pouches, trays, and films mapped to end use demand signals so non-plastic and reusable packaging formats sit outside the scope.
Benchmark comparison
| Source | Market Size | Gaps in Research Methodology |
|---|---|---|
| Mordor Intelligence | USD 51.03 B (2026) | |
| Industry Research Outlet A | USD 34.29 B (2020) | Uses an older base year and a different price environment, and the scope shown is closer to a narrower set of packaging types and applications, which can understate later-cycle inflation and mix shifts. |
| Market Portal B | USD 320.00 B (2023) | The reported figure aligns with a much broader roll-up that likely includes adjacent single use packaging materials beyond plastics, which expands the revenue pool compared to a plastic-only definition. |
The spread across published figures is mostly explained by scope width, base year timing, and how price progression is carried through the forecast years. By tying the model to observable product formats, resin linked pricing direction, and end use consumption signals, we keep the output traceable to clear steps that can be repeated during future updates.


Key Questions Answered in the Report
What is the current size of the single-use plastic packaging market?
The single-use plastic packaging market size stands at USD 51.03 billion in 2026.
Which material leads the single-use plastic packaging market?
PET leads, holding 34.68% share in 2025 and expanding at a 6.95% CAGR through 2031.
Why are pouches growing faster than bottles?
Pouches cut material weight by up to 30%, meet convenience demands and comply with emerging recycling-friendly mono-material designs, driving a 4.98% CAGR.
Which region grows the fastest in single-use plastic packaging?
The Middle East and Africa records the highest 5.45% CAGR thanks to tourism and infrastructure projects that elevate bottled-water and food-service demand.
How do regulations impact the single-use plastic packaging industry?
EU tethered-cap and recycled-content rules, plus U.S. state bans, push companies toward mono-material PET, fiber substitutes and higher recycled content, reshaping product design and material sourcing.
Who are the major players after recent consolidations?
Amcor–Berry Global and Novolex–Pactiv Evergreen now account for roughly one-quarter of global revenue, leveraging scale to invest in circular-economy technologies and satisfy multinational brand requirements.
Page last updated on:


 Your data is secure and never sold or shared.


