
Market Overview
| Study Period | 2020 - 2031 |
|---|---|
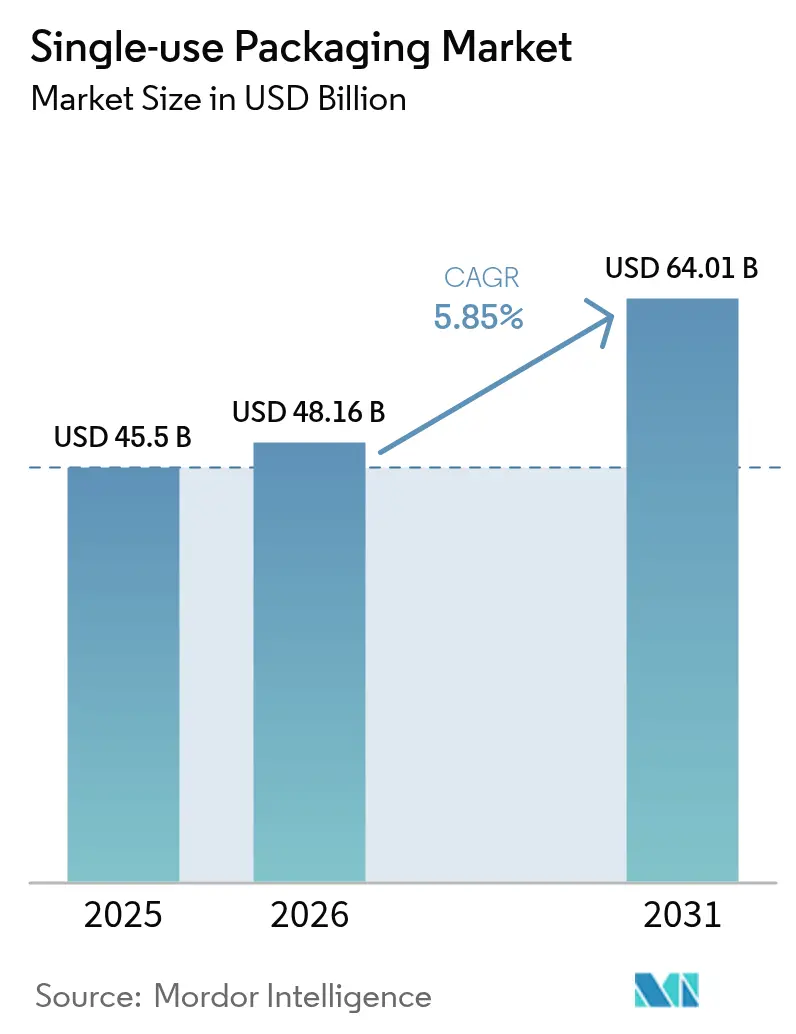
| Market Size (2026) | USD 48.16 Billion |
| Market Size (2031) | USD 64.01 Billion |
| Growth Rate (2026 - 2031) | 5.85 % |
| Fastest Growing Market | Middle East and Africa |
| Largest Market | Asia Pacific |
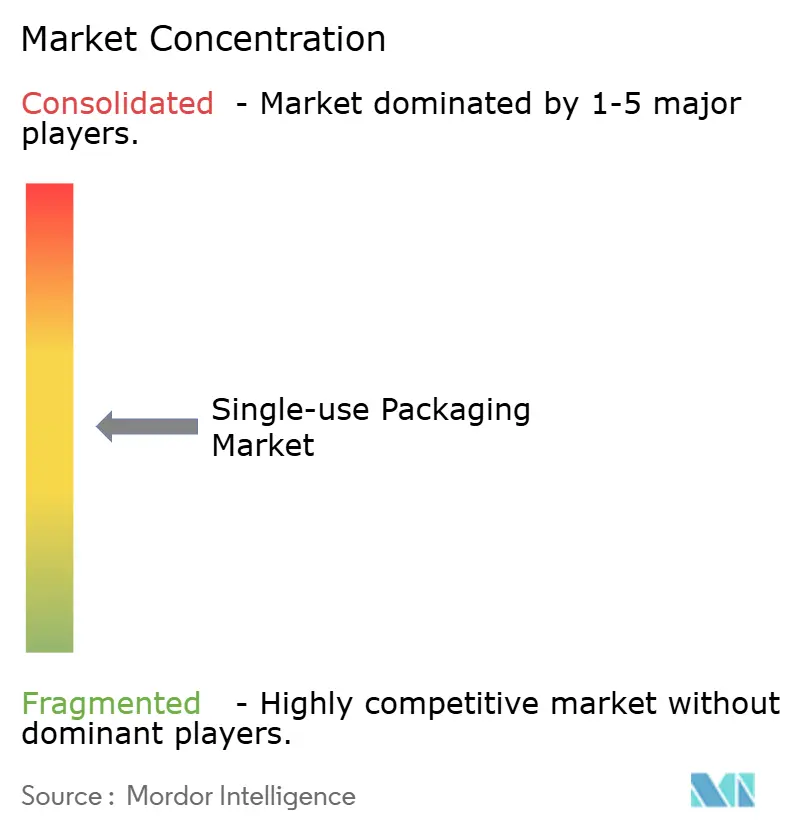
| Market Concentration | Medium |
Major Players *Disclaimer: Major Players sorted in no particular order Image © Mordor Intelligence. Reuse requires attribution under CC BY 4.0. | |
Single-use Packaging Market Analysis by Mordor Intelligence
The single-use packaging market size was valued at USD 45.50 billion in 2025 and estimated to grow from USD 48.16 billion in 2026 to reach USD 64.01 billion by 2031, at a CAGR of 5.85% during the forecast period (2026-2031). Robust e-commerce growth, the rise of ghost kitchens, and higher adoption of portion-controlled formats are the primary engines of expansion for the single-use packaging market. Volume gains concentrate in Asia Pacific, yet brand owners in North America and Europe are shifting toward recyclable mono-material designs rather than escalating tonnage. Capital spending on advanced recycling infrastructure intensifies, although high-grade PCR resin shortages intermittently raise input costs. Competitive dynamics remain moderately fragmented as vertically integrated leaders secure material streams while challengers focus on sustainable substrates and digital printing agility.
Key Report Takeaways
- By material type, plastics held 59.65% of the single-use packaging market share in 2025. Paper and paperboard is advancing at a 6.55% CAGR, the quickest among materials through 2031.
- By packaging format, flexible solutions commanded 54.05% of 2025 revenue, with rigid alternatives trailing.
- Pouches and sachets accounted for 30.05% share of the single-use packaging market size in 2025 and are growing at a 6.55% CAGR.
- Food and beverages led with 28.10% 2025 revenue, whereas personal care and cosmetics is expanding at a 6.88% CAGR to 2031.
- Asia Pacific dominated with 40.05% 2025 revenue; the Middle East and Africa is poised for a 7.55% CAGR, the highest regionally.
Note: Market size and forecast figures in this report are generated using Mordor Intelligence’s proprietary estimation framework, updated with the latest available data and insights as of 2026.
Global Single-use Packaging Market Trends and Insights
Drivers Impact Analysis*
| Driver | (~) % Impact on CAGR Forecast | Geographic Relevance | Impact Timeline |
|---|---|---|---|
| Rise of e-commerce and D2C channels | +1.8% | Global, with highest impact in Asia Pacific and North America | Medium term (2-4 years) |
| Expansion of online food-delivery "ghost kitchens" | +1.2% | Urban centers globally, concentrated in Asia Pacific and Europe | Short term (≤ 2 years) |
| Convenience-driven single-serve lifestyle | +1.0% | Global, particularly developed markets | Long term (≥ 4 years) |
| QSR boom in emerging Asia and Africa | +1.4% | Asia Pacific, Middle East and Africa | Medium term (2-4 years) |
| Brand shift to lightweight refill pouches | +0.8% | Global, led by personal care segment | Medium term (2-4 years) |
| AI-enabled micro-run packaging lines | +0.6% | North America, Europe, developed Asia Pacific | Long term (≥ 4 years) |
| Source: Mordor Intelligence | |||


Rise of E-commerce and D2C Channels
Direct-to-consumer logistics demand packaging that survives multi-node distribution yet conveys brand aesthetics. Ranpak’s 16% 2024 Q4 revenue jump in paper cushioning shows retailers pivoting from plastic void fill to fiber-based protection. Higher shipment frequency boosts per-unit packaging intensity, while the quest for “share-worthy” unboxing encourages premium graphics. As a result, converters introduce recyclable barrier films and right-sized paper wraps that cut dimensional weight. These advances reinforce a structural step-change in baseline volumes for the single-use packaging market.
Expansion of Online Food-Delivery “Ghost Kitchens”
Virtual restaurants depend on tamper-evident, temperature-retentive packs that travel safely across dense urban zones. Jollibee’s plan to open up to 800 new delivery-first outlets in 2025 illustrates the momentum behind this model. Packaging R&D therefore centers on stackable clamshells, antimicrobial linings, and QR-coded seals that track chain-of-custody. Ghost-kitchen scale accelerates demand spikes in the single-use packaging market, particularly for molded fiber bowls, coated paper wraps, and leak-proof PP containers.
Convenience-Driven Single-Serve Lifestyle
Consumers balancing hybrid work schedules reward brands offering portable portions. Aveda’s partnership with Xela Pack to roll out paper sachets replaces legacy plastic samples while preserving product efficacy. Miniaturization raises oxygen-and-moisture ingress risk, forcing converters to upgrade barrier chemistries. Premium pricing tolerance in time-starved households offsets higher unit costs, fortifying value growth for the single-use packaging market.
QSR Boom in Emerging Asia and Africa
Rising disposable incomes catalyze franchised QSR network expansion. KFC Africa replaced plastic straws with paper and switched to bagasse bowls across multiple countries, signaling large-scale substrate transitions. Domestic converters upscale to meet international food-safety standards, gaining technology transfers that elevate regional capabilities. These moves reinforce shipment volume surges for the single-use packaging industry in frontier economies.
Restraints Impact Analysis*
| Restraint | (~) % Impact on CAGR Forecast | Geographic Relevance | Impact Timeline |
|---|---|---|---|
| Global bans and taxes on single-use plastics | -1.5% | Europe, North America, parts of Asia Pacific | Short term (≤ 2 years) |
| Limited collection and advanced-recycling capacity | -0.8% | Worldwide; acutely felt in developing markets | Medium term (2-4 years) |
| High-grade PCR resin supply volatility | -0.6% | Regions with recycling mandates | Short term (≤ 2 years) |
| Polymer-film trade-tariff disruptions | -0.4% | US-Asia, EU-Asia routes | Medium term (2-4 years) |
| Source: Mordor Intelligence | |||
Global Bans and Taxes on Single-Use Plastics
The EU Packaging and Packaging Waste Regulation compels recycled-content targets, while PFAS bans remove key grease-barrier coatings. [1]European Environment Agency, “Packaging Waste Regulation,” eea.europa.eu California’s SB 54 requires a 65% cut in plastic packaging by 2032, forcing rapid material pivots. Divergent regional rules fragment specifications, raising compliance costs and slowing rollouts across the single-use packaging market.
Limited Collection and Advanced-Recycling Capacity
Recycling investments lag regulatory ambition. The Association of Plastic Recyclers notes capacity gaps widened after rPlanet Earth shuttered its California PCR plant in 2024. Eurostat lists only 41% plastic-pack recycling in the EU during 2024. [2]Association of Plastic Recyclers, “Advanced Recycling Capacity 2025,” plasticsrecycling.org Scarce high-quality PCR inflates resin premiums and constrains closed-loop programs.
*Our forecasts treat driver/restraint impacts as directional, not additive. The impact forecasts reflect baseline growth, mix effects, and variable interactions.
Segment Analysis
By Material Type: Plastics Dominate Despite Sustainability Pressures
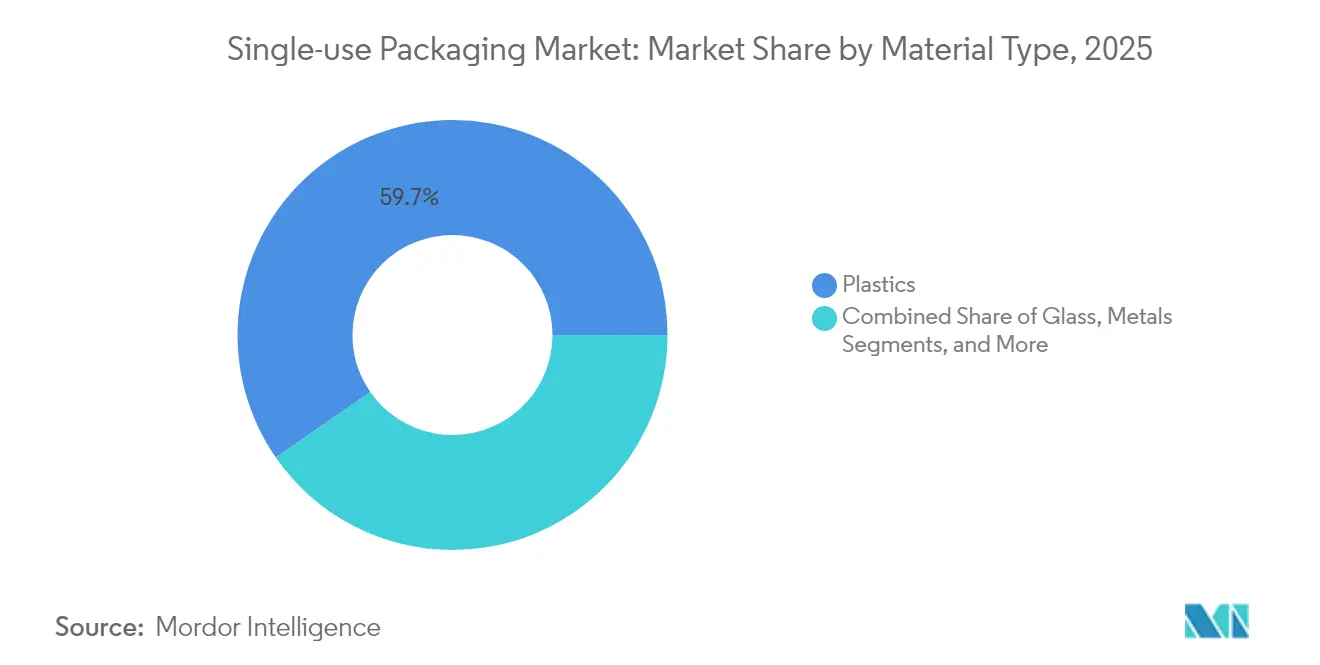
Plastics retained 59.65% 2025 revenue in the single-use packaging market, buoyed by versatile barrier traits and cost efficiency. Paper and paperboard is tracking a 6.55% CAGR, the quickest material expansion pace, as brand owners switch SKUs to recyclable substrates to meet policy targets. The single-use packaging market size for plastics is forecast to expand steadily even as PET bottle collection rates climb, thanks to e-commerce void-fill and healthcare applications. PET benefits from robust mechanical recycling streams, whereas PP films gain traction due to easier mono-material recovery.
Investment in bio-based polymers and chemical recycling rises. Pulpex’s fiber bottle pilots underscore a future in which cellulose competes with PET in personal-care and spirits packs. Metal cans hold niche strength in beverages and aerosols given infinite recyclability, while glass sees revival in premium categories. Material selection pivots on regulatory fit; FDA food-contact rules and EU PFAS bans are already rewriting coating formulations, adding R&D urgency across the single-use packaging industry.


By Packaging Format: Flexible Solutions Lead Innovation
Flexible formats delivered 54.05% of 2025 revenue for the single-use packaging market and are on a 5.98% CAGR trajectory through 2031. Lightweight laminates lower transport emissions and adapt to diverse filling lines, making them a default for snacks, sauces, and detergents. The single-use packaging market size tied to flexibles rises as digital presses enable cost-effective micro-runs for D2C merchants, while converters introduce solvent-free laminations to boost recycle-ready claims.
Rigid containers keep share in sterile healthcare, carbonated beverages, and luxury cosmetics where structure or clarity matters. Weight-reduction programs in PET bottles and thermoformed trays offset some resin-cost pressure. Constantia Flexibles’ roll-out of water-based barrier coatings demonstrates how suppliers revamp traditional flexibles without sacrificing shelf-life. Format competition increasingly factors end-of-life costs, with EPR fees nudging buyers toward materials that meet local recyclability thresholds.
By Product Type: Pouches Transform Multiple Categories
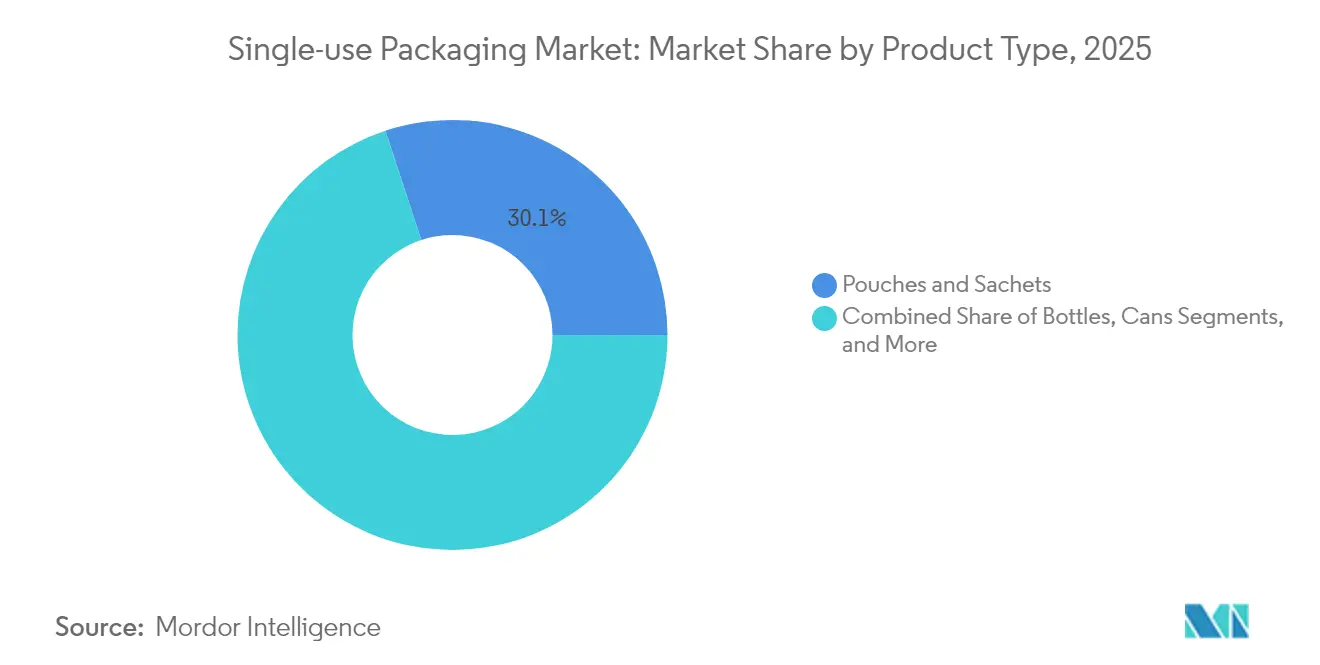
Pouches and sachets captured a 30.05% 2025 revenue slice, the highest among product forms, and register the category’s 6.55% CAGR. Their popularity stems from material-to-product ratios significantly lower than rigid jars, supporting both cost and carbon agendas. Within beverages, spouted pouches penetrate children’s juices, while refill sachets cut plastic weight in shampoos. The single-use packaging market share for pouches benefits from high-speed form-fill-seal lines that minimize labor and energy overhead.
Bottles remain important for pressurized drinks and personal-care lines demanding precision dosing. Aseptic cartons defend dairy and plant-based milks where long ambient shelf-life is paramount. Trays, cups, and lids remain QSR staples yet confront gradual bans on EPS and colored PS. Cannery demand holds steady due to established aluminum recovery loops, while pharma vials carve out a safe niche insulated from substitution by strict sterility norms.
By End-Use Industry: Food Services Drive Innovation
Food and beverages contributed 28.10% of 2025 turnover, making it the largest consumer of formats across the single-use packaging market. Delivery expansion incentivizes tamper-proof labels and insulated wraps that secure quality for 30-minute trips. The single-use packaging market size generated by personal care and cosmetics is projected to rise fastest at a 6.88% CAGR as brands pursue refill pouches and paper sachets for moisturizers and color cosmetics.
Healthcare packs grow alongside aging populations and biotech storage needs, though sterility criteria restrict material switches. KFC Africa’s region-wide shift to bagasse bowls demonstrates how QSR chains blend speed of service with eco mandates. Aveda’s paper sachets prove that prestige positioning can survive plastic-free executions. Industrial chemicals adopt certified UN drums and IBCs, where Mauser Packaging’s 2024 South African acquisition confirms regional consolidation trends.
Geography Analysis
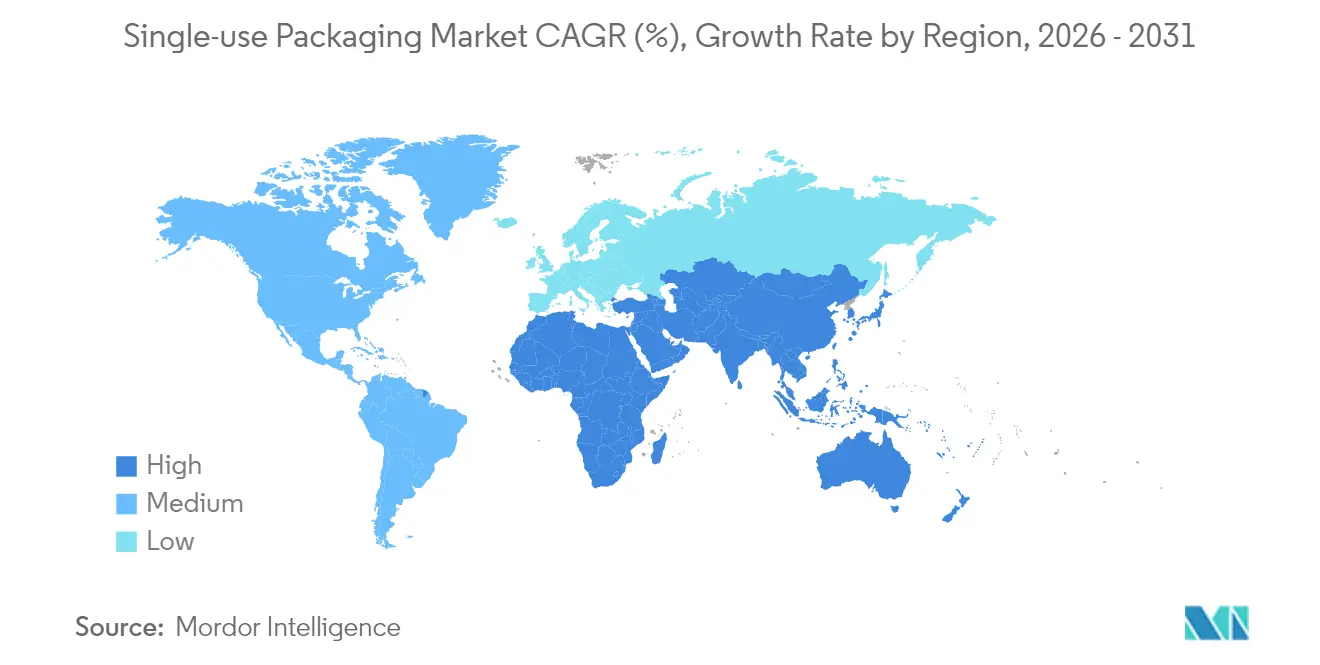
Asia Pacific controlled 40.05% 2025 revenue in the single-use packaging market, reflecting manufacturing scale, dense urban retail, and accelerating QSR network rollouts. China’s evolving standards and Japan’s exacting food-contact norms push converters to refine polymer compositions and audit traceability. India, Indonesia, and Vietnam underpin volume upside as e-commerce penetration lifts daily parcel counts. Local regulations such as Vietnam’s producer responsibility decree catalyze investments in sorting and chemical recycling facilities.
North America and Europe concentrate on material substitution rather than volume growth. California’s SB 54 and the EU’s Packaging Regulation shape innovation roadmaps, triggering brand commitments to 100% recyclable or reusable packs by 2030. Mature consumers pay premiums for circular solutions, allowing suppliers to recoup R&D outlays and maintain margins. Digital watermarking via HolyGrail 2.0 pilots in Denmark enhances sorting accuracy, a precursor to scaled AI-enabled MRF operations.
The Middle East and Africa posts the fastest 7.55% CAGR through 2031 for the single-use packaging market, propelled by expanding organized retail and infrastructure spend. Hotpack’s USD 100 million U.S. factory demonstrates regional champions scaling abroad, while SIG Group’s USD 28.2 million Egyptian carton-recycling hub embeds circularity at source. Gulf Cooperation Council food-import dynamics sustain steady demand for multilayer barrier films, whereas sub-Saharan Africa leverages bagasse and other local fibres as plastic alternatives. Rising household incomes unlock demand for portion-controlled snacks and personal care sachets, broadening the customer base for the single-use packaging market.

Regulatory Landscape
Regulation is increasingly shaping single-use packaging specifications through bans, recycled-content and recyclability rules, and producer-responsibility obligations. In the European Union, the Packaging and Packaging Waste Regulation, Regulation (EU) 2025/40, entered into force on 11 February 2025 and becomes generally applicable from 12 August 2026, replacing fragmented national approaches with a directly applicable framework. It sets restrictions for certain single-use formats and requires steps to minimize packaging and demonstrate compliance.
Outside Europe, policy action is also tightening at city and procurement levels. Dubai Executive Council Resolution No. (124) of 2023 prohibits defined single-use plastic items (including plates, food containers, tableware, and beverage cups and lids) effective 1 January 2026, which drives near-term substitution toward paper, molded fiber, and compliant plastic alternatives. In the United States, the General Services Administration Acquisition Regulation on reducing single-use plastic packaging took effect on 8 July 2024, signaling procurement-driven demand shifts for compliant packaging across federal supply chains, while the US EPA elevated microplastics on its draft Sixth Contaminant Candidate List (announced 2 April 2026), increasing scrutiny of plastics across the life cycle.
Value Chain Analysis
The single-use packaging value chain spans petrochemical feedstocks and pulp inputs, resin and paper production, converting (film extrusion, thermoforming, blow and injection molding, coating and laminating), printing and finishing, and then distribution to brand owners, foodservice operators, and e-commerce shippers. Large converters and integrated packaging groups buffer material volatility by securing resin and fiber supply, while brand owners increasingly brief suppliers for recyclable mono-material structures and lightweighting to align with evolving packaging rules such as the EU PPWR (Regulation (EU) 2025/40).
Bottlenecks cluster around resin availability, food-contact compliant barrier chemistries, and collection-to-PCR loops. The 2026 Strait of Hormuz disruption highlighted dependence on Middle East-linked petrochemical flows and exposed lead-time fragility for films and commodity resins. Logistics rerouting and higher freight costs translate into procurement pressure and spot shortages, accelerating parallel sourcing across the chain, including greater use of fiber-based formats, alternative substrates, and regionalized supply agreements. Compliance documentation and specification fragmentation also increase testing and qualification workload for converters and brand owners.
Competitive Landscape
The single-use packaging market is moderately fragmented. Top converters deploy hub-and-spoke footprints to secure resin supply and cut logistics miles. Graphic Packaging, Amcor, and Packaging Corporation of America collectively operate multi-regional mills and extrusion lines that feed integrated converting plants, buffering them against PCR price swings. Emerging outfits carve niches in fiber-based or bio-polymer formats, often licensing technology to accelerate commercialization.
Strategic deal flow remains brisk. CCL Industries’ USD 150 million Southeast Asian label acquisition strengthens its regional e-commerce footprint. Mauser Packaging’s South African asset purchase highlights consolidation in industrial drums, where regulatory compliance and UN certification create high barriers to entry. Capital deployment targets AI-enabled micro-run lines and solvent-free coating assets that align with tightening PFAS and VOC caps.
Technology is the competitive fulcrum. HolyGrail 2.0 watermarking, robotics-driven kitting, and chemical depolymerization patents differentiate early adopters. Leaders court consumer-goods multinationals with life-cycle-analysis dashboards and scope-3 emissions data to secure long-term contracts. The single-use packaging industry rewards scale economies but increasingly values agility to pivot toward new regulatory standards.
Single-use Packaging Industry Leaders
Amcor plc
Huhtamaki Oyj
Novolex Holdings, LLC
Dart Container Corporation
Winpak Ltd.
- *Disclaimer: Major Players sorted in no particular order

Market Opportunities and Future Outlook
A near-term opportunity is compliance enablement for the EU PPWR as it becomes generally applicable from 12 August 2026. Demand will shift toward packaging redesigns, verification testing, and documentation systems that support an EU Declaration of Conformity and associated technical files for packaging placed on the EU market. This favors converters that can industrialize recyclable mono-material structures, PFAS-free grease barriers for foodservice, and higher-performance paper and molded-fiber alternatives while maintaining line efficiency for high-volume applications such as pouches, sachets, and takeaway formats.
Reuse and standardization efforts are also creating whitespace in transport and retail logistics packaging that interfaces with single-use primary packs. The PR3 Alliance published its reusable packaging system standard (RES-001:26/CSA R304:26) in January 2026. GS1 Germany and GS1 Austria moved the GS1 Smart-Box standardized reusable transport container into series production and deployment in the European drugstore market in January 2026, supporting interoperable pools and cross-border circulation. Meanwhile, the European Commission is calibrating PPWR implementation, including its February 2026 decision C(2026) 511 that exempted pallet wrappings and straps from certain reuse targets, shaping where converters and brand owners prioritize investment across primary versus transport packaging.
Recent Industry Developments
- July 2026: Amcor announced an expansion of a packaging facility in China. The move increases local manufacturing capability for a major packaging supplier in Asia Pacific, supporting faster lead times for brand owners and e-commerce customers and strengthening regional supply resilience.
- June 2026: Amcor announced a multi-million-dollar investment to expand its Sira, Karnataka, India, manufacturing facility, adding new production capacity for high-performance healthcare packaging and patient-centric drug-delivery solutions. This redirects capital toward higher-value single-use formats where regulatory and sterility requirements favor specialized materials and tightly controlled manufacturing.
- May 2026: Closure Systems International completed the acquisition of two North American beverage closure compression molding facilities in Erie and Hattiesburg from Amcor. The transaction reshapes capacity ownership in closures, enabling CSI to scale production while Amcor continues portfolio optimization toward targeted packaging segments.


Research Methodology Framework and Report Scope
Market Definition and Coverage
This market covers packaging items that are intended for one-time use and then discarded, across consumer and commercial uses, and measured as revenue generated from selling those packs in a given year.
Scope exclusions: Excludes durable and returnable packaging used for repeated cycles (such as reusable crates, refillable bottles, and pallet level returnable transit packaging).
Segmentation Overview
- By Material Type
- Paper and Paperboard
- Plastic
- Polyethylene Terephthalate (PET)
- Polyethylene (PE)
- Polypropylene (PP)
- Polystyrene (PS)
- Other Plastics
- Glass
- Metals
- By Packaging Format
- Flexible Packaging
- Rigid Packaging
- By Product Type
- Bottles
- Pouches and Sachets
- Aseptic Cartons
- Trays, Cups and Lids
- Vials and Ampoules
- Cans
- Other Product Types
- By End-Use Industry
- Food Services
- Quick-Service Restaurants (QSR)
- Full-Service Restaurants (FSR)
- Other Food Services
- Food and Beverages
- Healthcare and Pharmaceutical
- Personal Care and Cosmetics
- Other End-Use Industries
- Food Services
- By Geography
- North America
- United States
- Canada
- Mexico
- South America
- Brazil
- Argentina
- Chile
- Rest of South America
- Europe
- Germany
- United Kingdom
- France
- Italy
- Spain
- Rest of Europe
- Asia-Pacific
- China
- Japan
- India
- South Korea
- Australia
- Rest of Asia-Pacific
- Middle East and Africa
- Middle East
- Saudi Arabia
- United Arab Emirates
- Turkey
- Rest of Middle East
- Africa
- South Africa
- Nigeria
- Kenya
- Rest of Africa
- Middle East
- North America
Data Sources, Market Sizing, and Validation
Desk Research
To set up the market model, we map demand drivers and packaging output signals using public sources that can be checked by any reader. Common inputs include packaging and plastics statistics from sources such as the US EPA and Eurostat, trade and production series from the UN Comtrade database, and macro indicators from the World Bank that help explain consumption intensity.
Next, the data is organized so it links to packaging usage in food service, retail, and other day to day buying patterns. We also review sources such as association publications (for packaging and recycling), peer reviewed journal articles on packaging materials and substitution, and company annual reports and investor presentations for capacity, product focus, and geographic mix. For parts of the value chain where public data is thin, we may reference paid subscriptions used for company financials and intelligence, patent searches, and shipment level import and export reads. These examples are not exhaustive, and many other public and paid sources were also used for collection, cross-checking, and clarification.
Primary Interviews and Surveys
Primary interviews are used to test the desk assumptions against what participants report for orders, packaging specifications, and pricing changes. We speak with converters, material suppliers, brand and foodservice procurement teams, and distribution channel participants across APAC, EMEA, and the Americas, then follow up when responses show large variances that could affect the final totals.
Distribution of primary research fieldwork respondents
| Company type | Respondent position | Region |
|---|---|---|
| Top tier: 29% | CXOs: 13% | APAC: 46% |
| Mid tier: 56% | Functional/Unit leaders: 35% | EMEA: 34% |
| Smaller Players: 15% | Managers: 52% | Americas: 20% |
Market-Sizing & Forecasting
Sizing is built using a top-down model where packaging demand is reconstructed from end-use activity signals, then translated into packaging value using mix and pricing assumptions. In practice, we connect indicators such as packaged food and beverage consumption, foodservice transaction intensity, e-commerce shipment growth, and regulation-led material shifts to expected packaging usage, then convert to revenue using typical format shares and average selling price ranges.
Those totals are checked with selective bottom-up approximations to keep the output realistic. Examples include sampled converter revenue ranges by region, channel checks on pack format splits (flexible versus rigid), and spot validation of material mix shifts (paper and paperboard versus plastic, glass, and metal) where substitutions are being adopted. If bottom-up signals are incomplete for a country or end-use, gaps are handled using comparable markets with similar consumption patterns and policy settings, then adjusted after interview feedback.
For forecasting, we rely on scenario analysis supported by near-term indicators and what respondents expect for pricing and material availability. Variables that usually move the forecast include resin and paper price direction, recycled content availability, adoption of mono-material designs, packaging lightweighting, and the pace of single-use restriction enforcement, which together explain why growth can differ across regions and end-use areas.
Data Validation & Update Cycle
Before sign-off, results are triangulated against independent signals such as trade flows for key packaging materials, packaging output trends, and macro consumption measures, and then reviewed for unusual jumps at country and regional levels. If a variance cannot be explained by a clear driver like pricing or mix change, we recheck the inputs and, when needed, re-contact participants to confirm what changed and when.
A multi-step internal review is followed so calculations, assumptions, and unit conversions remain consistent across the full model. Reports are refreshed annually, and interim updates are made when material events occur, such as major regulation changes or sharp feedstock price moves. Right before delivery, a final analyst pass is completed so the client receives the latest updated view.
Mordor Intelligence's Single Use Packaging Market Size Measured Against Other Published Estimates
Published market sizes for single-use packaging often do not match because the market label is used differently by different publishers, even when they all quote USD values. Differences usually come from what gets counted as single-use, which end-use industries are emphasized, and how price and mix are projected over time.
Reusable and returnable packaging systems sit outside Mordor Intelligence's scope here, so the model stays tied to one-time-use packs and disposables rather than broader packaging value pools. Other estimates can also diverge when they anchor on a different base year, apply aggressive or conservative material substitution assumptions, or use one blended price curve without checking regional packaging mix changes and currency timing.
Benchmark comparison
| Source | Market Size | Gaps in Research Methodology |
|---|---|---|
| Mordor Intelligence | USD 48.16 B (2026) | |
| Industry Data Publisher A | USD 30.60 B (2024) | Uses an earlier base year and a revenue pool that appears narrower for higher-value rigid formats, which can understate totals when format mix and inflation effects are not carried forward consistently. |
| Research House B | USD 40.49 B (2023) | Anchors on a 2023 base and reports a shorter forecast window, and the disclosed scope does not clearly separate single-use packs from adjacent packaging uses, which can shift totals depending on inclusion rules by end use. |
The benchmark spread mainly comes from base-year selection and what each publisher treats as part of the single-use revenue pool. By keeping the scope focused on one-time-use packaging items and then validating mix and pricing assumptions with repeat checks, the final number remains explainable and easier to replicate from transparent inputs.


Key Questions Answered in the Report
How large is the single-use packaging market in 2026?
The single-use packaging market size is USD 48.16 billion in 2026 with a 5.85% CAGR toward 2031.
Which region grows fastest through 2031?
The Middle East and Africa posted the highest 7.55% CAGR forecast, fueled by infrastructure expansion and rising consumer spend.
Which material gains share fastest?
Paper and paperboard leads growth at a 6.55% CAGR as brands switch to recyclable substrates in response to policy mandates.
What product type leads volume?
Pouches and sachets lead with 30.05% 2025 revenue and maintain a 6.55% CAGR due to convenience and material-efficiency advantages.
Which end-use sector shows highest growth?
Personal care and cosmetics expands at a 6.88% CAGR as brands deploy refill pouches and fiber sachets to meet sustainability goals.
Page last updated on:


 Your data is secure and never sold or shared.


