
Single Tooth Implants And Dental Bridges Market Size and Share
Market Overview
| Study Period | 2020 - 2031 |
|---|---|
| Market Size (2026) | USD 7.03 Billion |
| Market Size (2031) | USD 9.81 Billion |
| Growth Rate (2026 - 2031) | 6.88 % |
| Fastest Growing Market | Asia-Pacific |
| Largest Market | North America |
| Market Concentration | Medium |
Major Players *Disclaimer: Major Players sorted in no particular order Image © Mordor Intelligence. Reuse requires attribution under CC BY 4.0. | |
Single Tooth Implants And Dental Bridges Market Analysis by Mordor Intelligence
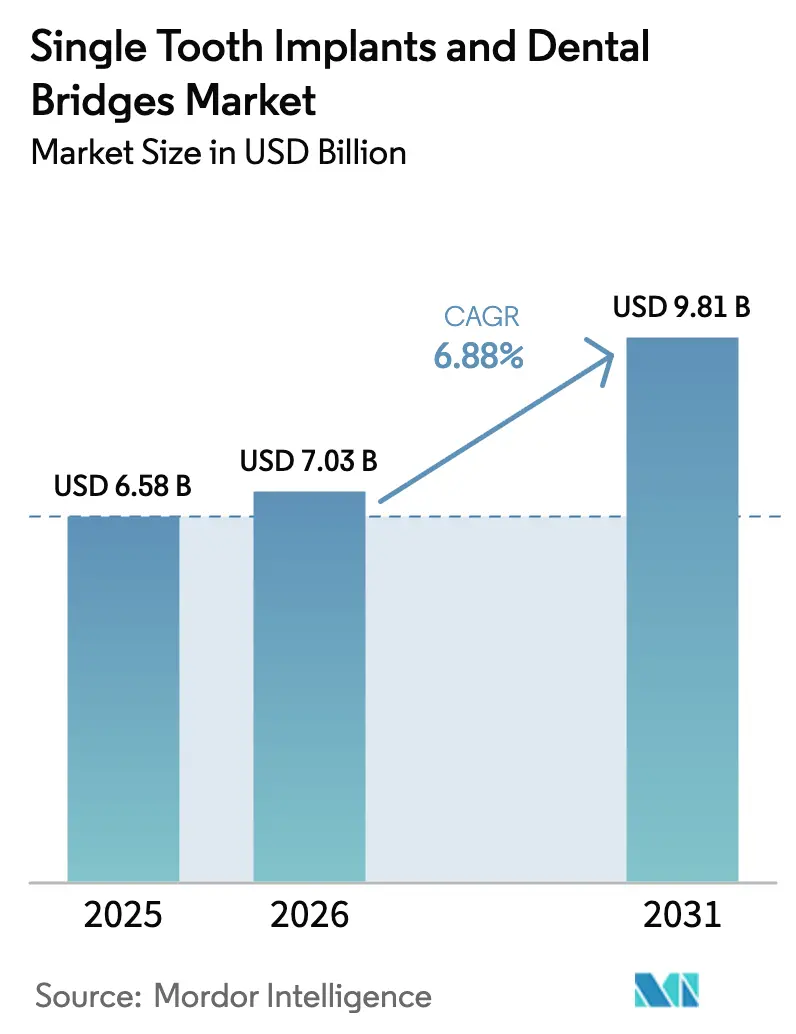
The single tooth implants and dental bridges market size was valued at USD 6.58 billion in 2025 and estimated to grow from USD 7.03 billion in 2026 to reach USD 9.81 billion by 2031, at a CAGR of 6.88% during the forecast period (2026-2031). A confluence of population aging, expanding aesthetic expectations, and digitally enabled chairside production methods underpins this trajectory, with metal-based systems still dominant yet ceramic alternatives gaining traction [1]. North America retains scale leadership, while Asia-Pacific records the sharpest uptake thanks to disposable-income growth and medical-tourism accords. Top manufacturers emphasize integrated CAD/CAM ecosystems that allow same-day restorations, reshaping practice economics and lifting case-acceptance rates. On the supply side, titanium and zirconia sourcing risks, along with a shortage of certified implantologists in emerging economies, temper the otherwise optimistic outlook.
Key Report Takeaways
- By material, metals led with 58.35% revenue share in 2025; zirconia and other ceramics are projected to expand at a 7.22% CAGR to 2031.
- By product, single tooth implants captured 62.60% of the single tooth implants and dental bridges market share in 2025, while dental bridges are forecast to grow at 7.31% CAGR through 2031.
- By end-user, dental clinics commanded 67.55% share of the single tooth implants and dental bridges market size in 2025, whereas hospitals post the highest projected CAGR at 7.46% for 2026-2031.
- By geography, North America accounted for 40.78% revenue share in 2025; Asia-Pacific is advancing at a 7.54% CAGR to 2031.
Note: Market size and forecast figures in this report are generated using Mordor Intelligence’s proprietary estimation framework, updated with the latest available data and insights as of 2026.
Market Trends and Insights
Drivers Impact Analysis of Single Tooth Implants And Dental Bridges Market*
| Driver | (~) % Impact on CAGR Forecast | Geographic Relevance | Impact Timeline |
|---|---|---|---|
| Rising demand for preventive & cosmetic dentistry | +1.2% | Global, with premium segments in North America & Europe | Medium term (2-4 years) |
| Increasing prevalence of edentulous & geriatric population | +1.8% | Global, concentrated in aging societies of Japan, Germany, Italy | Long term (≥ 4 years) |
| Rapid adoption of digital workflows | +1.4% | North America & Europe leading, APAC catching up | Short term (≤ 2 years) |
| Growing insurance coverage & value-based dental care models | +0.9% | North America primarily, expanding to Europe | Medium term (2-4 years) |
| Proliferation of chair-side milling enabling same-day bridges | +0.8% | Global, concentrated in developed markets with digital infrastructure | Short term (≤ 2 years) |
| Expansion of dental-tourism clusters via bilateral health accords | +0.6% | APAC core, spill-over to MEA and Latin America | Medium term (2-4 years) |
| Source: Mordor Intelligence | |||
Rising Demand for Preventive & Cosmetic Dentistry
Urban consumers prioritize early intervention that preserves natural tooth structure and delivers high-end esthetics. The American Dental Association recorded 23% growth in cosmetic procedures in 2024, and single-unit implants are increasingly preferred over tooth-supported bridges because they leave adjacent teeth untouched [2]. Digital smile-design tools align clinical and esthetic goals, while intraoral scanners combined with chairside mills reduce chair time, spurring same-day delivery and higher patient satisfaction. Premium implant materials, especially zirconia, meet esthetic demands in anterior zones and command pricing power. Practices that bundle preventive services with implant therapy achieve stronger lifetime patient value, reinforcing the single tooth implants and dental bridges market’s upward curve.
Increasing Prevalence of Edentulous & Geriatric Population
Global longevity keeps demand robust, as 23% of adults aged 65-74 were fully edentulous in 2024 [3]. Immediate-loading protocols show >96% success when comorbidities are controlled, positioning implants as the preferred solution for aging patients. Hydrophilic and bioactive surface technologies improve outcomes in osteoporotic bone, while minimally invasive, outpatient-ready procedures dovetail with aging-in-place care models. Consequently, the single tooth implants and dental bridges market receives a structural tailwind from demographic momentum.
Rapid Adoption of Digital Workflows
Clinics using fully integrated CAD/CAM systems recorded 34% higher case-acceptance rates in 2024. Sub-50 µm scanner accuracy underpins reliable restorative fits, and AI-driven design modules shave design cycles by 60%. Open-architecture platforms let clinicians source affordable blanks without compromising quality, expanding access in cost-sensitive markets. Same-day bridges created via chairside milling reshape patient expectations, keeping the single tooth implants and dental bridges market on its digital fast track.
Growing Insurance Coverage & Value-Based Dental Care Models
Seventy-eight percent of Medicare Advantage plans covered implants in 2024, elevating volumes among older adults. Private insurers view implants’ lower lifetime maintenance cost as economically sound, fostering bundled-payment pilots that favor multi-unit implant bridges. Digital documentation platforms provide outcome data that supports value-based contracting, anchoring reimbursement expansion and stimulating the single tooth implants and dental bridges market.
Restraints Impact Analysis of Single Tooth Implants And Dental Bridges Market*
| Restraint | (~) % Impact on CAGR Forecast | Geographic Relevance | Impact Timeline |
|---|---|---|---|
| High procedure cost & limited reimbursement | -1.1% | Global, most pronounced in emerging markets | Medium term (2-4 years) |
| Shortage of skilled implantologists in emerging economies | -0.7% | APAC, Latin America, parts of MEA | Long term (≥ 4 years) |
| Titanium & zirconia supply-chain volatility from geo-political tensions | -0.5% | Global, with acute impact on European and North American manufacturers | Short term (≤ 2 years) |
| Stricter ESG limits on precious-metal use in PFM restorations | -0.3% | Europe and North America primarily, expanding globally | Long term (≥ 4 years) |
| Source: Mordor Intelligence | |||
High Procedure Cost & Limited Reimbursement
Implant therapy costs USD 3,000–6,000 per tooth, far exceeding typical annual dental-benefit caps of USD 1,500, leaving a funding shortfall that curbs adoption. Financing plans fill gaps but carry 17.9% average interest, making them less appealing to middle-income patients. Although value-based care models propose bundled payment structures, uptake remains confined to large, integrated health systems. As long as out-of-pocket exposure stays high, demand elasticity will cap upside in price-sensitive regions.
Shortage of Skilled Implantologists in Emerging Economies
Low- and middle-income countries report an implantologist density below 8% of the dental workforce, creating service bottlenecks. Training programs demand 12-24 months, a commitment many dentists cannot accommodate. While simplified kits and guided-surgery sleeves shorten learning curves, complex full-arch reconstructions still require specialist expertise. Workforce scarcity therefore slows procedure ramp-up in high-growth geographies.
*Our forecasts treat driver/restraint impacts as directional, not additive. The impact forecasts reflect baseline growth, mix effects, and variable interactions.
Single Tooth Implants And Dental Bridges Market Segment Analysis
By Material:
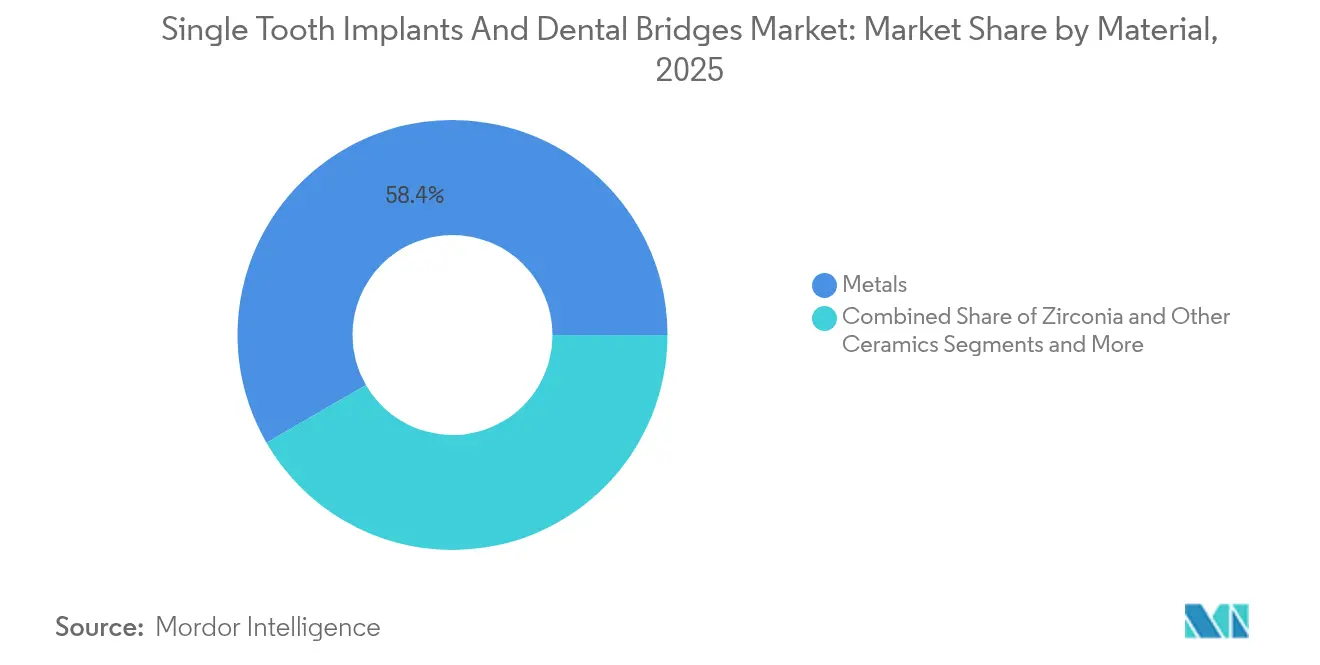
Biocompatible Innovation Drives DifferentiationMetals retained 58.35% of the single tooth implants and dental bridges market share in 2025 thanks to titanium’s four-decade safety record and cost-effective machining. The single tooth implants and dental bridges market size for metals reached USD 3.84 billion that year, reflecting their entrenched clinical acceptance. In contrast, zirconia and other ceramics logged a 7.22% CAGR outlook through 2031, propelled by demand for metal-free esthetics in anterior restorations and growing evidence of favorable soft-tissue response.
Proprietary modifications, such as Nobel Biocare’s hydrophilic surface, narrow survival-rate gaps between zirconia and titanium, with five-year rates approaching 97.3%. Regulatory pathways eased when the FDA broadened 510(k) routes in 2024, unlocking faster market entry for ceramic systems. ESG scrutiny over precious-metal use in porcelain-fused-to-metal crowns further tilts momentum toward ceramics, reinforcing the premium-pricing corridor and elevating brand differentiation strategies inside the single tooth implants and dental bridges market.

By Product:
Bridge Configurations Gain Clinical MomentumSingle tooth implants dominated 62.60% of 2025 revenue, equal to USD 4.12 billion of the single tooth implants and dental bridges market size. Their popularity stems from the ability to preserve adjacent tooth structure while delivering long-term durability. Yet implant-supported bridges hold the speed advantage, with a 7.31% CAGR forecast through 2031. Evidence from Institut Straumann’s PRO Arch registry cites 98.2% survival at 3 years for immediate-load full-arch cases.
Digital workflow advances allow pre-surgical virtual wax-ups that streamline guide fabrication, tighten implant parallelism, and support screw-retained prostheses that eliminate cement risks. Such efficiencies resonate with high-volume practices and reinforce bridges as the growth engine within the single tooth implants and dental bridges market.
By End-User:
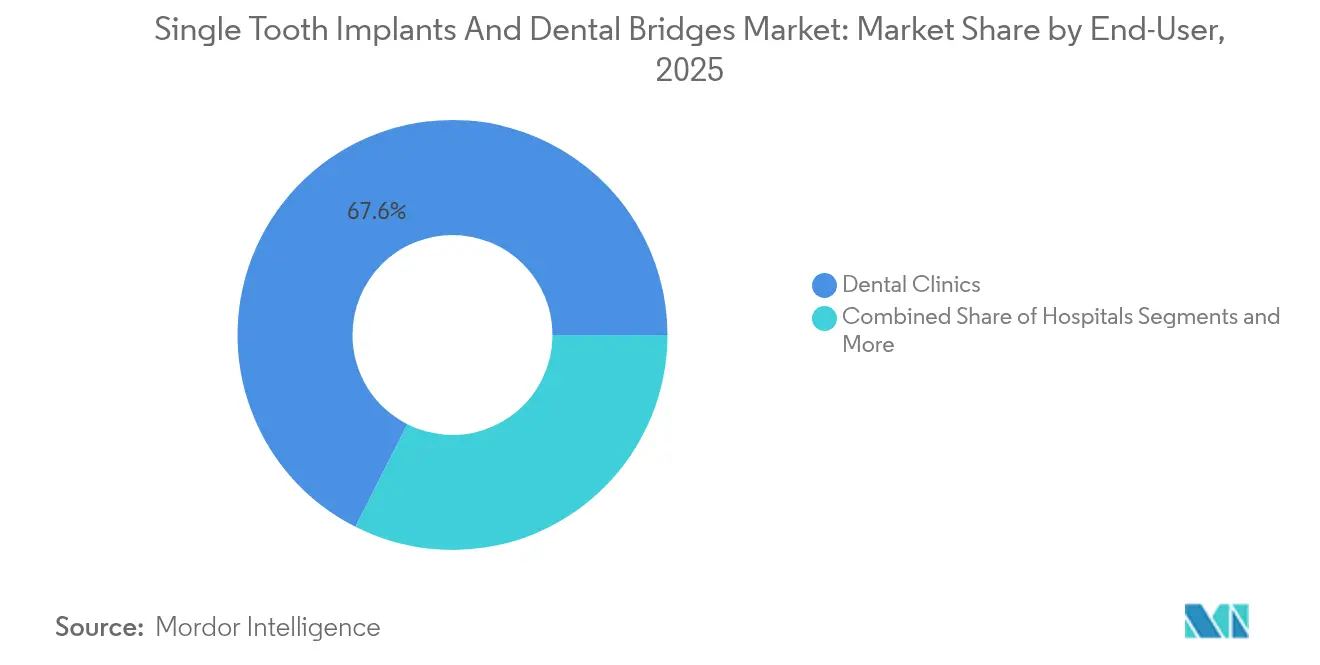
Hospital Integration Accelerates AdoptionDental clinics held 67.55% revenue share in 2025, equivalent to USD 4.45 billion of the single tooth implants and dental bridges market size. Clinics benefit from specialized staff and flexible pricing, but growth momentum is shifting toward hospitals that post a 7.46% CAGR forecast to 2031. Hospital programs integrate oral-surgery suites with imaging departments, enabling complex grafting and oncology-related reconstructions under one roof.
University-affiliated centers push translational research; Penn Dental Medicine, for instance, shortened osseointegration timelines by 40% using bioactive coatings. Institutional settings also facilitate bundled insurance contracts that couple implant therapy with systemic-care pathways, enlarging patient access and deepening the single tooth implants and dental bridges market penetration inside integrated-delivery networks.
Geography Analysis
North America Single Tooth Implants and Dental Bridges Market
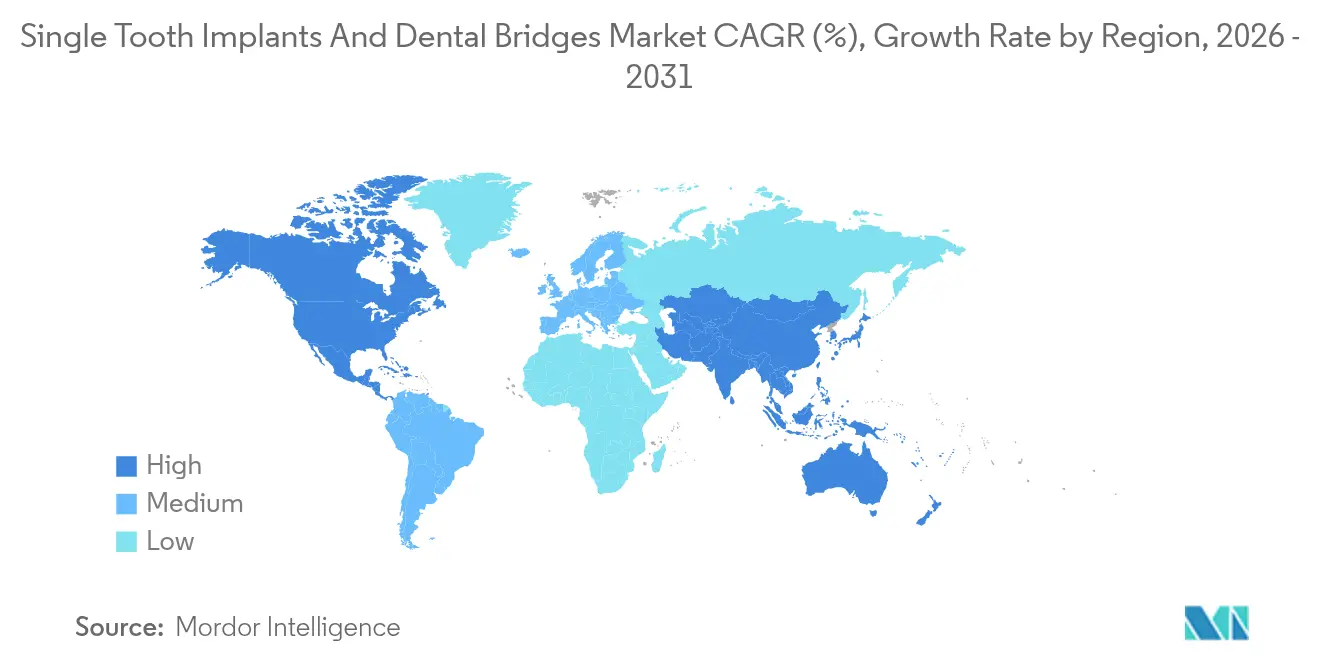
North America led with 40.78% of 2025 revenues, supported by Medicare Advantage expansions that unlocked implant coverage for 12.4 million seniors. Well-established digital infrastructures speed adoption of chairside workflows, and private insurers increasingly reimburse implant-supported bridges under value-based contracts. U.S. regulatory rigor favors incumbents with the scale to fund clinical trials, thereby concentrating market power.
Europe Single Tooth Implants and Dental Bridges Market
Europe follows with harmonized EU MDR rules that cut compliance redundancy. Germany reported 847,000 implant procedures in 2024, underpinned by statutory insurance co-payments that offset patient costs. The United Kingdom’s MHRA accelerated ceramic-implant approvals post-Brexit, making it an attractive pilot market for innovative materials. Scandinavian countries, buoyed by state dental benefits, posted the world’s highest per-capita implant placements, reinforcing premium demand for zirconia solutions.
APAC Single Tooth Implants and Dental Bridges Market
Asia-Pacific is the fastest riser at a 7.54% CAGR forecast, with China’s enhanced insurance plan covering 340 million citizens for restorative dental care. Japan’s geriatric needs spur protocols adapted to osteoporotic bone, while South Korea capitalizes on medical tourism that blends esthetics and competitive pricing. India’s low implantologist density tempers near-term uptake, yet expanding dental-school capacity and public-private training initiatives suggest an inflection point later in the decade. These dynamics collectively enlarge the single tooth implants and dental bridges market footprint across diverse economic contexts.
Regulatory Landscape
Single tooth implants and implant-supported bridge components are regulated as medical devices, with the United States commonly using the FDA 510(k) pathway under Class II dental implant classifications (21 CFR 872.3640). Recent clearances for ceramic and restorative component systems have reinforced 510(k) as the primary route for incremental design, surface, and material changes where substantial equivalence can be demonstrated, which supports faster iteration cycles for established manufacturers.
In Europe, Regulation (EU) 2017/745 (EU MDR) continues to govern conformity assessment, with emphasis on technical documentation, clinical evaluation, and post-market surveillance for implantable devices, including through 2026. Standardization is also tightening technical-file expectations, with ISO 10451:2026 specifying required technical file contents for dental implant systems. That requirement works alongside commonly used test frameworks such as ISO 10993 for biocompatibility, ISO 14801 for fatigue testing, and ISO 11607 for sterile packaging validation, increasing documentation and verification demands across global launches.
Value Chain Analysis
The value chain spans upstream titanium and zirconia sourcing, R&D (design, surface engineering, and component prototyping), regulated manufacturing with process validation and lot-level quality controls, and downstream commercialization through direct sales forces, distributors, and dental laboratory channels. Compliance activities are embedded throughout manufacturing and release, with mechanical performance testing, biological evaluation, and packaging and cleanliness validation supporting submissions and ongoing surveillance, tying regulatory readiness to throughput and time-to-market.
Downstream, integrated digital dentistry increases coordination between manufacturers, clinics, and laboratories. Intraoral scanning, CAD design, and chairside or lab-side milling and printing drive abutment and bridge turnaround times, while also shaping inventory strategy for blanks and components. Global scale players with multi-country footprints and established channels, including ZimVie across an international footprint, use training and workflow support to drive product pull-through. At the same time, supply volatility in titanium and zirconia increases the importance of dual sourcing, qualified suppliers, and buffer-stock planning for implant fixtures and ceramic restorative inputs.
Competitive Landscape
The single tooth implants and dental bridges market features moderate concentration, with top firms combining proprietary surfaces, digital ecosystems, and extensive clinical proof. Straumann’s 14.3% organic revenue growth in 2024 stems from its seamless scanner-to-mill workflow, positioning the group firmly in the premium implant tier. Dentsply Sirona’s CEREC Primemill processes zirconia crowns in under 15 minutes, enhancing chairside immediacy and nudging share gains in integrated practices. Nobel Biocare broke ground with its FDA-cleared NobelPearl ceramic system, delivering faster osseointegration and satisfying esthetic-zone demand.
Asian entrants such as Osstem and Neobiotech pursue value strategies, leveraging regional manufacturing to price 20-30% below Western peers. Their CE-marked guided-surgery kits shorten chair time by 18 minutes, appealing to volume-driven clinics. Nonetheless, limited long-term data constrains premium adoption in risk-averse markets. ZimVie invests USD 45 million to enlarge Indiana production, focusing on automated quality checks that improve consistency and support North American growth targets.
Single Tooth Implants And Dental Bridges Industry Leaders
-
ZimVie Inc
-
Dentsply Sirona
-
Solventum
-
Ivoclar Vivadent AG
-
Institut Straumann AG
- *Disclaimer: Major Players sorted in no particular order

Single Tooth Implants And Dental Bridges Market Companies Covered in this Report
- Dentsply Sirona
- Solventum
- Nobel Biocare Services
- ZimVie
- Ivoclar Vivadent
- Straumann Group
- AVINENT
- CAMLOG Biotechnologies
- Bicon
- Envista Holdings
- BioHorizons
- DENTAURUM
- Osstem Implant Co., Ltd.
- Neobiotech Co., Ltd.
- MIS Implants Technologies Ltd.
- Henry Schein
- Glidewell Dental
- Planmeca
- GC Corporation
- Coltene Holding
- Zimmer Biomet
- TAV Dental
Read Analysis of Single Tooth Implants And Dental Bridges Companies
Market Opportunities and Future Outlook
Workflow-driven solutions create a practical whitespace where same-day restorative demand overlaps with implant prosthetics. Chairside CAD/CAM adoption and packaged clinical pathways (diagnostics, guided surgery, and restorative components) give clinics a route to improve single-unit and bridge case conversion, particularly where shorter treatment timelines and higher acceptance rates are valued, consistent with the 34% higher case-acceptance rates reported by clinics using fully integrated CAD/CAM systems in 2024.
Material and compliance-led differentiation also supports opportunities for premium, documented ceramic systems and standardized technical files. The publication of ISO 10451:2026 raises expectations for technical-file completeness, which favors suppliers able to provide validated data packages and consistent component libraries across implant and bridge indications. In parallel, FDA 510(k) clearances for newer ceramic and restorative component offerings, along with company-led U.S. launches such as ZimVie rollouts following FDA clearance, show how regulatory milestones feed portfolio refresh cycles and broader geographic expansion after local approvals are obtained.
Recent Industry Developments in Single Tooth Implants And Dental Bridges Market
- March 2026: Dentsply Sirona - Announced the scientific program and masterclasses for the Implant Solutions World Summit 2026, held in Gothenburg, Sweden, on June 25-27, 2026, featuring the company's full implant portfolio including prosthetic and regenerative solutions. The announcement underscores a continued emphasis on education and clinical adoption to expand use of its implant ecosystems. The move enhances its market visibility among practitioners and supports future demand for integrated workflows and regenerative offerings.
- October 2025: ZimVie Inc. - Completed its acquisition by ARCHIMED, an investment firm focused on healthcare industries, resulting in ZimVie common stock no longer trading on the NASDAQ. The deal consolidates the company within ARCHIMED's healthcare platform, potentially enabling more focused capital deployment and product development. This restructuring may affect channel strategies and North American capacity planning as the integration unfolds.
- May 2025: Dentsply Sirona - Implemented a restructure of its implant business, introducing three signature workflows including a Partial Multi-Tooth Replacement workflow for three-unit bridges on two implants and a Full Arch workflow for fixed bridge restorations on four implants. The reorganization aligns product offerings with streamlined chairside workflows and broader system solutions. The move is intended to boost efficiency and standardize adoption of its implant prosthetic and regenerative arrays.
Single Tooth Implants And Dental Bridges Market Report Scope and Research Methodology
Market Definition and Coverage
This market covers revenues from replacing a single missing tooth using either a single tooth implant solution or a dental bridge, including the related restorative components sold through dental care settings.
Scope exclusions: We exclude orthodontics, removable dentures, full-arch systems, and general dental consumables that are not specific to single tooth implants or bridges.
Segments Covered in This Report
- By Material
- Metals
- Zirconia & other ceramics
- Porcelain-Fused-to-Metal (PFM)
- By Product
- Single Tooth Implants
- Dental Bridges
- By End-User
- Dental Clinics
- Hospitals
- Academic & Research Institutes
- Others
- By Geography
- North America
- United States
- Canada
- Mexico
- Europe
- Germany
- United Kingdom
- France
- Italy
- Spain
- Rest of Europe
- Asia-Pacific
- China
- Japan
- India
- Australia
- South Korea
- Rest of Asia-Pacific
- Middle East and Africa
- GCC
- South Africa
- Rest of Middle East and Africa
- South America
- Brazil
- Argentina
- Rest of South America
- North America
Data Sources, Market Sizing, and Validation
Desk Research
Desk work starts with mapping the patient and procedure base, and then translating that into demand for implant and bridge restorations by region. We leaned on public oral health and demographic statistics, such as the World Health Organization, the US CDC, and the US Census Bureau, which help confirm aging trends and tooth-loss burden that shape procedure pools.
To ground product availability and clinical adoption, we reviewed sources such as the US FDA device databases, peer reviewed dental journals, and association publications such as the American Dental Association, then cross-checked company annual reports, investor presentations, and credible press coverage on CAD/CAM and materials shifts. Where needed, paid subscriptions already available to us were used for company financials, patent tracking, and import and export shipment signals, which helps sanity-check pricing and supply movement. These examples are not exhaustive, and many other public and paid sources were also reviewed to collect, validate, and clarify data points.
Primary Interviews and Surveys
Primary interviews were used to validate the treatment mix between implants and bridges, typical replacement cycles, and how case complexity shifts average selling prices across materials. We spoke with dental clinic decision makers, lab-facing professionals, distributors, and product specialists across major regions so regional reimbursement patterns and chairside digital workflow adoption could be reflected in assumptions.
Distribution of primary research fieldwork respondents
| Company type | Respondent position | Region |
|---|---|---|
| Top tier: 29% | CXOs: 15% | APAC: 46% |
| Mid tier: 51% | Functional/Unit leaders: 40% | EMEA: 33% |
| Smaller Players: 20% | Managers: 45% | Americas: 21% |
Market-Sizing & Forecasting
Sizing begins with a top-down build where tooth loss prevalence, treated patient rates, and procedure volumes are reconstructed by country and then rolled up to regions, before converting to value using typical pricing bands for implant cases and bridge cases. To keep totals realistic, we corroborate them with selective bottom-up approximations, such as sampled ASP times estimated units in key countries, distributor channel checks, and a light roll-up of reported dental segment revenues where disclosures allow.
The model is driven by repeatable inputs, including the share of single tooth replacement treated with implants versus bridges, the split of materials used (metals, zirconia and other ceramics, and porcelain-fused-to-metal), and the rate of digital dentistry adoption that affects lab versus chairside production. We also incorporate region-specific reimbursement and out-of-pocket patterns that influence acceptance rates. When data is thin for smaller countries, assumptions are borrowed from comparable markets and adjusted using dentist feedback and macro indicators such as income and dental visit frequency.
For forecasting, we run scenario analysis around the most sensitive levers, mainly procedure growth, price progression by material, and the pace of zirconia and ceramic substitution. Those scenarios are then narrowed using expert consensus from interviews so the final forecast stays practical and consistent with what clinics and labs expect over the next few years.
Data Validation & Update Cycle
Outputs are checked against independent signals, including procedure volume direction, dental care spending trends, and visible changes in device approvals or trade movement that would not fit the model story. Any large variance at country level is reworked by revisiting key assumptions, and if needed, respondents are re-contacted to confirm whether the shift is real or driven by an incorrect input.
Before sign-off, the model and logic go through multi-step analyst reviews, with a final pass to ensure the latest publicly available updates are reflected. Reports are refreshed annually, and interim updates are triggered when material events occur, such as sharp pricing changes in titanium or zirconia inputs or major reimbursement changes that can move procedure volumes quickly.
Mordor Intelligence's Single Tooth Implants and Dental Bridges Market Size Compared With Other Published Estimates
Published numbers for this market often differ because the revenue pool can change based on what is treated as an implant case versus a bridge case, and on whether adjacent restorative items are bundled into the same value. Timing also contributes, since some estimates start from a different base year and then apply faster or slower price and volume curves.
The biggest gap drivers we see are scope choices (for example, folding broader dental prosthetics into the total), differences in assumed treated rates for single tooth replacement, and how average selling prices are modeled across metals and ceramic-heavy mixes. Another common reason is refresh cadence, where older pricing bands or outdated procedure mix shares keep estimates drifting even when the patient pool trend is similar, a gap reduced by the annual refresh and procedure-mix checks applied in the model by Mordor Intelligence.
Benchmark comparison
| Source | Market Size | Gaps in Research Methodology |
|---|---|---|
| Mordor Intelligence | USD 6.58 B (2025) | |
| Trade Journal A | USD 6.22 B (2024) | Uses an earlier base year and appears to apply a narrower value definition that can undercount newer ceramic-driven ASP uplift and post-2024 procedure recovery in several countries. |
| Industry Research Publisher B | USD 7.20 B (2025) | Likely includes a wider restorative bundle around bridges and implant-supported components, and may apply higher list-price style ASPs without fully netting typical clinic and distributor discounting. |
Across the three figures, the spread is mainly explained by what is included in the revenue pool and how fast prices and procedure volumes are allowed to move after the chosen base year. By keeping the count tied to single tooth implant and bridge procedures, and then converting to value using validated pricing bands and material mix shifts, the final number stays traceable to a small set of inputs that can be repeated and checked.
Key Questions Answered in the Report
How large is the single tooth implants and dental bridges market in 2026?
The sector generated USD 7.03 billion in 2026, reflecting strong demand across restorative and esthetic applications.
What is the expected CAGR for the single tooth implants and dental bridges market through 2031?
The market is projected to grow at a 6.88% CAGR between 2026 and 2031, powered by digital workflow adoption and demographic aging.
Which material segment is growing the fastest?
Zirconia and other ceramics are advancing at a 7.22% CAGR due to superior esthetics and favorable soft-tissue response.
Which region shows the highest growth momentum?
Asia-Pacific posts the strongest outlook with a 7.54% CAGR, fueled by rising incomes and medical-tourism inflows.
Which product type is expanding more rapidly?
Implant-supported dental bridges outpace single units with a 7.31% CAGR, aided by immediate-loading protocols.
Who are the leading companies in this space?
Institut Straumann AG, Dentsply Sirona, Nobel Biocare, ZimVie, and Ivoclar Vivadent collectively account for over half of global revenues.