
Single Origin Tea Market Size and Share
Market Overview
| Study Period | 2021 - 2031 |
|---|---|
| Market Size (2026) | USD 3.3 Billion |
| Market Size (2031) | USD 4.81 Billion |
| Growth Rate (2026 - 2031) | 7.83 % |
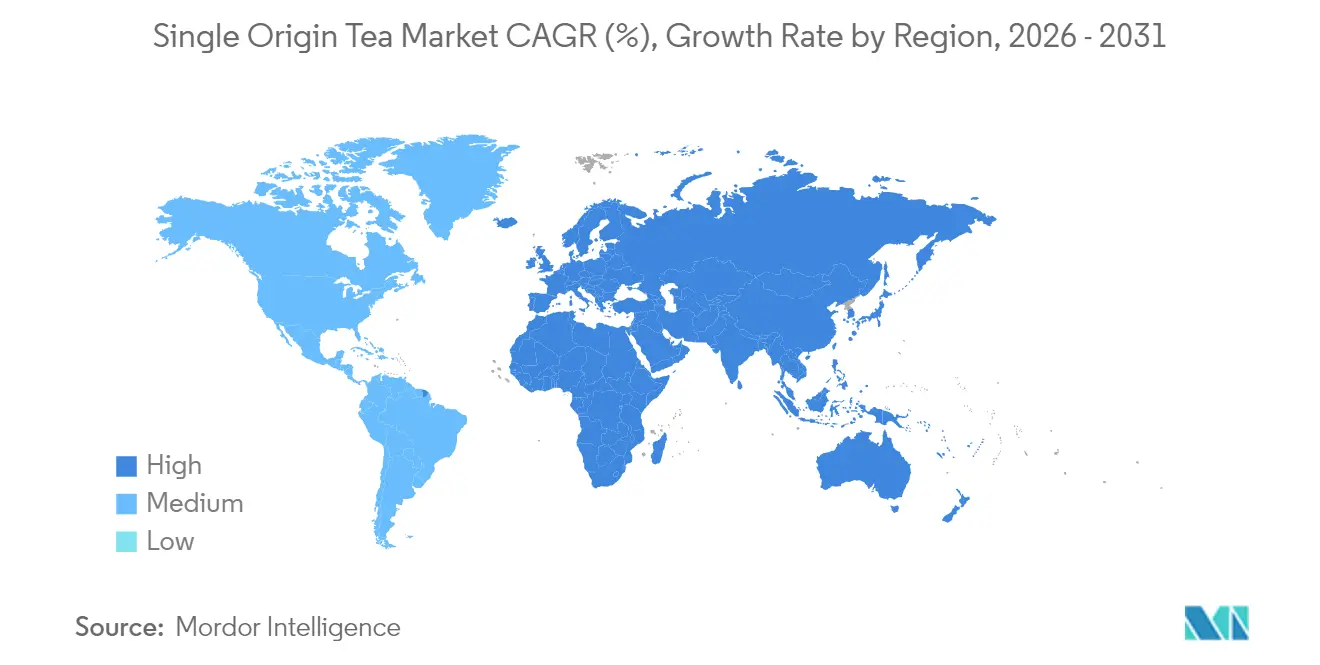
| Fastest Growing Market | Europe |
| Largest Market | Asia-Pacific |
| Market Concentration | Low |
Major Players *Disclaimer: Major Players sorted in no particular order Image © Mordor Intelligence. Reuse requires attribution under CC BY 4.0. | |
Single Origin Tea Market Analysis by Mordor Intelligence
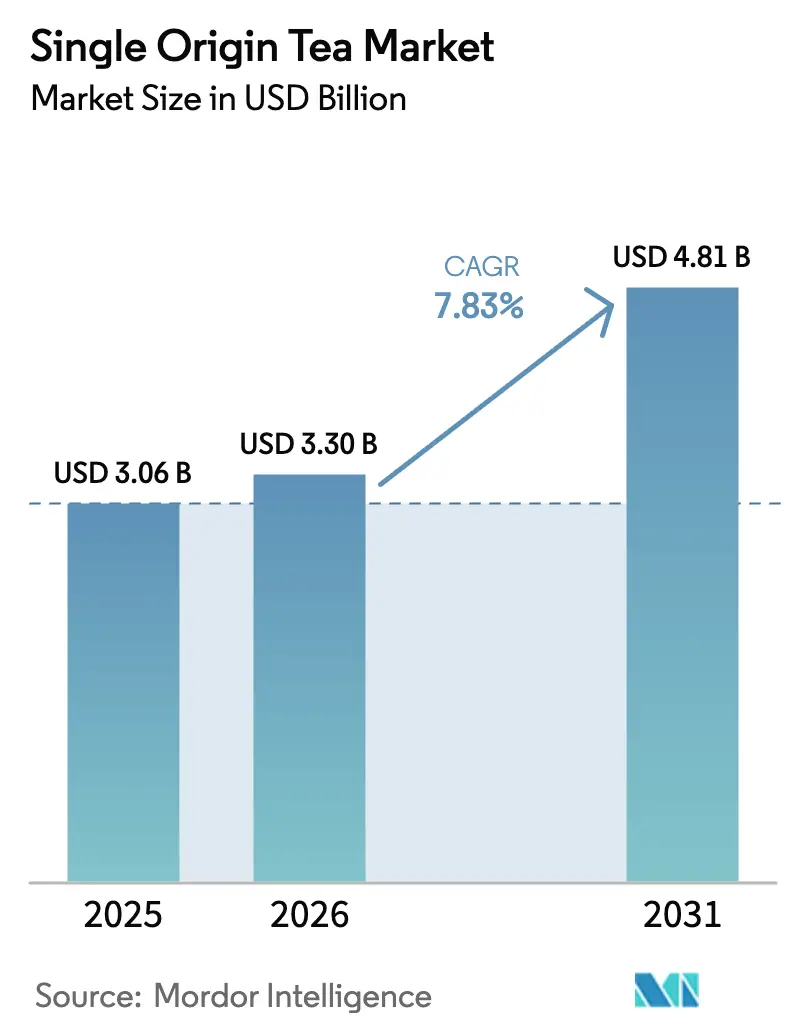
The single-origin tea market size was valued at USD 3.06 billion in 2025 and estimated to grow from USD 3.3 billion in 2026 to reach USD 4.81 billion by 2031, at a CAGR of 7.83% during the forecast period (2026-2031). Premiumization, heightened wellness awareness, and a surge in digital commerce are driving up demand for traceable, terroir-specific teas. Consumers are increasingly favoring estates that provide transparent origin data, as they seek products that align with their values of sustainability and authenticity. In response, producers are turning to blockchain traceability and adopting carbon-smart farming practices to meet these expectations. Retailers are shifting their focus to curated assortments that cater to niche preferences and emphasize quality. Meanwhile, cafés and specialty tea houses are highlighting provenance stories, which not only enhance the perceived value of their offerings but also create a deeper connection with consumers. Smallholder farmers, responsible for about 60% of the global tea supply, are tapping into new income streams[1]. They benefit from direct-trade premiums, which offer fairer compensation, and carbon credits, which help mitigate the financial pressures of climate-related challenges while promoting environmentally sustainable practices.
Key Report Takeaways
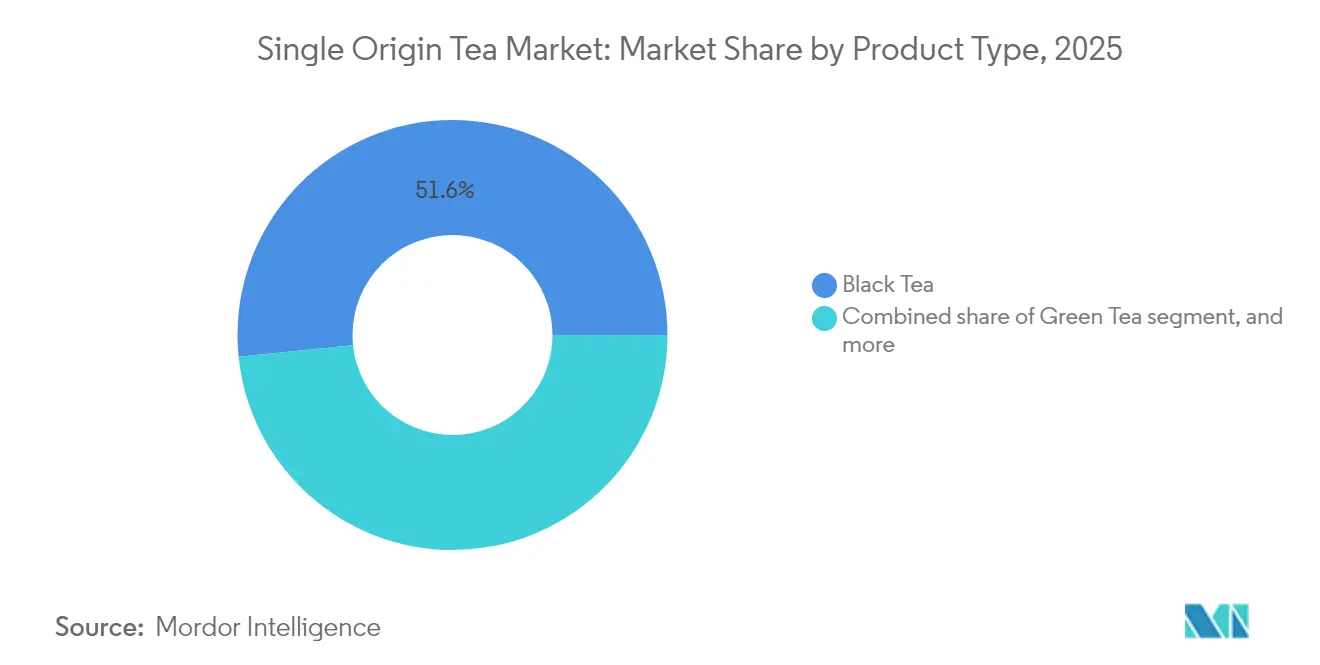
- By product type, black tea led with a 51.62% single origin tea market share in 2025, while green tea is forecast to post the fastest 9.15% CAGR between 2026-2031.
- By packaging, tea bags accounted for 48.10% of the single origin tea market size in 2025, whereas loose-leaf formats are projected to grow at an 8.21% CAGR through 2031.
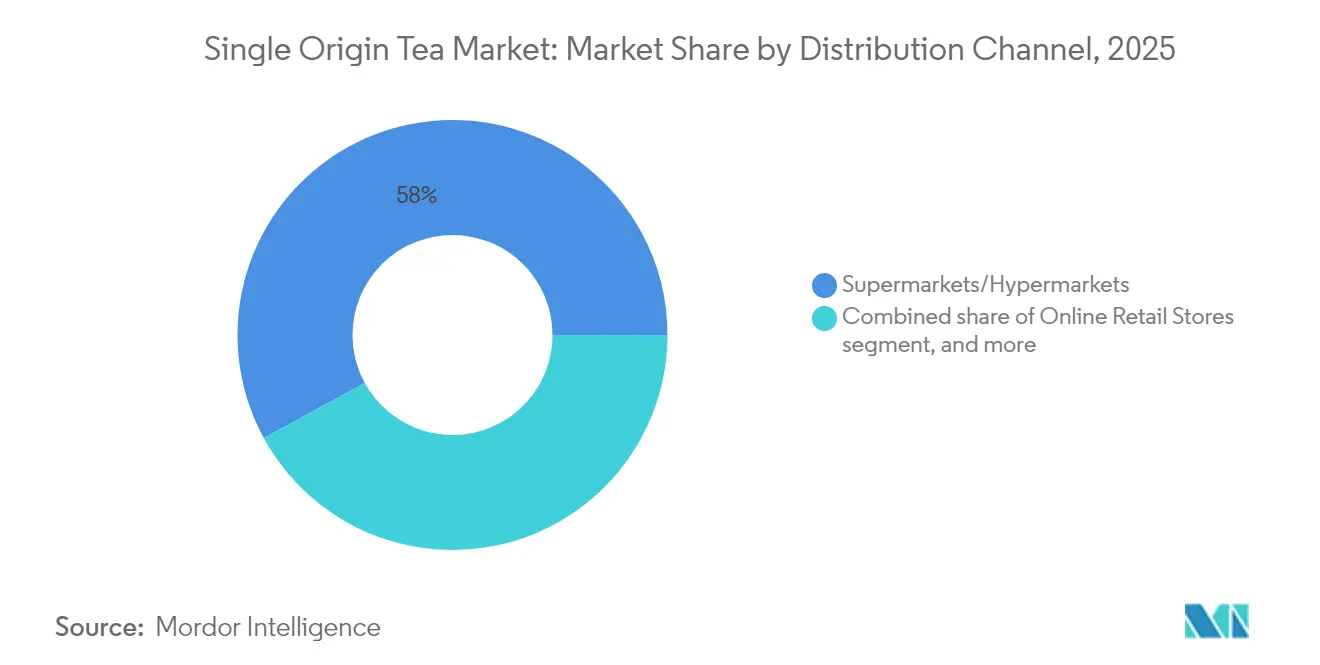
- By distribution channel, supermarkets and hypermarkets captured 57.95% revenue share in 2025; online retail is expected to register the highest 8.62% CAGR to 2031.
- By geography, Asia-Pacific contributed 36.35% of 2025 global revenue, while Europe is set to expand at a leading 9.98% CAGR during 2026-2031.
Note: Market size and forecast figures in this report are generated using Mordor Intelligence’s proprietary estimation framework, updated with the latest available data and insights as of 2026.
Market Trends and Insights
Drivers Impact Analysis of Single Origin Tea Market*
| Driver | (~) % Impact on CAGR Forecast | Geographic Relevance | Impact Timeline |
|---|---|---|---|
| Premiumisation of specialty teas | +1.8% | Global, with concentration in North America and Europe | Medium term (2-4 years) |
| Health-and-wellness focus on polyphenol-rich teas | +1.5% | Global, led by developed markets | Long term (≥ 4 years) |
| E-commerce and D2C subscription acceleration | +1.2% | Global, with early adoption in Asia-pacific and North America | Short term (≤ 2 years) |
| Rising café culture and specialty tea houses | +0.9% | Urban centers globally, concentrated in Asia-Pacific | Medium term (2-4 years) |
| Blockchain farm-to-cup traceability gains | +0.7% | Major producing regions: India, Sri Lanka, Kenya | Long term (≥ 4 years) |
| Carbon-credit income from regenerative tea farms | +0.6% | Producing regions with carbon market access | Long term (≥ 4 years) |
| Source: Mordor Intelligence | |||
Premiumization of specialty teas
Affluent buyers are willing to pay premiums for specific lots that highlight their estate and harvest origins, driven by the desire for unique and high-quality products. Through direct trade, growers sidestep auctions, enabling them to negotiate prices based on scarcity, which not only supports sustainable wages but also fosters long-term relationships between growers and buyers. Social media plays a pivotal role in amplifying tasting rituals and narrating origin stories, creating a deeper connection between consumers and the product. Legal protections, like Darjeeling's geographical indication (GI) status, safeguard the authenticity and reputation of such provenances, ensuring that these products maintain their exclusivity in the market. Retailers are increasingly allocating shelf space to micro-lots, recognizing the growing consumer demand for premium and niche offerings. Meanwhile, cafés proudly showcase rotating single-estate menus, which not only reinforce a sense of exclusivity but also provide customers with a curated experience that justifies elevated price points.
Health-and-wellness focus on polyphenol-rich teas
Clinical research highlights the cardiovascular and neuroprotective benefits of habitual tea consumption. This has led health-conscious consumers to swap sugary beverages for these antioxidant-rich brews. Green, white, and lightly oxidized oolong teas, known for their high concentrations of EGCG and catechins, are in the spotlight. Studies suggest that tea polyphenols can mitigate risks associated with cardiovascular diseases, certain cancers, and neurodegenerative disorders. For instance, these compounds are believed to improve endothelial function, reduce inflammation, and combat oxidative stress, which are key factors in the development of such conditions. Observational data even point to a daily intake of three cups being linked to a reduction in the risk of myocardial infarction[2]. Labels indicating single origin not only promise purity and minimal processing but also resonate with the clean-label trend, propelling green tea varieties to robust growth. Endorsements from public health agencies further validate the benefits of daily tea consumption, bolstering its premium demand.
E-commerce and D2C subscription acceleration
Producers are leveraging online shops and monthly subscription boxes to connect directly with global buyers, sidestepping brokers and enhancing their profit margins while simultaneously collecting first-party data. These strategies enable producers to build stronger relationships with their customers by offering personalized experiences, exclusive products, and direct access to premium offerings. Approximately 15% of online beverage shoppers are now enrolled in at least one recurring tea subscription, generating consistent revenue streams and promoting consumer education through narrative-driven inserts and QR-code linked field footage that provide insights into the production process, such as farming practices and the journey of tea from leaf to cup. With the aid of real-time inventory tools, estates can introduce limited micro-lot releases, taking advantage of scarcity premiums in the single-origin tea market while creating a sense of exclusivity and urgency among buyers. This approach not only boosts sales but also helps producers differentiate their offerings in an increasingly competitive market.
Rising café culture and specialty tea houses
From Kuala Lumpur to Seoul, urban centers are witnessing a surge in tea bars. These establishments, manned by trained sommeliers, offer ceremonial brews and sensory tasting flights, providing a unique and immersive experience for tea enthusiasts. As the hospitality sector rebounds, food-service volumes rise, creating opportunities for innovative offerings and driving consumer interest in premium beverages. Curated menus are now familiarizing patrons with single-estate tea selections, many of which find their way into retail channels, expanding their reach to a broader audience and contributing to the growth of the tea market. Operators are elevating the status of teas, akin to fine wines. Menus now detail specifics like cultivar, altitude, and harvest season, all of which bolster premium pricing and cater to the growing demand for transparency, authenticity, and quality in the tea market[3].
Restraints Impact Analysis of Single Origin Tea Market*
| Restraint | (~) % Impact on CAGR Forecast | Geographic Relevance | Impact Timeline |
|---|---|---|---|
| Climate-driven yield and quality volatility | -1.4% | Major producing regions: India, Kenya, Sri Lanka | Short term (≤ 2 years) |
| Price premiums restricting mass adoption | -0.8% | Global, particularly price-sensitive markets | Medium term (2-4 years) |
| Origin-labelling compliance complexity | -0.5% | Export markets with strict regulatory requirements | Long term (≥ 4 years) |
| Shortage of skilled single-estate tea masters | -0.4% | Traditional producing regions | Long term (≥ 4 years) |
| Source: Mordor Intelligence | |||
Climate-driven yield and quality volatility
Erratic rainfall and rising temperatures are stunting leaf growth and altering flavor profiles, putting at risk the reputations of estates known for their consistent terroir expression. In Kenya, gardens face production losses when temperatures surpass 35 °C, as extreme heat affects both the quantity and quality of tea leaves. In response, they've turned to investments in drip irrigation systems to optimize water usage, shade nets to protect crops from direct sunlight, and drought-resistant cultivars to ensure resilience against changing climatic conditions. These measures aim to mitigate the adverse effects of climate change and stabilize production levels. However, smaller farms grapple with securing financing for such measures, as limited resources and access to credit hinder their ability to adopt these solutions. This creates potential supply gaps that threaten the premium image of the single-origin tea market, which relies heavily on consistent quality, exclusivity, and the unique characteristics of its terroir.
Price premiums restricting mass adoption
High retail price tags, often two to four times steeper than those of blended teas, restrict access for lower-income consumers, limiting their ability to purchase premium tea products. This pricing disparity creates a significant barrier to market penetration, particularly in price-sensitive regions. In emerging markets, where tea holds a staple status, economic slowdowns and inflation lead to noticeable trade-downs as consumers opt for more affordable alternatives. To address these challenges and broaden their market reach without compromising on premium perceptions, producers are now testing smaller packaging formats, such as 25-gram tins, and introducing tiered product ladders. These strategies aim to make premium teas more accessible while maintaining their high-quality image and catering to a wider range of consumer segments. By offering smaller, more affordable packaging and a variety of product tiers, producers can attract cost-conscious consumers while retaining the loyalty of premium tea buyers, ensuring sustained growth in diverse market conditions.
*Our forecasts treat driver/restraint impacts as directional, not additive. The impact forecasts reflect baseline growth, mix effects, and variable interactions.
Single Origin Tea Market Segment Analysis
By Product Type:
Black Tea Leads while Green Tea Rises on Wellness AppealIn 2025, black tea solidified its dominance in the single-origin tea market, seizing a commanding 51.62% share. This stronghold can be attributed to cultural preferences and its adaptability for mass-market distribution. The full oxidation process of black tea lends it the malty and brisk notes that are quintessential to popular Western breakfast blends. This characteristic ensures consistent demand from both retail outlets and food-service establishments. Furthermore, the inherent shelf stability of black tea, coupled with its compatibility for large-scale procurement, has cemented its status as a cornerstone for estates and distributors. Producers hailing from renowned regions like Assam, Ceylon, and the Kenyan Highlands employ orthodox rolling techniques to maintain distinct regional flavors, seamlessly blending traditional craftsmanship with contemporary market demands. This unwavering consistency in quality and flavor profile fortifies black tea's loyalty, even amidst the rising tide of health-centric alternatives. In essence, black tea stands as the bedrock of the single-origin segment, harmonizing volume-driven production with a rich heritage branding.
Conversely, green tea is swiftly carving its niche as the market's fastest-growing segment, charting a remarkable 9.15% CAGR. Its ascent is largely attributed to a health-centric positioning, reshaping consumer perceptions of tea. Scientific endorsements, spotlighting catechins and antioxidant benefits, have propelled green tea into the limelight, especially among wellness enthusiasts prioritizing lower oxidation and functional advantages. Estates in Zhejiang and Uji, masters of pan-firing and steaming techniques, are honing their offerings to spotlight freshness and region-specific nuances, drawing in discerning buyers both domestically and abroad. This surging global interest has spurred producers to diversify, striking a balance between green and black tea lines while upholding quality. Digital platforms and specialty outlets play a pivotal role, spotlighting single-garden senchas and curated collections to health-conscious consumers. Given its resonance with the global shift towards wellness, green tea is poised to cement its status as a primary growth driver in the single-origin tea market.

By Packaging:
Tea Bags Dominate yet Loose-Leaf Reaps Premium GainsIn 2025, tea bags dominated the single origin tea market, capturing a 48.10% share. Their appeal lies in unmatched convenience, precise portion control, and adaptability to fast-paced settings like offices and travel. High-speed packing technologies, now widely adopted, enhance infusion efficiency with formats like pyramid and string-and-tag. Responding to environmental concerns, producers are rolling out compostable mesh and plastic-free options, bolstering sustainability without compromising functionality. Mainstream consumers, associating tea bags with ease and consistency, drive global demand. Furthermore, large retailers and food-service chains favor tea bags for their scalability and standardization. As brands pivot to eco-friendly formats, tea bags seamlessly blend modern utility with traditional branding.
On the other hand, loose-leaf tea is set to outpace with an 8.21% CAGR, as consumers lean towards authenticity, quality, and a richer brewing experience. Loose-leaf tea showcases full leaf expansion and whole-leaf integrity, attracting connoisseurs who appreciate flavor depth and craftsmanship. Producers use specialty packaging, like double-lid tins and opaque pouches, to shield delicate aromas from light and oxygen. Marketed as a premium offering, loose-leaf tea shines in the gifting arena, with estates presenting elegantly crafted caddies that double as storage and storytelling pieces. Digital and specialty platforms boost demand, linking buyers to single-garden estates and highlighting provenance. By focusing on ritual, sensory experience, and authentic craftsmanship, loose-leaf tea is swiftly gaining traction and establishing a coveted position in the single origin tea market.
By Distribution Channel:
Supermarkets Retain Scale while Online Retail SurgesIn 2025, supermarkets and hypermarkets accounted for 57.95% of total revenue, driven by habitual grocery trips and strategic end-cap placements that encourage spontaneous purchases. Chains across Europe and North America showcase "premium tea walls," highlighting estate-specific SKUs under soft lighting with informative signage. These displays not only attract attention but also educate consumers about the origins and quality of the products, fostering a premium shopping experience. While these chains dominate in volume, they face margin compression due to slotting fees, which are payments made by suppliers to secure shelf space, and regular price promotions aimed at driving sales.
On the other hand, online retail is experiencing a robust 8.62% CAGR, fueled by seamless global shipping, referrals from social commerce, and personalized algorithms that align consumer preferences with specific terroirs. Direct-to-consumer platforms not only promote teaware but also seasonal releases, boosting overall basket values. These platforms leverage data analytics to recommend complementary products, enhancing the shopping experience. Subscription services offer curated harvest sets, guiding newcomers through diverse flavors and cultivating brand loyalty by providing consistent, high-quality experiences. Emerging hybrid models see supermarkets integrating QR-enabled displays, connecting shoppers to estate videos. This fusion of physical and digital elements underscores the authenticity of the single-origin tea market, allowing consumers to engage with the story behind the product while making informed purchasing decisions.
Geography Analysis
APAC and MEA Single Origin Tea Market
In 2025, the Asia-Pacific region accounted for 36.35% of global tea revenue, buoyed by centuries-old agronomic practices in Assam, Yunnan, and Uva. Over generations, these regions have refined their cultivation techniques, yielding high-quality tea for both domestic and international markets. In recent years, India has strengthened its tea export market, with Darjeeling's GI protection ensuring premium legal provenance and enhancing its market value. Despite weather challenges, Kenya has demonstrated resilience through efficient production systems and cost competitiveness, solidifying its position in the single-origin tea market. Sri Lanka has also experienced growth in its tea shipments, driven by value-added packaging tailored for Middle Eastern consumers, enabling the country to tap into a lucrative and expanding market segment.
Europe Single Origin Tea Market
Europe is set to lead with a robust 9.98% CAGR through 2031, fueled by discerning palates, strict GI enforcement, and a lively café culture. European consumers are increasingly leaning towards organic and fair-trade certifications, favoring estates transparent about labor and ecological practices. The demand for traceable and ethically sourced products is pushing producers to adopt sustainable practices and advanced technologies. With the EU's traceability laws, importers are gravitating towards digitally verified supply chains, giving an edge to producers already utilizing blockchain tracking. Post-Brexit, suppliers are diversifying their logistics hubs, forging stronger connections with mainland ports to ensure uninterrupted supply and mitigate risks associated with trade barriers.
The Americas and MEA Single Origin Tea Market
North America is witnessing a surge in specialty cafés, while wellness beverages are gradually taking market share from carbonated drinks. The growing consumer preference for healthier alternatives has positioned tea as a favored choice, especially among younger demographics. E-commerce is playing a pivotal role in brand discovery, enabling smaller brands to reach wider audiences. With zero-sugar mandates, tea is basking in a health-centric spotlight, further driving its adoption. Canada's diverse demographic is cultivating a taste for varied terroirs, reflecting the multicultural influences on consumer preferences. In Mexico, an emerging middle class is shifting from bulk black tea to more refined green and oolong varieties, signaling a transition towards premiumization in the market. The Middle East and Africa are seeing a consistent rise, with Gulf hospitality embracing premium loose-leaf tea as part of traditional service offerings, enhancing the cultural and social experience. Meanwhile, South America, particularly Argentina and Colombia, is making strides in niche tea cultivation, bolstering the single-origin tea market and contributing to the region's growing reputation as a quality tea producer.
Regulatory Landscape
The regulatory landscape for single-origin tea centers on food safety, pesticide controls, and credible provenance. In the European Union, strict Maximum Residue Levels (MRLs) for pesticides shape import specifications, and buyers often apply private limits that exceed official EU levels. That typically increases testing and documentation requirements for estate-specific lots.
Compliance in major producing and exporting markets is shaped by multi-agency governance. China relies on SAMR, NHC, MARA, and GACC, with mandatory GB standards alongside GB/T and other series. Kenya's Tea Act (2020) and Tea Registration and Licensing Regulations (2024) require licensing for growers, factories, and dealers under the Tea Board of Kenya, formalizing participation and strengthening auditable controls. Globally, buyers increasingly require GFSI-recognized schemes (BRC, IFS, FSSC 22000) and geolocation-enabled provenance disclosures, reflecting EU Green Deal expectations.
Competitive Landscape
In a competitive landscape where no single firm dominates, the arena remains moderately fragmented. Heritage conglomerates, capitalizing on their global distribution prowess, present both single-estate lines and mass blends, catering to diverse consumer preferences. In contrast, boutique producers have carved a niche online, enchanting audiences with their captivating origin tales and personalized branding strategies. Sri Lanka's Dilmah, a pioneer in carbon-neutral certification, enhances its eco-friendly reputation by investing in mini-hydro plants, ensuring prime shelf space in markets that prioritize sustainability and environmental responsibility. Meanwhile, in Kenya, KTDA skillfully directs smallholder leaves into factory-specific micro-lots, leveraging Fujian's burgeoning tea trade center to expand its reach across Asia and tap into growing demand in the region.
Technology plays a pivotal role in differentiation, driving innovation and transparency across the tea industry. Taiwanese estates, adhering to the mandatory QR-traceability protocol, provide buyers with instant access to pesticide test results and harvest timelines, fostering trust and informed purchasing decisions. Indian cultivators are harnessing AI-driven plucking calendars to boost fine-leaf yields, optimizing harvest schedules for better productivity. At the same time, Chinese cooperatives are engaging Gen-Z audiences by livestreaming their pan-firing sessions, creating an interactive and immersive experience that connects consumers to the production process. Initiatives like carbon credits, supported by UNIDO, are financing biomass gasifiers, achieving a 30% reduction in scope-1 emissions. Beyond just offsetting energy expenses, these projects are creating new revenue avenues, acting as a cushion during price slumps and promoting long-term sustainability.
Strategic moves are gaining traction, reflecting a proactive approach to industry challenges. The Sri Lanka Tea Board has upgraded its GMP labs to ISO 17025 standards, enhancing its export credibility and ensuring compliance with international quality benchmarks. After a thorough audit of KTDA operations, the Tea Board of Kenya has committed to a substantial investment in fertilizer subsidies, aiming to elevate leaf quality for premium lots and improve the competitiveness of Kenyan tea in global markets. In Italy, new legislation is channeling significant funds into blockchain technology for the agri-food sector. This move suggests a potential trend across Europe, possibly leading to standardized provenance disclosures in the single-origin tea market, which could further enhance transparency and consumer confidence.
Single Origin Tea Industry Leaders
-
Dilmah Ceylon Tea Company PLC
-
Rishi Tea & Botanicals
-
ITO EN Ltd.
-
Tata Consumer Products Ltd.
-
Akbar Brothers Ltd.
- *Disclaimer: Major Players sorted in no particular order

Single Origin Tea Market Companies Covered in this Report
- Dilmah Ceylon Tea Company PLC
- Akbar Brothers Ltd.
- Tata Consumer Products Ltd.
- ITO EN Ltd.
- Teabox
- Art of Tea
- Origin Tea
- Organic India
- Kahawa Tea Company
- Rishi Tea & Botanicals
- Debonair Tea Company
- Adagio Teas
- Rare Tea Company
- Kettl Tea
- Numi Organic Tea
- Smith Teamaker
- Seven Cups Fine Chinese Teas
- Camellia Sinensis
- DAVIDsTEA
- TWG Tea
Market Opportunities and Future Outlook
Demand is shifting toward single-origin tea, with traceability and terroir branding becoming key differentiators. Private standards and QR or blockchain traceability are increasingly treated as baseline expectations in major markets, alongside geolocation verification and deforestation-free sourcing aligned with EU Green Deal requirements.
Against that backdrop, ITO EN is focusing on matcha export expansion and agri-tech alliances aimed at maintaining quality, while Tata Consumer Products promotes Trustea as a sustainable-supply-chain mechanism. Taiwan's QR-traceability protocol also highlights how mandatory data disclosure can standardize provenance storytelling across the segment.
Recent Industry Developments in Single Origin Tea Market
- June 2026: Rishi Tea & Botanicals launched a new collection of iced tea sachets including Blueberry Shiso, Peach Oolong, Citron Black, Matcha Green, and Yuzu Citrus. The launch targets the premium single-origin segment and expands the brand's iced tea portfolio. It is aimed at growing higher-margin formats and extending distribution through targeted retail and online channels.
- May 2026: ITO EN Ltd. executed a company split transferring vending machine operations to a subsidiary, renamed ITO EN NEOS Co., Ltd. This relocation moves responsibilities to a dedicated unit and reframes operational oversight. The structure is intended to optimize the cost structure and clarify distribution responsibilities across markets.
- April 2026: ITO EN INDIA PRIVATE LIMITED commenced operations in Mumbai, establishing an on-the-ground base in a major tea-producing and tea-consuming market. The company says the setup supports globalization of the Oi Ocha brand. It also enables closer coordination across sourcing, logistics, and market entry activities.
Single Origin Tea Market Report Scope and Research Methodology
Market Definition and Coverage
For this methodology, the single origin tea market covers tea products sold with a clearly stated single country, region, estate, or garden of origin, and priced and marketed as traceable, origin-specific tea across retail and foodservice.
Scope exclusions: Excludes blended teas where multiple origins are intentionally mixed, even if the blend is premium or specialty.
Segments Covered in This Report
- By Product Type
- Black Tea
- Green Tea
- Oolong Tea
- Others
- By Packaging
- Loose-leaf
- Tea Bags
- Ready-to-drink Bottles/Cans
- Others
- By Distribution Channel
- Ontrade
- Off Trade
- Supermarkets/Hypermarkets
- Convenience/Grocery Stores
- Online Retail Stores
- Other Distribution Channels
- By Geography
- North America
- United States
- Canada
- Mexico
- Rest of North America
- Europe
- Germany
- United Kingdom
- France
- Italy
- Spain
- Russia
- Netherlands
- Poland
- Belgium
- Sweden
- Rest of Europe
- Asia-Pacific
- China
- India
- Japan
- South Korea
- Australia
- Indonesia
- Thailand
- Singapore
- Rest of Asia-Pacific
- South America
- Brazil
- Argentina
- Colombia
- Chile
- Peru
- Rest of South America
- Middle East and Africa
- Saudi Arabia
- United Arab Emirates
- Nigeria
- Egypt
- Morocco
- Turkey
- South Africa
- Rest of Middle East and Africa
- North America
Data Sources, Market Sizing, and Validation
Desk Research
Desk work starts by mapping how much tea is produced and traded, and where origin claims are most common. We use public datasets such as FAOSTAT, UN Comtrade, the International Tea Committee, national agriculture and customs statistics, and Codex food labeling guidance to understand category definitions, product movement, and labeling norms.
Once the category frame is set, we screen company annual reports, investor presentations, brand sites, and reputable press to understand how single origin tea is positioned, packaged, and distributed. Select paid subscriptions supporting company financials, patent lookups, and shipment-level trade checks are used to fill gaps where public data is too broad to isolate single origin teas. The sources mentioned are illustrative and not exhaustive, and we also consulted other references to collect data, validate assumptions, and clarify open questions.
Primary Interviews and Surveys
Primary work is used to test what the desk signals cannot confirm, especially how often origin claims translate into sell-through and price premium by channel. We spoke with tea producers and exporters, brand and private-label teams, importers and distributors, specialty retailers, and foodservice buyers across major consuming and sourcing regions so the assumptions could be corrected before totals were finalized.
Distribution of primary research fieldwork respondents
| Company type | Respondent position | Region |
|---|---|---|
| Top tier: 35% | CXOs: 21% | APAC: 44% |
| Mid tier: 43% | Functional/Unit leaders: 22% | EMEA: 31% |
| Smaller Players: 22% | Managers: 57% | Americas: 25% |
Market-Sizing & Forecasting
Sizing is built using a top-down model where production, trade, and consumption indicators are reconstructed into an addressable demand pool for origin-labeled tea, then refined by channel presence and packaging mix. We corroborate totals with selective bottom-up checks, using sampled brand and importer revenue disclosures, channel checks, and volume-by-average-price approximations to reduce the risk of the totals drifting from market reality.
Key inputs that shape the model include tea import volumes by major consuming regions, export shares of origin countries known for estate and regional teas, packaging split between loose-leaf, tea bags, and ready-to-drink, on-trade versus off-trade share, and average price gaps between single origin and blended tea at retail. Where pricing is volatile, currency conversion timing and inflation effects are handled consistently, and missing price points are filled using adjacent format or channel references validated in interviews.
For forecasting, we rely on scenario analysis supported by multivariate regression on indicators such as premiumization rate, growth in specialty retail and e-commerce tea sales, and shifts in origin-traceability labeling adoption. The final forecast path is adjusted after expert feedback, especially when supply-side constraints, harvest variability, or policy changes are expected to affect availability and pricing.
Data Validation & Update Cycle
Outputs are checked against independent signals such as total tea category growth, trade-flow consistency by origin, and observed price ladders across channels, and then reviewed for breaks that do not match known market events. If a variance is too large, we recheck assumptions, revisit the input series, and re-contact sources to confirm whether the change is real or a data artifact.
Before sign-off, results go through a multi-step analyst review so calculation logic, units, and conversions are consistent across regions and years. Reports are refreshed annually, with interim updates when material events impact supply, pricing, or demand patterns. Right before delivery, an analyst performs a fresh pass so clients receive the latest updated view.
Mordor Intelligence's Single Origin Tea Market Sizing Compared With Other Published Estimates
Published numbers for single origin tea can look far apart because each publisher draws the line differently around what counts as single origin and how packaging and channels are treated. Differences also show up when current-year alignment is not consistent, since some figures are anchored on older base years and then carried forward with broad beverage assumptions.
Blended teas that still highlight a hero origin can inflate totals, and ready-to-drink can also push the market upward when it is counted as a beverage category rather than as origin-specific tea. Some studies apply a single premium price uplift across regions, while others allow the price gap to vary by channel mix, origin availability, and import duties, which changes the final value meaningfully.
Benchmark comparison
| Source | Market Size | Gaps in Research Methodology |
|---|---|---|
| Mordor Intelligence | USD 3.06 B (2025) | |
| Industry Publisher A | USD 3.64 B (2024) | Uses an earlier base year and a broader type list that can blur strict single-origin labeling, which can pull in adjacent specialty teas and lift the total. |
| Industry Publisher B | USD 3.84 B (2025) | Runs a longer forecast horizon with a slower growth profile, and the treatment of packaging formats suggests a wider inclusion of premium packaged teas without consistently filtering for single-origin claims. |
The spread is mostly explained by what gets included under the single-origin label and how pricing is carried across formats and channels. Blended teas with origin-forward marketing sit outside Mordor Intelligence's scope, which keeps the 2025 value tied to products that are clearly sold as single-origin, and the remaining steps are traceable to trade signals, channel mix, and interview-validated price gaps.
Key Questions Answered in the Report
How large is the single origin tea market in 2026?
The single origin tea market size is valued at USD 3.3 billion in 2026 with a forecast to reach USD 4.81 billion by 2031.
Which region grows fastest for single origin teas?
Europe is expected to post the fastest 9.98% CAGR through 2031, fueled by sophisticated demand and strong GI protections.
What packaging format is gaining share in premium tea?
Loose-leaf formats are advancing at an 8.21% CAGR as connoisseurs favor whole leaves that preserve terroir nuances.
How fragmented is competition among single origin brands?
The market scores 2 on a 1-10 scale, meaning no player holds over 5% share and many estates compete through origin storytelling.