
Single-Cell Genome Sequencing Market Size and Share
Market Overview
| Study Period | 2020 - 2031 |
|---|---|
| Market Size (2026) | USD 4.39 Billion |
| Market Size (2031) | USD 8.8 Billion |
| Growth Rate (2026 - 2031) | 14.94 % |
| Fastest Growing Market | Asia-Pacific |
| Largest Market | North America |
| Market Concentration | Medium |
Major Players *Disclaimer: Major Players sorted in no particular order Image © Mordor Intelligence. Reuse requires attribution under CC BY 4.0. | |
Single-Cell Genome Sequencing Market Analysis by Mordor Intelligence
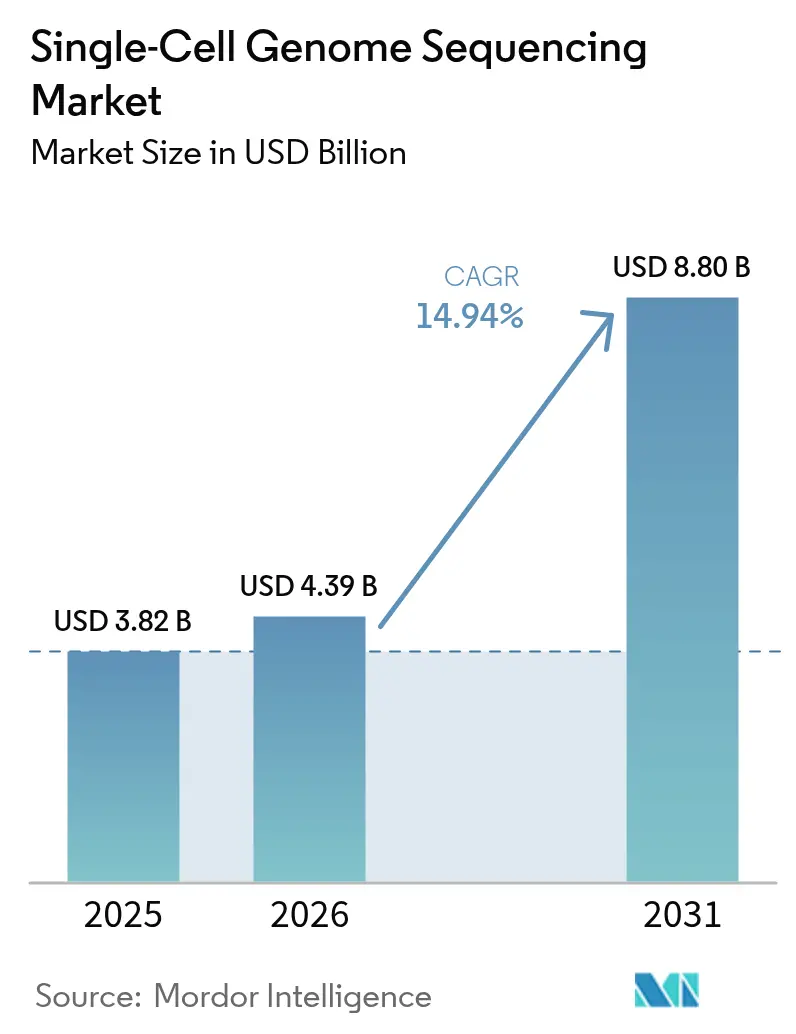
The single-cell genome sequencing market size was valued at USD 3.82 billion in 2025 and estimated to grow from USD 4.39 billion in 2026 to reach USD 8.8 billion by 2031, at a CAGR of 14.94% during the forecast period (2026-2031). This momentum is driven by fast-growing precision-oncology workflows, a steep fall in per-base sequencing prices, and chemistry refinements that lift data quality to clinical-grade benchmarks. Consumable demand remains sticky because proprietary microfluidic cartridges and barcoded library kits must be reordered for every run, while the instrument category is set for a capital refresh as benchtop long-read systems lower the entry bar for mid-tier laboratories. Regulatory tailwinds also support the single cell genome sequencing market, notably the U.S. FDA’s 2024 guidance that recommends orthogonal single-cell assays for genome-edited cell therapy characterization.[1]U.S. Food and Drug Administration, “Oncomine Dx Target Test Supplement Approval,” fda.gov Competitive positioning now hinges on end-to-end workflow ownership, with vendors racing to bundle isolation, amplification, sequencing, and bioinformatics into single-invoice offerings that shorten procurement cycles for hospital labs.
Key Report Takeaways
- By product type, reagents and consumables accounted for 44.78% of the single cell genome sequencing market share in 2025, while instruments are projected to register a 16.89% CAGR to 2031.
- By sequencing technology, short-read platforms retained 66.90% share of the single cell genome sequencing market size in 2025; long-read modalities are advancing at an 17.88% CAGR in the forecast window.
- By workflow stage, genomic analysis and data interpretation represented 68.25% of revenue in 2025 and are growing at a 17.21% CAGR through 2031.
- By application, oncology led with 39.10% revenue share in 2025; immunology and infectious disease are forecast to expand at an 18.05% CAGR through 2031.
- By end user, pharmaceutical and biotechnology companies are projected to record a 17.12% CAGR through 2031, surpassing academic institutes in incremental spending.
- North America held 43.70% geographic share in 2025; Asia-Pacific is set to grow fastest at a 16.72% CAGR between 2026 and 2031.
Note: Market size and forecast figures in this report are generated using Mordor Intelligence’s proprietary estimation framework, updated with the latest available data and insights as of 2026.
Market Trends and Insights
Drivers Impact Analysis of Single-Cell Genome Sequencing Market*
| Driver | (~) % Impact on CAGR Forecast | Geographic Relevance | Impact Timeline |
|---|---|---|---|
| Growth in Precision Oncology & Measurable Residual Disease (MRD) Workflows | 3.2% | Global, with early concentration in North America & Western Europe | Medium term (2-4 years) |
| Advances in Single-Cell WGA Chemistry Improving Data Quality | 2.1% | Global, with R&D leadership in North America, manufacturing scale in Asia-Pacific | Long term (≥4 years) |
| Declining Sequencing Costs and Availability of High-Throughput Platforms | 2.8% | Global, accelerated adoption in Asia-Pacific and Latin America | Short term (≤2 years) |
| Expansion of Cell-Atlas and Biobank Initiatives | 1.9% | North America & Europe core, expanding to Asia-Pacific | Long term (≥4 years) |
| Rising Tri-Omics Adoption in CGT Workflows and Translational Research | 2.4% | North America & Europe, with emerging traction in Asia-Pacific pharma hubs | Medium term (2-4 years) |
| Advances in Targeted Long-Read Single-Cell Protocols | 1.8% | Global, with early adopters in academic research institutes | Long term (≥4 years) |
| Source: Mordor Intelligence | |||
Growth in Precision Oncology and MRD Workflows
Minimal residual disease assays now use cell-level variant calling to detect malignant clones at frequencies below 0.01%, a sensitivity that bulk sequencing cannot match. Dana-Farber Cancer Institute and Memorial Sloan Kettering deployed Chromium platforms in 2024 to track clonal evolution in acute lymphoblastic leukemia cohorts, demonstrating clinical utility. FDA approval of a supplemental Oncomine Dx panel in October 2024 legitimized single-cell data in companion diagnostics, accelerating payer reimbursement and pharmaceutical trial adoption. Early MRD detection cuts relapse-associated costs and compresses oncology drug-development timelines, reinforcing spending momentum within the single cell genome sequencing market.
Advances in Single-Cell WGA Chemistry Improving Data Quality
Allelic dropout and GC bias historically limited clinical translation. Takara Bio’s 2024 PicoPLEX update achieved over 95% genome coverage at 30× depth, narrowing the fidelity gap with bulk methods.[2]Takara Bio, “PicoPLEX WGA Kit Performance,” takarabio.com BioSkryb’s primary-template-directed amplification reduced false structural calls by 60% versus legacy MDA kits.[3]BioSkryb Genomics, “Primary Template-Directed Amplification Technology,” bioskryb.com Regulators now reference uniformity metrics in submissions, favoring suppliers that document low-bias chemistries, and further fueling the single cell genome sequencing market.
Declining Sequencing Costs and Availability of High-Throughput Platforms
NHGRI tracked the fall of whole-genome prices below USD 600 in 2024. Illumina’s NovaSeq X Plus pushes 16 terabases per run at USD 2.40 per gigabase. PacBio’s USD 169,000 Vega benchtop system and Oxford Nanopore’s sub-USD 345 PromethION Plus genome target move long-read sequencing into hospital budgets. Lower prices expand the single cell genome sequencing market beyond elite core facilities.
Expansion of Cell-Atlas and Biobank Initiatives
The Human Cell Atlas released 13.5 million reference profiles in 2024, giving researchers baseline variant maps for comparative analyses Tabula Sapiens cataloged 500,000 single-cell genomes across 24 organs, revealing tissue-specific mutational signatures. National biobanks in the U.K., Japan, and South Korea now ensure new samples are single-cell ready, lowering marginal study costs and propelling the single cell genome sequencing market.
Restraints Impact Analysis of Single-Cell Genome Sequencing Market*
| Restraint | (~) % Impact on CAGR Forecast | Geographic Relevance | Impact Timeline |
|---|---|---|---|
| High Per-Sample and Instrument Costs | -1.8% | Global, with acute impact in price-sensitive Asia-Pacific and Latin America markets | Short term (≤2 years) |
| Complex Bioinformatics & Storage Burden | -1.3% | Global, particularly in regions with limited cloud infrastructure | Medium term (2-4 years) |
| Export/Procurement Restrictions Limit Platforms | -0.9% | China, Russia, and select Middle East markets under U.S. export controls | Short term (≤2 years) |
| IP Barriers and Licensing Constraints | -1.1% | Global, with concentrated impact in North America and Europe | Medium term (2-4 years) |
| Source: Mordor Intelligence | |||
High Per-Sample and Instrument Costs
Per-sample outlays range from USD 500 to USD 2,000, while flagship sequencers list at USD 1 million, deterring smaller centers. Consumables remain pricey because of proprietary cartridge designs, and cloud bioinformatics adds USD 50 to USD 150 per sample. Cost remains a short-term drag on the single cell genome sequencing market.
Complex Bioinformatics and Storage Burden
Each single-cell genome at 30× coverage yields up to 120 gigabytes. Open-source pipelines such as Seurat need scarce expertise, and EU data-sovereignty rules inhibit economical cloud solutions. AWS’s Rainbow pipeline lowered analysis costs below USD 120 in 2024, yet cross-border data transfer constraints hamper universal uptake.
*Our forecasts treat driver/restraint impacts as directional, not additive. The impact forecasts reflect baseline growth, mix effects, and variable interactions.
Single-Cell Genome Sequencing Market Segment Analysis
By Product Type:
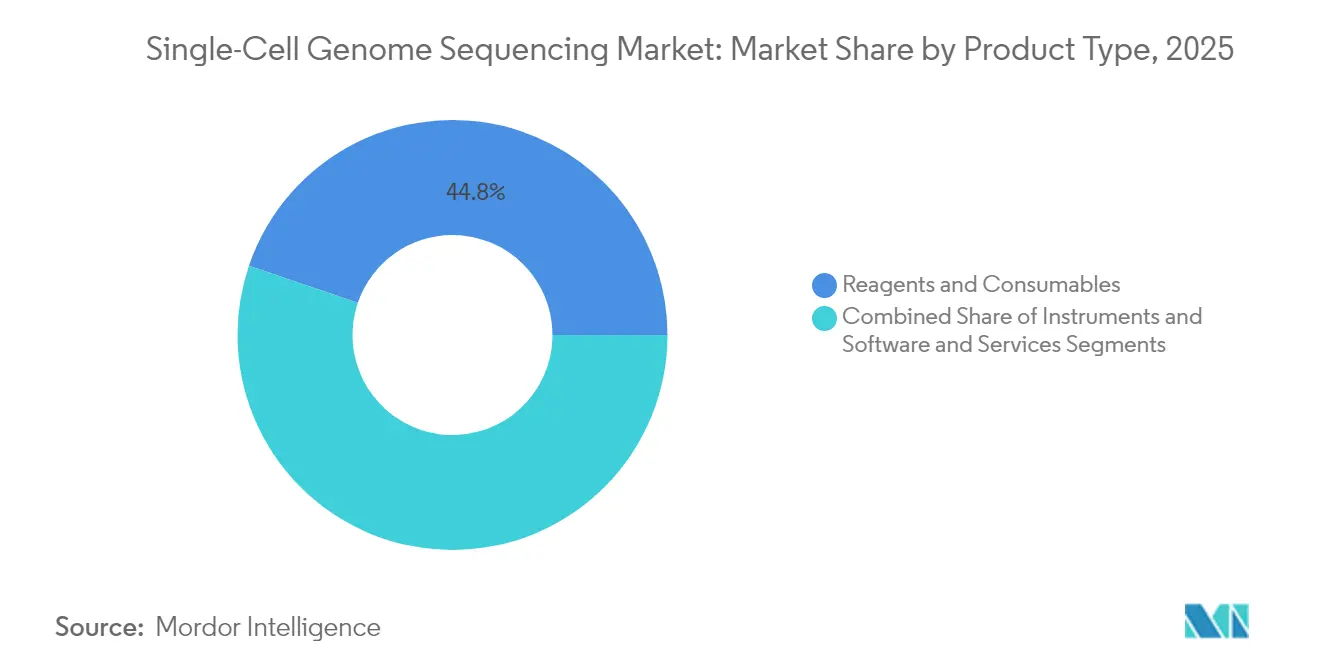
Recurring Consumables Anchor Revenue, Instruments See Capital RefreshReagents and consumables captured 44.78% of 2025 revenue, underscoring their recurring nature within the single cell genome sequencing market size context. Proprietary microfluidic cartridges tie every experiment to vendor-specific kits, creating predictable reorder cycles even as instrument placements mature. Instruments are projected to grow at 16.89% CAGR because benchtop long-read systems, like the USD 169,000 Vega, allow mid-cap institutes to buy rather than schedule core-facility time.
Install-base expansion sets a replacement wave in motion, especially in North America where early NovaSeq units near depreciation. Universal library kits from Takara Bio and QIAGEN aim to loosen consumable lock-in, but integrated vendors defend share through lease financing and bundled reagents. Software subscriptions monetize bioinformatics through per-sample fees instead of perpetual licenses, aligning revenue with throughput and supporting long-term cash flow visibility across the single cell genome sequencing market.


By Sequencing Technology:
Short-Read Dominance Faces Long-Read DisruptionShort-read platforms held 66.90% share of the single cell genome sequencing market in 2025 on the back of NovaSeq and NextSeq economies. Long-read growth at 17.88% CAGR is fueled by structural-variant detection and haplotype phasing prowess, which short reads cannot match without complex assemblies.
Oxford Nanopore’s PromethION Plus promises sub-USD 345 genomes, while targeted capture methods eliminate whole-genome amplification, improving data fidelity for prenatal genetics and oncology. Regulatory frameworks still evolve for long reads, yet early clinical validations suggest escalating displacement potential within the single cell genome sequencing industry.
By Workflow Stage:
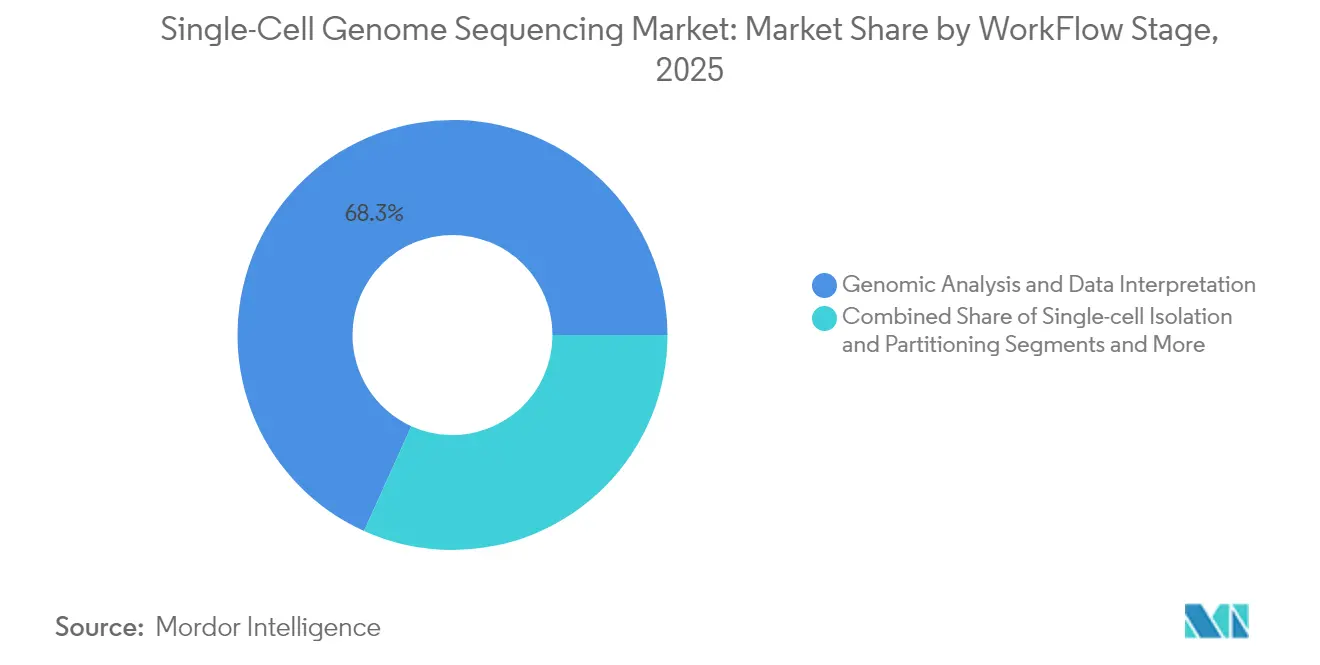
Data Interpretation Captures the Greatest ValueGenomic analysis and data interpretation held 68.25% revenue in 2025 and will remain the profit core. Cloud pipelines like AWS Rainbow drop compute charges, but validated clinical software attracts premiums for lowering false-discovery rates.
Partitioning tools commoditize as patents expire, eroding margins for stand-alone cartridge vendors. Chemistry breakthroughs in whole-genome amplification, such as BioSkryb’s PTD protocol, translate directly into higher confidence variant calls and enlarge addressable clinical niches. These dynamics collectively underpin the high-value interpretation tier that defines profitability inside the single cell genome sequencing market.
By Application:
Oncology Leads, Immunology AcceleratesOncology maintained 39.10% revenue share in 2025, driven by MRD detection and clonal evolution tracking. Immunology is poised for an 18.05% CAGR as single-cell immune profiling gains traction in vaccine design and host-pathogen studies. Prenatal and embryo genetics leverage long reads for haplotype phasing without invasive parental sampling, delivering premium per-sample pricing and raising the overall single cell genome sequencing market size in this niche.
Neurology research expands steadily thanks to reference atlases, yet clinical adoption is gated by biopsy constraints. Metagenomics emerges as a precision-infection management tool, using cell-level genomes to select antibiotics when culture fails. Centers for Medicare and Medicaid Services extended coverage to certain single-cell oncology assays in 2024, reinforcing reimbursement foundations for expansion.
By End User:
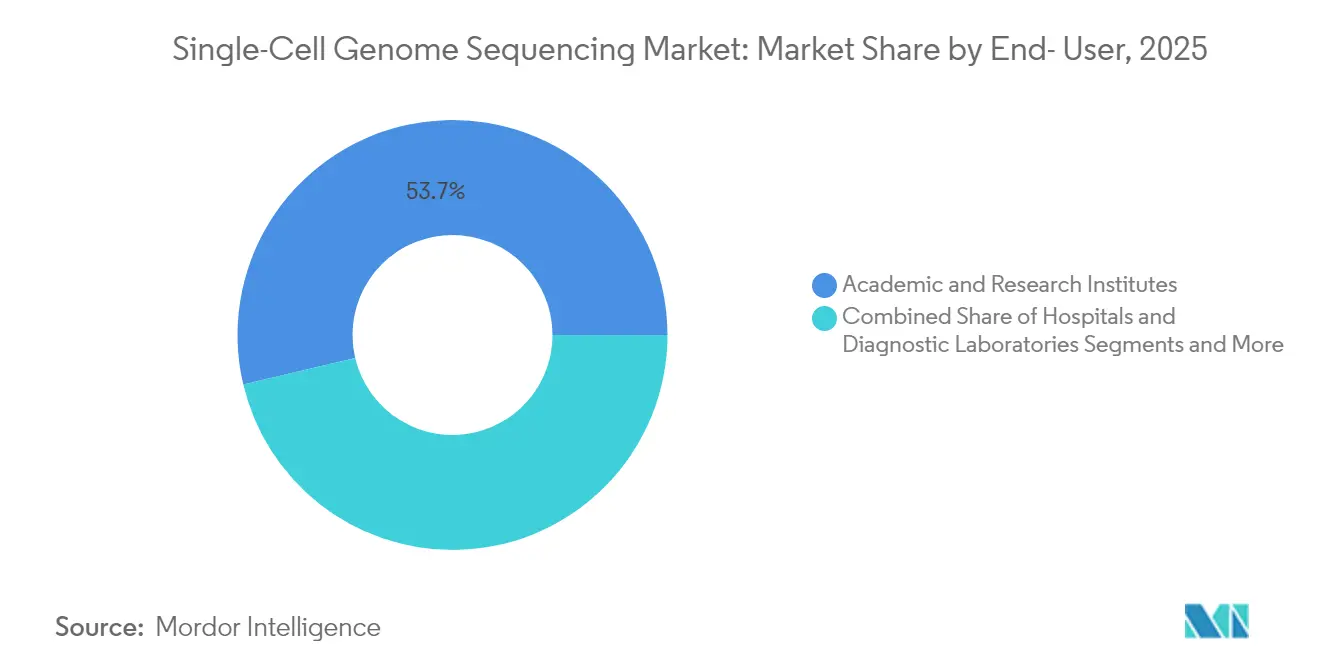
Pharma Outpaces Academia as CGT Workflows Embed Single-Cell QCAcademic institutes still held 53.70% share in 2025, but pharmaceutical and biotechnology users will grow faster at 17.12% CAGR, guided by FDA recommendations that embed orthogonal single-cell QC into gene-edited therapies CROs and CMOs adopt automated tri-omics prep to scale batch release, reinforcing vendor install bases.
Hospitals progress cautiously because bioinformatics staffing is thin, yet flagship centers such as Dana-Farber prove feasibility. Falling run costs coupled with cloud pipelines should lower the barrier, enlarging the clinical slice of the single cell genome sequencing market over the forecast horizon.
Geography Analysis
North America Single-Cell Genome Sequencing Market
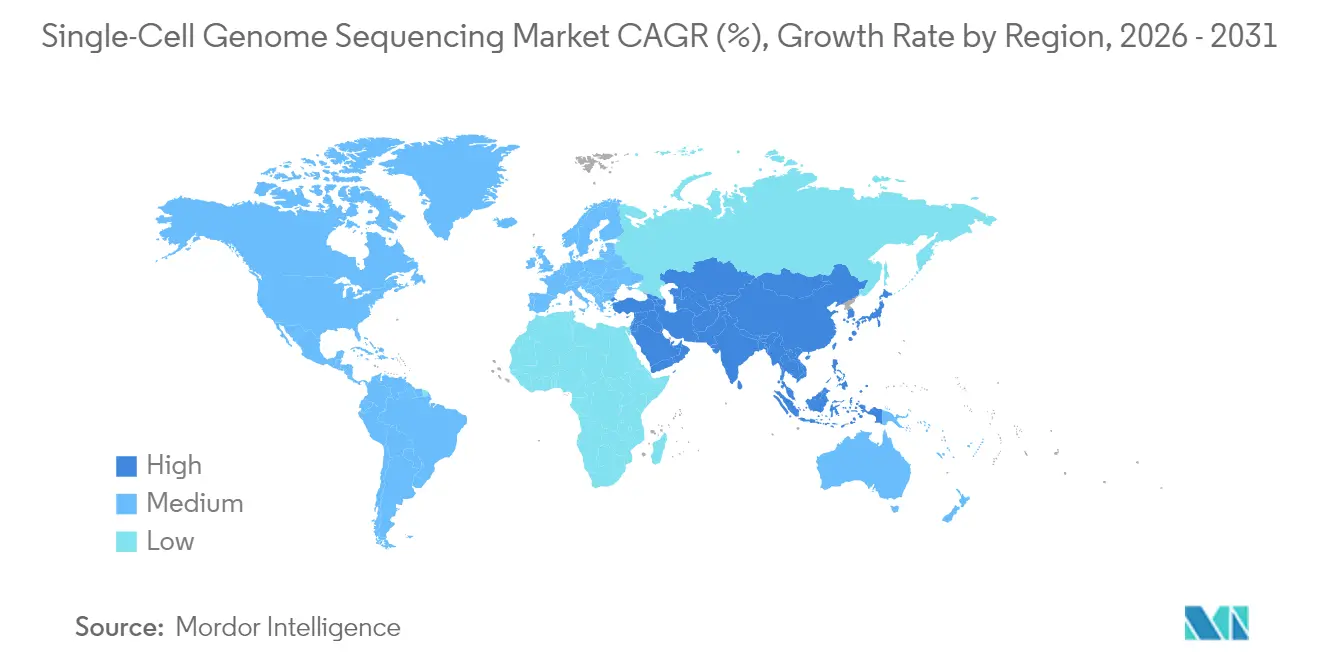
North America captured 43.70% of revenue in 2025, benefiting from NIH funding and the earliest clinical MRD implementations. The U.S. FDA’s October 2024 approval of single-cell variant calling within Oncomine Dx validated the technology for diagnostics and stimulated hospital procurement. Export controls risk parts shortages, but local manufacturing depth mitigates severe disruption.
Europe Single-Cell Genome Sequencing Market
Europe leverages cross-border consortia like Human Cell Atlas to share reference datasets, although GDPR hinders economical cloud storage. Spatial-omics adoption at Amsterdam UMC and Charité underscores innovation, yet on-premises compute investment slows roll-out.
APAC Single-Cell Genome Sequencing Market
Asia-Pacific is the fastest-growing territory at 16.72% CAGR, propelled by Chinese provincial precision-medicine budgets and Japanese pharma embedding single-cell QC in cell-therapy lines. Entity-List restrictions challenge Chinese buyers, motivating accelerated domestic instrument development by MGI Tech.
MEA and LATAM Single-Cell Genome Sequencing Market
Middle East and Africa rely on sovereign wealth funding in Gulf states for genomics centers, while Latin American growth remains currency-sensitive. Brazil’s national biobank integrated single-cell protocols in 2024, future-proofing sample assets and broadening regional access to the single cell genome sequencing market.

Regulatory Landscape
Regulatory expectations for single-cell genome sequencing cut across test validation, genomic data governance, and quality management across research and clinical pathways. In the United States, the FDA has continued to formalize expectations for next-generation sequencing (NGS) used in genome-edited product characterization, including an April 2026 draft guidance on safety assessment of genome editing using NGS. The FDA’s focus on orthogonal and highly resolved sequencing readouts is aligned with advanced therapy submissions.
In Europe, the EMA framework for companion diagnostics links assay performance and conformity assessment to associated medicinal products, tightening evidence expectations when single-cell-derived genomic biomarkers are used for patient selection. Standards bodies are also shaping compliance: ISO published ISO 25184:2026 for verified next-generation nucleotide sequences, along with advanced additional genomics informatics work in 2025-2026 (for example ISO/IEC 23092-3:2025 on genomic information metadata and APIs). These updates increase the emphasis on traceability, interoperability, and documented quality controls in regulated workflows.
Value Chain Analysis
The value chain starts with specialized upstream inputs (microfluidic chips and cartridges, high-purity enzymes, barcoding oligonucleotides, and cold-chain reagents) and moves through single-cell isolation and partitioning, whole-genome amplification and library preparation, sequencing, and downstream analysis and interpretation. Integrated platform providers (for example 10x Genomics) capture value by tying proprietary consumables to installed instruments, while specialized innovators focus on chemistry improvements (bias reduction, higher recovery) and long-read compatibility. CROs and core labs, along with bioinformatics specialists, monetize sample processing and interpretation, with genomic analysis and data interpretation already representing 68.25% of revenue in 2025.
Library preparation remains a bottleneck because it is labor-intensive and operator-driven, which pushes the chain toward automation and standardized front-end workflows. In regulated settings, qualification and change-control cycles create switching costs: lead times for critical reagents can extend to weeks, and new supplier validation can take 12-18 months under quality systems such as ISO 13485 or GMP. This dynamic favors established players with manufacturing scale, documentation depth, and cold-chain distribution networks, often routed through EU hub logistics in countries such as the Netherlands and Belgium.
Competitive Landscape
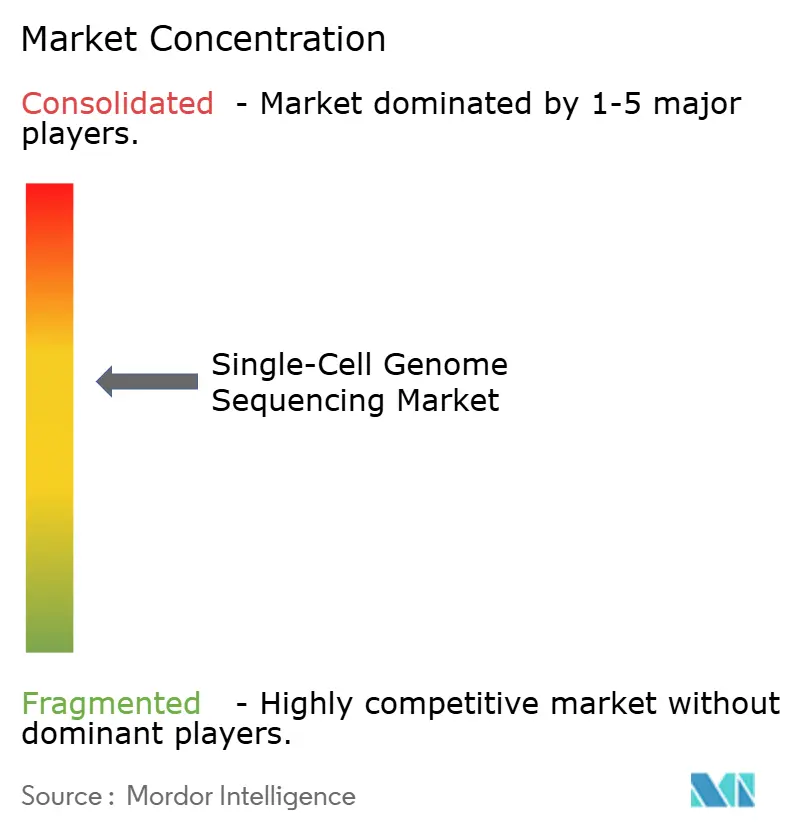
Illumina, 10x Genomics, and Thermo Fisher Scientific collectively control up to major share of global revenue, giving the single cell genome sequencing market a moderately concentrated profile. Ongoing patent litigation underscores the strategic importance of intellectual property, with 10x Genomics defending partitioning patents and Illumina contesting sequencing chemistry rivals.
Vertical integration shapes strategy: Illumina acquired Fluent BioSciences in July 2024 to internalize upstream library prep, while BioSkryb and Tecan combined automation with tri-omics chemistry in April 2025. Cloud providers now claim bioinformatics value pools; AWS delivers sub-USD 120 per-sample whole-genome analysis, decoupling interpretation from instrument franchises.
Niche specialists exploit white space. Mission Bio focuses on clonal hematopoiesis, and BioSkryb offers ultra-low input WGA for rare cells. Spatial-omics entrants add competitive pressure by retaining tissue context that dissociation loses. Overall differentiation is shifting toward workflow completeness and software ease rather than hardware throughput alone.
Single-Cell Genome Sequencing Industry Leaders
QIAGEN
Illumina, Inc.
F. Hoffmann-La Roche Ltd.
ThermoFisher Scientific, Inc.
Standard BioTools (Fluidigm)
- *Disclaimer: Major Players sorted in no particular order
Single-Cell Genome Sequencing Market Companies Covered in this Report
- Agilent Technologies
- BGI Americas
- BGI
- Bio-Rad Laboratories
- BioSkryb Genomics
- CD Genomics
- Danaher
- Roche
- Illumina
- MGI Tech
- Mission Bio
- Novogene
- Oxford Nanopore Technologies
- PacBio (Pacific Biosciences)
- Psomagen
- QIAGEN
- Silicon Biosystems (Ampli1)
- Standard BioTools (Fluidigm)
- Takara Bio
- Thermo Fisher Scientific
- Yikon Genomics

Market Opportunities and Future Outlook
Clinical and late-stage translational use cases create whitespace for vendors that package single-cell workflows into standardized, auditable offerings that reduce manual variability and support regulated documentation. Procurement signals are already tied to cell-therapy manufacturing support, including an April 2026 U.S. NIH Clinical Center sole-source intent to purchase Mission Bio Tapestri single-cell DNA and protein reagent kits for CAR-T manufacturing and clinical lot release. This aligns single-cell assays with release characterization and quality control needs.
Capacity build-out and platformization are also expanding the addressable user base beyond elite cores. In South Korea, Macrogen completed the Songdo Global Genome Center in June 2026, bringing single-cell and spatial analysis into a large integrated facility with AI-based interpretation, which supports scaled service delivery and partnership opportunities across instrument, reagent, and software suppliers. On the technology side, instrument-light and high-throughput partitioning approaches are being commercialized, including the January 2026 Factorial Bio and Honeycomb Biotechnologies partnership to deliver a scalable single-cell DNA sequencing workflow using Honeycomb Hive partitioning. This creates room for new reagent formats, automation, and downstream analytics packages suited to mid-tier laboratories and distributed clinical research networks.
Recent Industry Developments in Single-Cell Genome Sequencing Market
- June 2026: 10x Genomics acquired Proteintech Genomics, a division within Proteintech Group, to broaden proteomics capabilities that complement single-cell and spatial workflows. The deal strengthens multi-omics bundling and can increase attach rates for consumables and software across integrated single-cell platforms.
- April 2025: BioSkryb Genomics partnered with Tecan to automate tri-omics library preparation, reducing hands-on time to around 90 minutes. Automation reduces batch effects and operator variability, supporting higher-throughput deployments in pharma, CRO, and CMO environments.
- July 2024: Illumina acquired Fluent BioSciences to bring upstream single-cell library preparation more tightly into its sequencing ecosystem. The acquisition supports end-to-end workflow control and positions Illumina to drive pull-through of sequencing consumables via integrated single-cell prep options.


Single-Cell Genome Sequencing Market Report Scope and Research Methodology
Market Definition and Coverage
This market covers revenue generated from tools and services used to read DNA at the single-cell level, starting from cell isolation and preparation through sequencing and downstream analysis provided to research and clinical users.
Scope exclusions: Bulk (non single-cell) DNA sequencing and standard whole-genome sequencing projects that do not require single-cell isolation are excluded.
Segments Covered in This Report
- By Product Type
- Reagents & Consumables
- Instruments
- Software & Services
- By Sequencing Technology / Platform
- Short-read NGS
- Long-read
- PCR
- Microarray
- Other enabling technologies
- By Workflow Stage
- Single-cell isolation & partitioning
- Whole genome amplification (WGA) & library preparation
- Genomic analysis & data interpretation
- By Application
- Oncology
- Immunology & Infectious Disease
- Prenatal/Embryo Genetics & Reproductive Health
- Neurology & Somatic Mosaicism
- Microbiology & Metagenomics
- By End User
- Academic & Research Institutes
- Pharmaceutical & Biotechnology Companies
- Hospitals & diagnostic laboratories
- By Geography
- North America
- United States
- Canada
- Mexico
- Europe
- Germany
- United Kingdom
- France
- Italy
- Spain
- Rest of Europe
- Asia-Pacific
- China
- Japan
- India
- Australia
- South Korea
- Rest of Asia-Pacific
- Middle East & Africa
- GCC
- South Africa
- Rest of Middle East & Africa
- South America
- Brazil
- Argentina
- Rest of South America
- North America
Data Sources, Market Sizing, and Validation
Desk Research
Desk research is used to map the demand setting for single-cell DNA work and to get a clean view of how fast the science is moving into routine lab workflows. Public sources we refer to include clinical trial registries (such as ClinicalTrials.gov), peer-reviewed publication databases (such as PubMed), patent databases (such as USPTO and EPO search portals), and government research funders (such as NIH RePORTER and the European Commission CORDIS database). We also use official statistics and reference pages from organizations such as the OECD, plus public health and science agencies (such as CDC and NCBI) to validate terminology, disease program focus, and adoption context.
On the commercial side, we review company filings, annual reports, investor presentations, conference posters, and reputable science press coverage to track product launches, instrument placements, and pricing direction. Where needed, paid subscriptions are used for company financials and intelligence, and patent database views are used to track filing volume by workflow step, which then supports assumptions on technology momentum. These desk research sources are illustrative only, and many other public references were reviewed for data capture, validation, and clarification.
Primary Interviews and Surveys
Primary work was used to pressure-test inputs that are not fully visible in public data, especially pricing bands, workflow mix, and what share of lab spend is truly tied to single-cell DNA sequencing runs. We spoke with a mix of platform users, lab managers, and commercial leaders across major regions so adoption pace, budget cycles, and application mix could be validated before finalizing assumptions.
Distribution of primary research fieldwork respondents
| Company type | Respondent position | Region |
|---|---|---|
| Top tier: 32% | CXOs: 14% | APAC: 44% |
| Mid tier: 52% | Functional/Unit leaders: 41% | EMEA: 30% |
| Smaller Players: 16% | Managers: 45% | Americas: 26% |
Market-Sizing & Forecasting
Sizing starts with a top-down build where the demand pool is reconstructed from the installed base of relevant sequencing instruments, typical single-cell project throughput, and the share of runs that are single-cell DNA instead of other assays. Those totals are then translated into revenue using observed price ranges for key consumables, sample prep steps, and purchased analysis services, and they are split across regions using adoption signals and research funding intensity.
To keep the result realistic, we corroborate the totals with selective bottom-up checks, such as sampled lab spend patterns, channel feedback on reagent pull-through per instrument, and reasonableness checks against the number of active single-cell DNA programs seen in publications and trials. Inputs that matter in this market include single-cell isolation method usage, whole-genome amplification kit consumption rates, average library prep cost per sample, sequencing depth norms by application, and the outsourcing share for complex interpretation. For forecasting, scenario analysis is used and then aligned to expert expectations for variables like sequencing cost trajectory, growth in oncology and immunology programs, and the pace of long-read adoption for hard-to-resolve genomic regions. Where primary inputs are missing for a smaller country or niche workflow, proxies from similar markets are applied and then totals are rebalanced to match validated regional signals.
Data Validation & Update Cycle
Model outputs are cross-checked against independent signals, and outliers are reviewed until the drivers are explained through simple inputs such as volume, price, or workflow share. We run variance checks by region and by product bucket so unusual jumps get flagged, and then assumptions are revisited through follow-up outreach when the pattern cannot be justified.
Before sign-off, the work goes through multi-step analyst review so calculations, conversions, and growth drivers stay consistent across sections. Reports are refreshed annually, and interim updates are made when material events occur, such as major product launches, regulatory changes affecting genomic testing, or clear pricing shifts. Right before delivery, a final pass is done on the latest public releases and expert notes so clients receive the most current view.
Mordor Intelligence's Single Cell Genome Sequencing Market Size Compared Against Other Published Estimates
Published market numbers for single-cell genome sequencing often vary because different authors draw the scope line in different places across the workflow, and because the same lab activity can be counted under instruments, consumables, software, or services depending on the model. Differences also show up when the base year is not aligned, when currency conversion timing differs, or when price decline assumptions are pushed ahead of what labs report in purchasing cycles.
Standalone bioinformatics subscriptions that support broader genomics pipelines are frequently included in some published totals, and that market item sits outside Mordor Intelligence's scope when it is not sold as part of a single-cell DNA sequencing workflow. Other gaps come from mixing in single-cell transcriptomics or wider single-cell analysis spending, or from projecting aggressive uptake without checking instrument placement pace and consumables pull-through.
Benchmark comparison
| Source | Market Size | Gaps in Research Methodology |
|---|---|---|
| Mordor Intelligence | USD 4.39 B (2026) | |
| Trade Journal B | USD 4.31 B (2024) | Uses an earlier base year and may aggregate broader single-cell genomics activity, which can blend adjacent assays into one headline value and shift the total away from single-cell DNA-only spend. |
| Regional Consultancy A | USD 0.95 B (2025) | Likely narrows counted revenue to a smaller subset of sequencing-related sales, which can undercount multi-step workflows where consumables, prep kits, and interpretation services represent a large share. |
The spread across sources is mainly explained by what is counted around the single-cell DNA workflow, and how base-year pricing and run volumes are set before forecasting. When totals are tied back to repeatable signals such as instrument activity, project throughput, and per-sample cost structure, the market value becomes easier to reconcile and update as conditions change.


Key Questions Answered in the Report
How large is the single cell genome sequencing market in 2026?
The single cell genome sequencing market size stands at USD 4.39 billion in 2026.
What is the expected CAGR for single-cell sequencing through 2031?
The market is forecast to post a 14.94% CAGR between 2026 and 2031.
Which application is growing fastest?
Immunology and infectious disease applications are projected to grow at an 18.05% CAGR through 2031.
Why are long-read platforms gaining share?
Long reads resolve structural variants and phased haplotypes at single-cell resolution, driving an 17.88% CAGR for long-read technology.
What factor limits adoption in emerging markets?
High per-sample costs of USD 500 to USD 2,000 and capital equipment prices above USD 1 million constrain uptake in price-sensitive regions.
Which region will expand quickest?
Asia-Pacific is set to grow at a 16.72% CAGR thanks to precision-medicine investments in China and Japan.
Page last updated on:


 Your data is secure and never sold or shared.


