
Market Overview
| Study Period | 2019 - 2031 |
|---|---|
| Forecast Data Period | 2026 - 2031 |
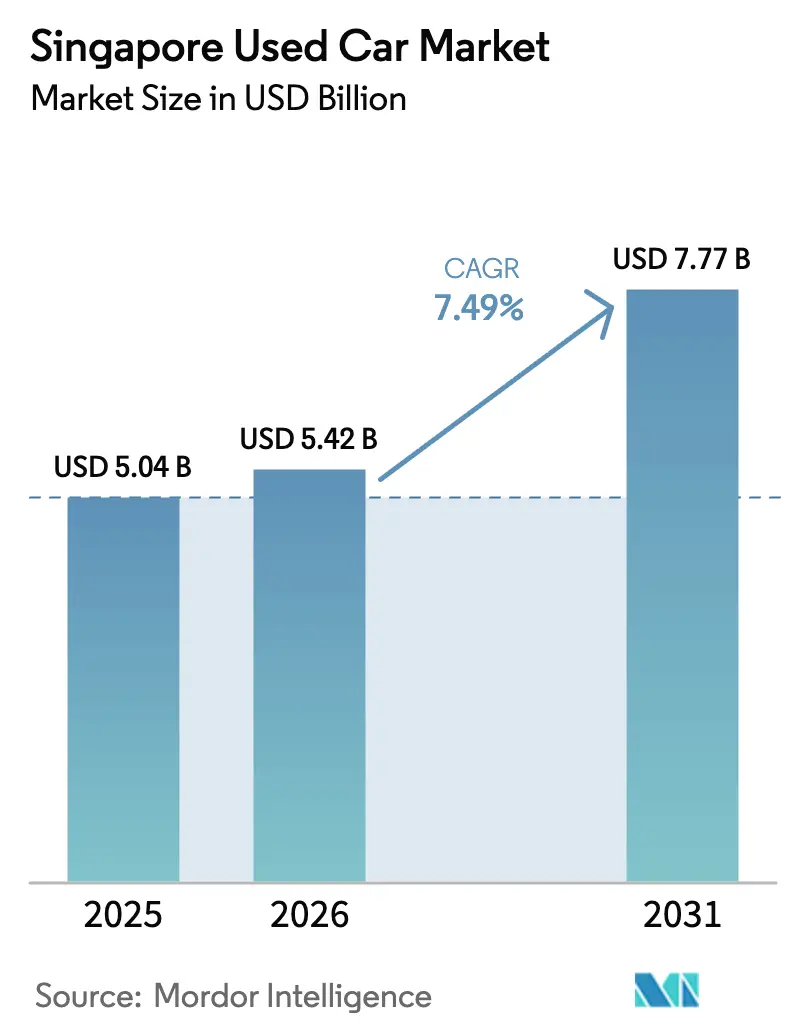
| Base Year Market Size (2025) | USD 5.04 Billion |
| Market Size (2026) | USD 5.42 Billion |
| Market Size (2031) | USD 7.77 Billion |
| Growth Rate (2026 - 2031) | 7.49 % |
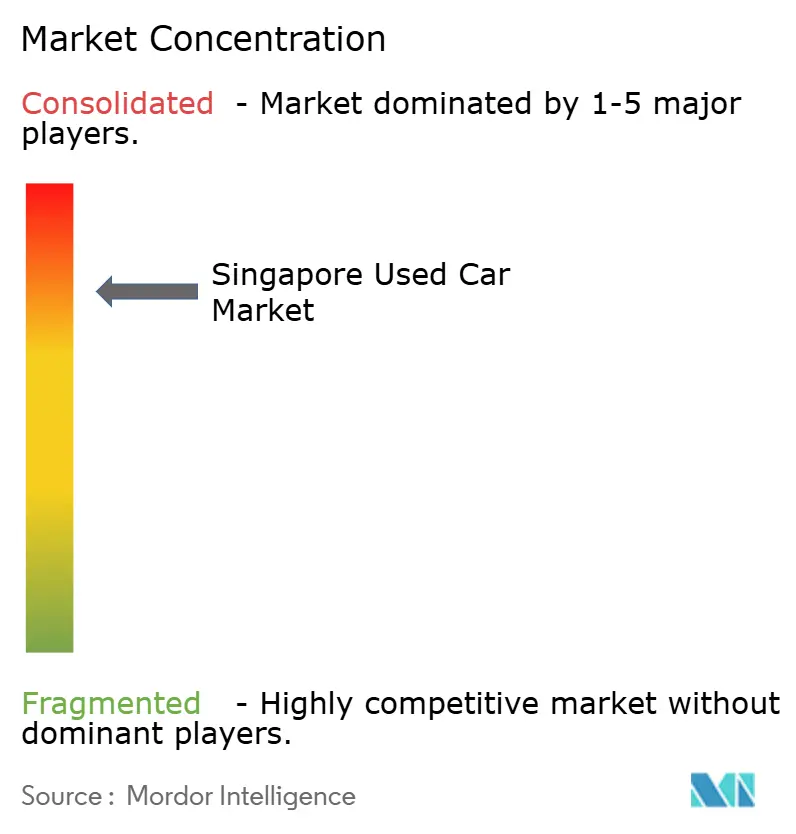
| Market Concentration | High |
Major Players *Disclaimer: Major Players sorted in no particular order Image © Mordor Intelligence. Reuse requires attribution under CC BY 4.0. | |
Singapore Used Car Market Analysis by Mordor Intelligence
The Singapore used car market size is expected to grow from USD 5.04 billion in 2025 to USD 5.42 billion in 2026 and is forecast to reach USD 7.77 billion by 2031 at a 7.49% CAGR over 2026–2031. Rising Certificate of Entitlement (COE) premiums continue to divert middle-income households toward pre-owned vehicles. The rapid growth of online-to-offline (O2O) platforms, expansion of OEM-backed certified pre-owned (CPO) schemes, and favorable electric-vehicle (EV) incentives are reinforcing demand for a secondary inventory that typically depreciates 40%–60% within the first five years. Organized dealers are deepening their share by pairing AI-driven price engines with 160-plus-point inspections that compress information asymmetry between buyers and sellers. These structural forces underpin the steady momentum of the Singapore used car market, where intensified competition for battery-electric-vehicle (BEV) inventory and high depreciation curves remain the two primary uncertainties for investors and market participants.
Key Report Takeaways
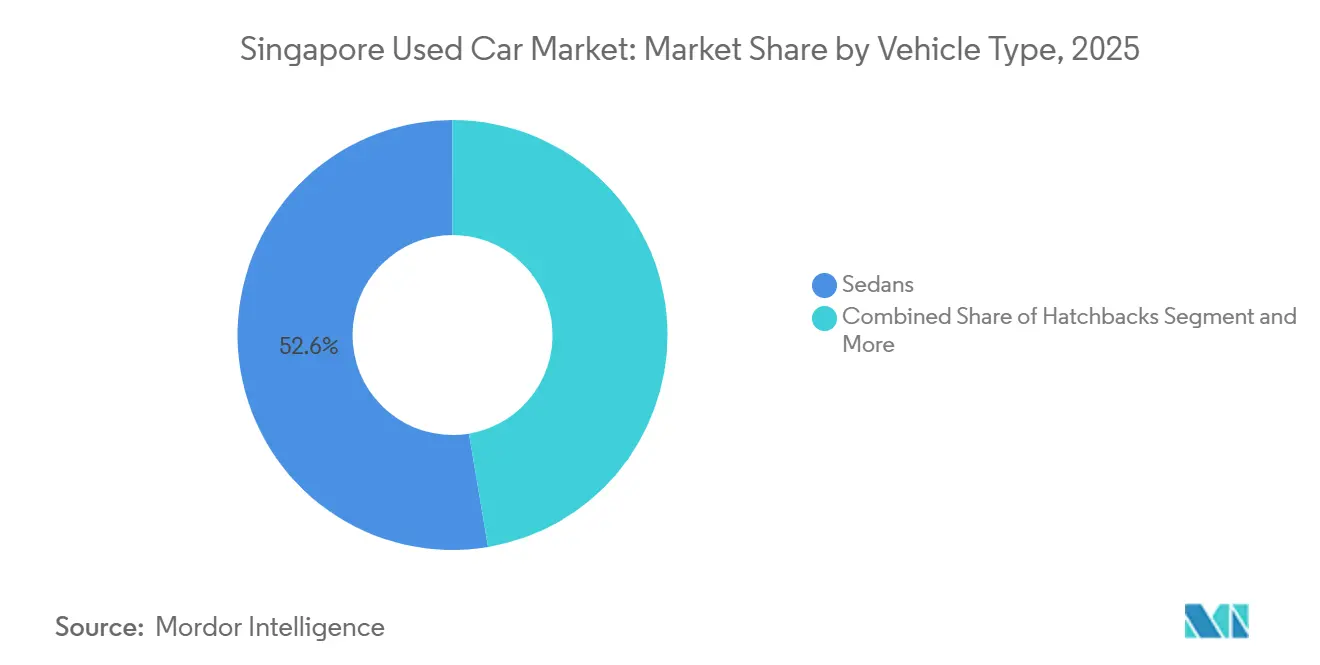
- By vehicle type, sedans led with 52.64% revenue share in 2025, while SUVs and MPVs are projected to expand at a 7.81% CAGR through 2031.
- By vendor type, organized dealers held 63.78% of Singapore's used car market share in 2025, and the segment is forecasted to grow at a 6.51% CAGR to 2031.
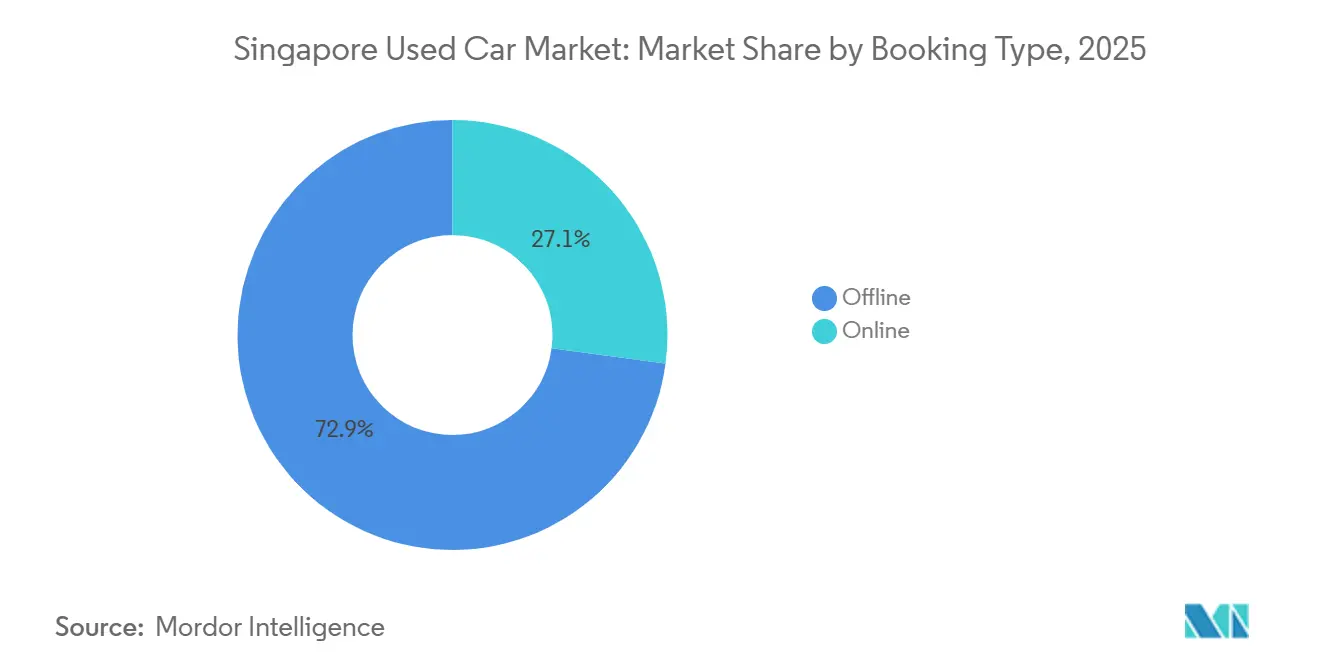
- By booking type, offline channels accounted for 72.89% of the Singapore used car market size in 2025; online booking is advancing at a 10.22% CAGR during the same period.
- By fuel type, gasoline vehicles commanded a 58.72% share of the Singapore used car market in 2025, whereas battery electric vehicles (BEVs) are expected to grow at a 12.42% CAGR through 2031.
Note: Market size and forecast figures in this report are generated using Mordor Intelligence’s proprietary estimation framework, updated with the latest available data and insights as of January 2026.
Singapore Used Car Market Trends and Insights
Drivers Impact Analysis*
| Driver | (~)% Impact on CAGR Forecast | Geographic Relevance | Impact Timeline |
|---|---|---|---|
| AI-Based Credit-Scoring | +1.8% | Central Region, North-East Region | Medium term (2-4 years) |
| Online-to-Offline (O2O) Marketplaces | +1.5% | Central Region, East Region, West Region | Short term (≤ 2 years) |
| OEM-backed CPO Programs | +1.2% | Central Region, North Region | Medium term (2-4 years) |
| EV Incentives | +1.0% | Central Region, East Region | Short term (≤ 2 years) |
| Escalating Cost of New-Car Ownership | +0.9% | Central Region, West Region, North Region | Long term (≥ 4 years) |
| High Depreciation Rates | +0.8% | Central Region, East Region | Medium term (2-4 years) |
| Source: Mordor Intelligence | |||
AI-Based Credit-Scoring Unlocks Sub-Prime Demand
Traditional banks declined roughly 30% of used-car loan applications due to thin files or irregular income. Still, AI-driven underwriting parses alternative data—such as utility payments, rental history, and mobile top-ups—to issue risk scores in minutes. SgCarMart’s Smart Loan supports a fully digital process, including application via MyInfo and quick approval.[1] United Overseas Bank mirrored this strategy with digital auto loans, which grew by around 40% year-over-year. Uptake is especially strong in the North-East Region, where younger households earning below SGD 8,000 monthly finance seven-year-old Japanese sedans for SGD 60,000–80,000. Wider risk modeling is broadening the eligible borrower pool and reinforcing liquidity for the Singapore used car market.
Rapid Expansion of Online-to-Offline Marketplaces
SgCarMart’s monthly listings cement a liquidity moat that obliges even individual sellers to pay commissions for visibility. Carsome markets a 175-point inspection; Carro’s 160-point inspection references proprietary technology, including computer visioning to detect sub-millimeter paint thickness variations, reducing disputes by approximately 35% and converting premium shoppers who fear latent accident damage. Central and East residents, dominated by tech-savvy professionals, make up 60% of digital bookings, while buyers in the West and North cling to offline negotiations. Aggregators that bundle ancillary services—road-tax renewal, insurance comparison, loan brokerage—are driving engagement and extending monetization beyond basic listings.
Rise of OEM-Backed Certified Pre-Owned Programs
BMW Premium Selection includes a 24-month warranty and a 360° vehicle check, including a battery inspection (for used BMW electric cars). Cycle & Carriage and Wearnes Automotive replicate the blueprint for Mercedes-Benz, Jaguar, Land Rover, and Volvo stock, enticing conquest customers with complimentary servicing. Performance Motors’ buy-back guarantee at 70% of the purchase price after three years effectively converts ownership into a lease-like product. These programs resonate most in the Central Region, which accounts for over 50% of CPO transactions owing to higher disposable income and preference for warranty assurance.
EV Early-Adopter Incentives Spurring ICE Trade-ins
The EV Early Adoption Incentive (EEAI) funds up to USD 15,000 rebates for purchasing BEVs, accelerating sedan disposals[2]. Tesla Model 3 and BYD Atto 3 buyers traded an average of 1.3 ICE cars per deal in 2024, consolidating from two vehicles to one BEV plus public transit. The Vehicle Emissions Scheme surcharges of up to USD 20,000 on high-pollution models have depressed older petrol SUVs, prompting owners to exit early. Trade-in volumes on Carro’s platform surged significantly quarter-on-quarter, and 6- to 8-year-old sedans valued at SGD 50,000–70,000 dominated submissions. Central and East landed-home zones, which enjoy ample private charging, continue to lead the migration toward BEVs.
Restraints Impact Analysis*
| Restraint | (~)% Impact on CAGR Forecast | Geographic Relevance | Impact Timeline |
|---|---|---|---|
| MRT Network Extensions | -0.6% | Central Region, North-East Region, East Region | Long term (≥ 4 years) |
| Car-Subscription Services | -0.4% | Central Region, West Region | Medium term (2-4 years) |
| Import and Emission Regulations | -0.3% | Central Region, North Region | Short term (≤ 2 years) |
| Tight Domestic Supply of Popular Models | -0.2% | Central Region, East Region, West Region | Short term (≤ 2 years) |
| Source: Mordor Intelligence | |||
MRT Network Extensions Curtailing Demand
Thomson-East Coast Line Stage 4 (TEL4) opened in June 2024, adding seven stations from Tanjong Rhu to Bayshore and shortened commutes for riders, coinciding with a significant drop in private-car registrations inside 500-meter catchments. The public-transport modal share reached over 60% of peak trips, and ongoing Cross Island Line construction will further deepen this shift. Households in North-East towns show comparatively lower car ownership than the national mean. Subscription services appeal to this demographic but also cannibalize used-car purchases that typically enter the secondary pool after seven years. As the MRT network densifies, incremental demand for pre-owned vehicles will moderate.
Rise of On-Demand Mobility & Car-Subscription Services
Grab processes more than 5 million daily trips, diminishing the utility of ownership for households making fewer than 10 weekly journeys. Carro’s monthly subscription, bundling insurance and maintenance, had a huge number of subscribers by mid-2024. Carousell’s tie-up with Carzuno offers three- to twelve-month packages, targeting expatriates wary of COE volatility. Fleet operators redirect ex-rental units into subscription pools instead of selling them at the five-year mark, tightening the supply of sedans priced under SGD 60,000. These dynamics erode first-time-buyer pipelines, crucial to the Singapore used car market.
*Our forecasts treat driver/restraint impacts as directional, not additive. The impact forecasts reflect baseline growth, mix effects, and variable interactions.
Segment Analysis
By Vehicle Type: Sedans Anchor Volumes, SUVs Accelerate Upside
Sedans captured 52.64% of the market size in 2025, solidifying their position as the largest slice of the Singapore used car market. Compact footprints ease navigation through multi-story carparks and Electronic Road Pricing gantries, aligning with dense urban infrastructure. Toyota Corolla Altis and Honda Civic models account for the majority of sedan listings and have slid off 2023 values as early BEV adopters liquidate ICE inventory under ETS incentives. Hatchbacks serve urban singles seeking fuel economy and lower road-tax bands. SUVs and MPVs are on a 7.81% CAGR trajectory as family-formation demographics prioritize third-row seating and perceived safety.
Computer-vision inspection, pioneered by Carro, has significantly reduced SUV post-sale disputes, alleviating buyer concerns about off-road abuse and water damage. Vehicle Emissions Scheme surcharges penalize large SUVs with USD 20,000 levies, yet the constraint suppresses new-car deliveries, indirectly lifting residual values in the Singapore used car market. Hatchbacks and sedans attract minimal VES penalties but face higher resale velocity pressure because of abundant supply. The Central Region’s condominium dwellers display balanced demand, while North and West buyers lean toward sedans as budget priorities and older HDB carparks favor smaller dimensions.

By Vendor Type: Organised Dealers Consolidate Trust Premium
Organized dealers and platforms commanded 63.78% share of the Singapore used car market in 2025, expanding at a 6.51% CAGR. SgCarMart’s lattice of 80,000 listings delivers network effects that funnel even private sellers into its pay-to-list model, ensuring supply density and price discovery. Carro integrates inspection, financing, and warranties to slash transaction cycles by up to 25% and monetize ancillary services. Carsome uses 175-point computer-vision protocols to justify price premiums over unverified rivals.
Unorganized sellers retain a 36.22% share by discounting up to 8% but suffer significantly longer days-to-sale. Higher-income Central and East buyers prefer warranties and post-sale support, driving an organized-dealer bias. Motorist.sg’s insurance comparison, loan brokerage, and road-tax renewal bundle underscores the movement toward ecosystem experiences. OEM CPO programs occupy a subtle portion of organized-dealer throughput and are scaling at a robust CAGR among expatriates and high-net-worth individuals who equate brand warranties with lower residual-value risk.
By Booking Type: Digital Pathways Rapidly Scale Adoption
Offline showrooms still account for 72.89% of the Singapore used car market size in 2025 because vehicle purchases are high-involvement decisions that require physical inspections. Yet online bookings are climbing at 10.22% CAGR. SgCarMart’s Smart Loan populates income and credit data via MyInfo to cut approval times to under one hour. Carro’s augmented-reality previews and AI chatbots answer 80% of queries, resulting in a significant reduction in customer acquisition costs. Carsome’s sealed-bid auctions achieve over 90% sell-through within 24 hours.
Showroom footfall in the Ubi and Leng Kee clusters fell 15% between 2022 and 2024, prompting dealers to invest in indoor lounges and café amenities to raise conversion rates. Hybrid models that blend online reservations with a compulsory in-person inspection capture 35% of Carro volume, indicating that pure digital remains aspirational. LTA’s OneMotoring portal reduced transfer paperwork from five days to two hours, incrementally lowering friction for fully online workflows.
By Fuel Type: Gasoline Still Reigns, EVs Catch Up Fast
Gasoline units retained a 58.72% share in 2025, reflecting an abundant supply of five- to seven-year-old Japanese sedans that appeal to value-oriented commuters. Nonetheless, battery electric vehicles log a 12.42% CAGR as government policy tilts decisively toward full electrification by 2031. EV subsidies lower the effective purchase price of three-year-old Teslas and BYD crossovers enough to mitigate concerns about price elasticity. Hybrid-electric vehicles bridge the transition for households lacking home chargers, especially in older HDB blocks awaiting charger retrofits.
Diesel’s short-dated future—new registrations ceased in January 2025—creates a shrinking addressable stock, reinforcing two-tier pricing where young diesel vans command premiums among small business owners, but older cars face steep discounts. The Singapore used car market size attached to gasoline vehicles will contract moderately as its market share slips below 50% post-2028. Dealers pre-position by taking franchise rights for EV maintenance brands to secure service-bay throughput even as fuel mixes shift.
Geography Analysis
Singapore’s total land area is approximately 735.7 km² (as of December 2024), compressing the trading ecosystem into a single economic node. HDB-heavy estates like Toa Payoh account for dense buyer clusters seeking compact sedans, whereas landed-property belts in Tanglin and Bukit Timah lean toward premium SUVs, reflecting higher disposable income. Micro-market segmentation hinges on MRT connectivity; completion of the Thomson-East Coast Line reduced travel times from Woodlands to Marina Bay by 50%, dampening incremental purchases for work commutes. Families with young children still value door-to-door convenience, sustaining baseline demand in mature neighborhoods.
Cross-border trade with Malaysia and Indonesia is limited but meaningful for high-net-worth clients who export ex-Singapore EVs under dealer-facilitated schemes. The regulatory prohibition on personal import of cars older than three years prevents arbitrage from low-cost neighboring markets, preserving price stability within the Singapore used car market. Dealers leverage the island’s modern road network—west-to-east travel is under 45 minutes—to promise same-day test drives, a logistical advantage over geographically dispersed neighbors.
The government’s car-lite vision keeps annual vehicle population growth near zero, yet secondary turnover remains healthy because enforced COE expiries deliver predictable scrappage pulses. That certainty supports a highly organized remarketing chain, with auction houses in Kaki Bukit able to process Trade-In-To-Auction cycles within 72 hours. High broadband penetration enables island-wide digital bidding, lowering time-on-lot metrics and boosting capital deployment efficiency across the Singapore used car market.
Regulatory Landscape
The regulatory framework for used cars in Singapore is anchored by the Land Transport Authority (LTA) through the Vehicle Quota System (VQS) and the Certificate of Entitlement (COE), which caps the vehicle population and ties ownership to a 10-year entitlement that transfers with the vehicle. Import rules administered via LTA OneMotoring constrain arbitrage supply, including the requirement that used cars be no more than three years old at registration, with a surcharge applied for imported used cars. This helps keep most secondary-market supply domestically cycled from new registrations.
Emissions and tax rules shape the tradable parc and residual values. New registrations of diesel and diesel-natural gas cars and taxis ceased from 1 January 2025, tightening the long-term pipeline of diesel passenger cars while leaving an aging stock to remarket. On the transaction side, the Inland Revenue Authority of Singapore (IRAS) governs GST treatment for motor vehicle traders through schemes such as the GST Gross Margin Scheme and Discounted Sale Price Scheme, influencing dealer pricing, margin management, and documentation practices across organized used-car retailers and platforms.
Value Chain Analysis
Singapore's used-car value chain starts with supply creation from trade-ins, fleet and lease returns, and COE-related scrappage and re-registration decisions. It then moves through dealer sourcing and remarketing via classifieds and O2O platforms such as SgCarMart, supported by auction channels that help dealers rebalance inventory quickly. LTA's digital transfer workflow (via OneMotoring) reduces administrative friction and supports higher transaction velocity, reinforcing an environment where organized dealers and platforms can cycle inventory faster than small lots.
Value addition concentrates in inspection, refurbishment, certification, and bundled services that reduce information asymmetry and convert leads into financed purchases. Organized players operationalize multi-point inspections, including the 160-plus-point and 175-point protocols referenced by leading platforms in this report, and attach warranties. Finance providers and bank or platform-linked underwriting products determine affordability and approval rates for used-car buyers, while tax and compliance functions (including IRAS GST scheme selection and documentation) run alongside insurance, road-tax renewal, and aftersales service partners. The result is a bundled, end-to-end retail model that monetizes beyond headline vehicle margins.
Competitive Landscape
The Singapore used car market is oligopolistic. SgCarMart aggregates a significant portion of classifieds, generating liquidity that compels even unorganized sellers to list and pay commissions. Carro differentiates through vertical integration and a substantial revolving credit line that funds inventory and subprime loans while maintaining low non-performing-loan ratios. Carsome, DirectCars, and Motorist.sg compete for remaining mindshare, often by enhancing inspections or bundling ancillary services.
Technology innovation is the primary battleground. Carro’s computer-vision system reviews numerous structural data points per vehicle and has significantly reduced post-sale disputes. Carsome’s detailed inspection protocol employs advanced tools to reveal prior accidents, enabling price premiums for ready-to-drive units. OEM CPO programs from premium brands attach warranties and telematics-powered maintenance alerts, capturing affluent expatriates willing to pay a premium over equivalent unverified units.
Sub-prime financing and car-subscription services represent the two whitespace arenas. Only SgCarMart and Carro have fully deployed AI credit models that significantly raise approval rates, leaving a portion of applicants underserved. Carro’s all-inclusive subscription, priced competitively, has attracted a growing number of users, particularly millennials, from outright purchases. As electric vehicle lease returns flood the secondary market in the coming years, leaders will be tested on their ability to certify battery health and price depreciation accurately.
Singapore Used Car Industry Leaders
-
Carro
-
Sgcarmart
-
Carsome Sdn. Bhd.
-
Otopac Motors Pte. Ltd.
-
DirectCars
- *Disclaimer: Major Players sorted in no particular order
Market Opportunities and Future Outlook
The COE-linked 10-year ownership cycle creates visible, time-bound inventory pulses that dealers and platforms can operationalize, supported by evidence pointing to a 2026 deregistration surge based on registrations from a decade earlier. This dynamic creates opportunities in faster remarketing pathways such as auction-to-retail and trade-in-to-auction, and in pricing and financing products that help absorb higher volumes without widening days-to-sale. At the same time, COE levels keep affordability pressure elevated for new-car buyers, reinforcing demand for used alternatives and shorter commitment models such as subscriptions. June 2026 COE prices were reported at S$126,009 for Category A and S$126,989 for Category B, keeping consumer attention on used options.
Electrification and compliance-driven shifts continue to create whitespace in certification and aftersales capabilities, not just in listings volume. The report context highlights EV incentives and rising BEV participation in used-car demand, while market participants still face practical gaps around battery health assurance, inspection standardization for EVs, and warranty packaging that can be understood by mainstream buyers. Longer retention and COE renewals also increase the role of periodic inspection capacity and related services, with VICOM-linked inspection-led businesses referenced in recent market commentary. This supports opportunities in inspection throughput, refurbishment for older ICE vehicles exiting early under emissions-linked cost pressure, and integrated financing that broadens eligibility for buyers with thin credit files.
Recent Industry Developments
- June 2026: CARSOME reported a 25% increase in gross profit and expanded gross profit per unit to the highest level since founding in Q1 2026. The result supports profitability within Singapore's used-car financing ecosystem. This improvement could enable more aggressive pricing and enhanced financing terms across the market.
- April 2026: CARSOME formalised a strategic auto financing partnership in Singapore involving CARSOME, CarTimes, and JACCS Co., Ltd. The partnership expands integrated auto-financing channels in Singapore. It deepens inventory liquidity and financing options across the ecosystem.
- February 2026: Carro launched two exclusive showrooms for Dongfeng Motor Corporation in Sin Ming, Singapore, as an authorised dealer. The expansion broadens OEM-backed channels into the Singapore market. It strengthens used-car supply links through potential certified programs and an expanded dealer network.
Research Methodology Framework and Report Scope
Market Definition and Coverage
We define the Singapore used car market as the value created when previously registered passenger vehicles are resold within Singapore through dealers, platforms, or direct seller to buyer transfers, based on observed transaction prices and units transferred.
Scope exclusions: Excludes brand-new vehicle sales, motorcycles, and commercial vehicle resale where the transaction is primarily for fleet or industrial use.
Segmentation Overview
- By Vehicle Type
- Hatchbacks
- Sedans
- Sports Utility Vehicles (SUVs) and Multi-purpose Vehicles (MPVs)
- By Vendor Type
- Organized Dealers and Platforms
- Unorganized (Individual/Small Lots)
- By Booking Type
- Online
- Offline
- By Fuel Type
- Gasoline
- Diesel
- Hybrid Electric Vehicles (HEV)
- Plug-in Hybrid Electric Vehicles (PHEV)
- Battery Electric Vehicles (BEV)
- Other Fuel Types
Data Sources, Market Sizing, and Validation
Desk Research
Desk work starts with building a clean fact base on how many vehicles exist and how frequently ownership changes. We used public Singapore datasets and rulebooks that shape demand and pricing, including Land Transport Authority statistics and registration releases, Singapore Customs trade statistics for vehicle imports, and Singapore Department of Statistics macro indicators (income, inflation, and household spending).
To keep assumptions realistic, we reviewed public documents such as Monetary Authority of Singapore releases on consumer credit trends and Infocomm Media Development Authority updates that help explain digital buying behavior. We also checked relevant government policy notes on EV incentives and vehicle emissions rules. These signals were then combined with company annual reports, investor presentations, and reputable press coverage to understand channel shifts toward platforms and certified programs. We also used paid subscriptions for company financials and news screening, plus a vehicle sales and parc dataset for cross-checking stock and turnover indicators. The desk sources listed here are not exhaustive, and many other references were used for data collection, validation, and clarification during the study.
Primary Interviews and Surveys
Primary work was used to test the desk assumptions against what actually happens in pricing, supply flow, and buyer behavior in Singapore. We spoke with used car dealers, online marketplace operators, vehicle financing and insurance intermediaries, and service partners involved in inspection and refurbishment. This helped us narrow typical spreads between asking and transacted prices, and the share of sales that move online versus offline. Since this is a Singapore-only market, respondent coverage focused on different business sizes and roles to capture both strategic views and day-to-day transaction realities.
Distribution of primary research fieldwork respondents
| Company type | Respondent position |
|---|---|
| Top tier: 27% | CXOs: 13% |
| Mid tier: 57% | Functional/Unit leaders: 42% |
| Smaller Players: 16% | Managers: 45% |
Market-Sizing & Forecasting
The core model uses a top-down demand pool build that reconstructs used car transaction value from vehicle transfers and average realized prices, then it is checked with selective bottom-up approximations using dealer throughput and sampled price x volume by common body types. Where reporting is incomplete, gaps are handled through ratio-based lifts tied to observable signals (like transfer counts and listing activity), and the outputs are adjusted after expert checks.
Key inputs that guided sizing included used vehicle transfer volumes, the active passenger car parc, COE premium levels and remaining tenure behavior, shifts in financing penetration, and the share of sales flowing through organized dealers and online booking. We also tracked fuel mix change, including the early rise of used EV inventory, since it affects price bands and days-to-sell patterns. Forecasting relied mainly on scenario analysis, where macro affordability, COE cycles, and supply availability were stress tested with primary feedback. The final forecast path was chosen based on the most repeated operating assumptions from respondents.
Data Validation & Update Cycle
Outputs were triangulated across at least three angles, including transfer volumes, price benchmarks, and channel mix signals, so a weak data point did not drive the result. Analysts reviewed year-on-year swings, checked for breaks caused by policy shifts (COE and EV measures), and re-opened assumptions when the model produced unrealistic jumps in average selling prices or unit turnover.
Before sign-off, a second analyst reviewed the steps, inputs, and calculations, followed by a final consistency check against independent public indicators. The report is refreshed annually, and interim updates are triggered when material events occur, such as major rule changes or sharp COE movements. Right before delivery, we run a fresh pass so clients receive the latest updated view.
Mordor Intelligence's Singapore Used Car Market Size Measured Against Other Published Estimates
Different sources can land on different market values because they do not always count the same transaction types. Some also mix gross transaction value with dealer revenue, or they apply different currency timing and price assumptions.
By checking LTA-driven transfer volumes and refreshed transacted price bands, Mordor Intelligence keeps the value estimate tied to actual ownership change activity, and it excludes adjacent costs like financing charges, insurance premiums, and post-sale repairs that can inflate transaction-value calculations.
Benchmark comparison
| Source | Market Size | Gaps in Research Methodology |
|---|---|---|
| Mordor Intelligence | USD 5.04 B (2025) | |
| Industry Publisher A | USD 5.00 B (2024) | Presented as an approximate value without a clearly pinned year, and it is described as average price x estimated sales volume, which can drift if official transfer activity is not used to reconcile units. |
| Press Release B | USD 5.10 B (2025) | Uses gross transaction value language and a higher growth narrative, but the release does not explain how COE premium swings and COE tenure effects were normalized when translating listings and quotes into realized prices. |
Across the sources, most of the variation comes from mixing dealer revenue with transfer value and from whether non-vehicle items get counted inside the market total. Our steps stay traceable because unit movement and pricing are anchored to observable signals, and then cross-checked through interviews so the final number can be replicated and updated with the same inputs.
Key Questions Answered in the Report
How large is the Singapore used car market in 2026?
The Singapore used car market size reached USD 5.42 billion in 2026.
What is the expected CAGR for the Singapore used car market to 2031?
The market is forecast to grow at a 7.49% CAGR, reaching USD 7.77 billion by 2031.
Which vehicle type controls the largest share of transactions?
Sedans dominate with 52.64% of 2025 transaction volume.
How fast are online bookings growing?
Online channels are advancing at a 10.22% CAGR, although offline still holds 72.89% share in 2025.