
Market Overview
| Study Period | 2020 - 2031 |
|---|---|
| Forecast Data Period | 2026 - 2031 |
| Base Year Market Size (2025) | USD 14.07 Billion |
| Market Size (2026) | USD 14.6 Billion |
| Market Size (2031) | USD 17.58 Billion |
| Growth Rate (2026 - 2031) | 3.78 % |
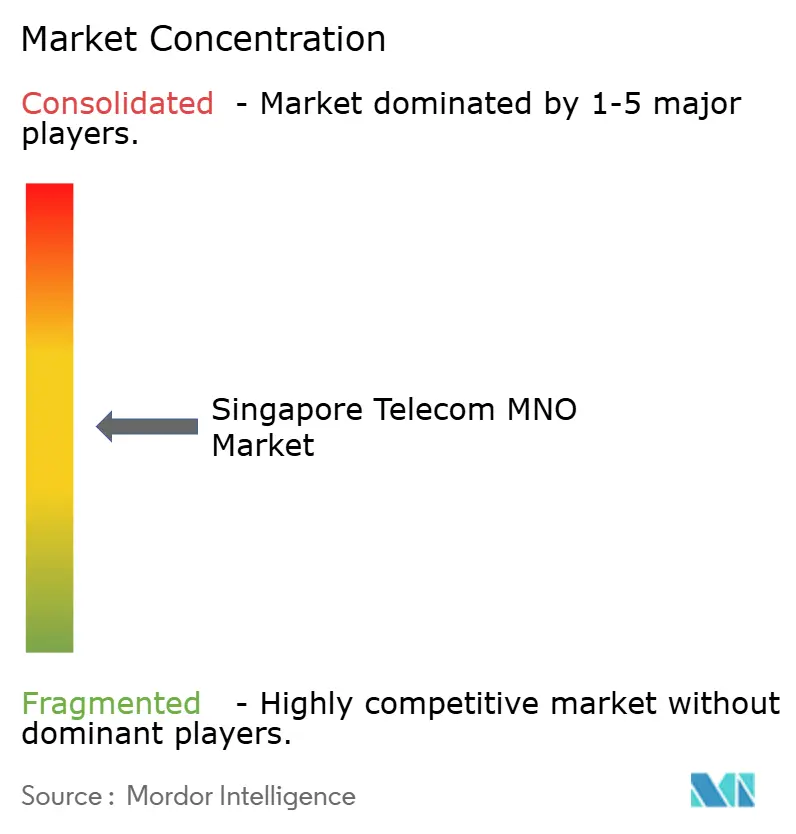
| Market Concentration | Medium |
Major Players *Disclaimer: Major Players sorted in no particular order Image © Mordor Intelligence. Reuse requires attribution under CC BY 4.0. | |
Singapore Telecom MNO Market Analysis by Mordor Intelligence
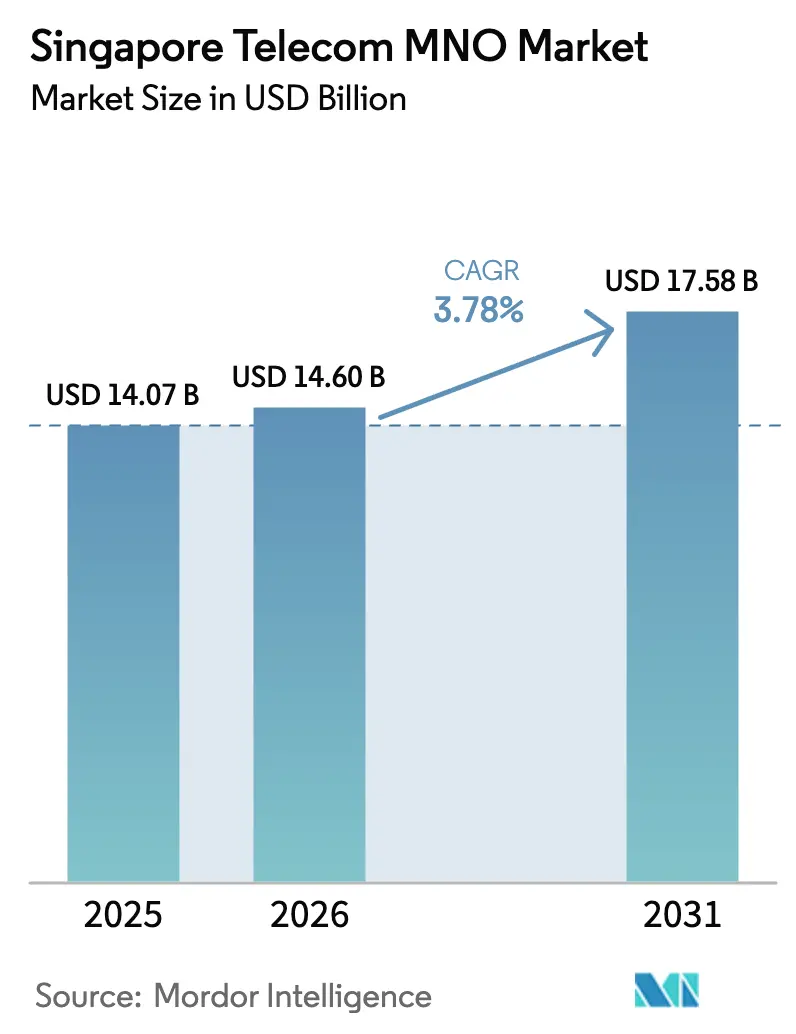
The Singapore Telecom MNO Market size is expected to grow from USD 14.07 billion in 2025 to USD 14.6 billion in 2026 and is forecast to reach USD 17.58 billion by 2031 at 3.78% CAGR over 2026-2031. In terms of subscriber volume, the market is expected to grow from 10.09 million units in 2025 to 11.69 million units by 2030, at a CAGR of less than 2.98% during the forecast period (2025-2030). This steady trajectory reflects resilient infrastructure investment, nationwide 5G standalone coverage, and aggressive cloud-first public initiatives that jointly lift enterprise demand while sustaining premium consumer upgrades. Household fiber penetration sits at 100%, enabling operators to bundle gigabit-class broadband with 5G mobile tiers, which in turn supports average monthly mobile data consumption above 50 GB. Intensifying digitalization across government and industry pushes demand for secure, high-capacity connectivity, and operators are responding with network-slicing products for mission-critical workloads and AI-enabled cybersecurity bundles. Competitive tension, sparked by the entry of Simba and more than ten MVNOs, has driven data prices to the lowest level in Southeast Asia, yet prudent capex cycles and new enterprise revenue streams help sustain margins. Maritime and port private-network pilots, plus aggressively funded cloud-edge rollouts, position the Singapore MNO telecom market as a regional showcase for industrial 5G use cases.
Key Report Takeaways
- By service type, data services led with 52.64% of Singapore MNO telecom market share in 2025; IoT services are forecast to expand at a 3.94% CAGR through 2031.
- By end user, the consumer segment captured a 66.88% share of the Singapore MNO telecom market size in 2025, whereas enterprise users are expected to advance at a 4.12% CAGR through 2031.
Note: Market size and forecast figures in this report are generated using Mordor Intelligence’s proprietary estimation framework, updated with the latest available data and insights as of 2026.
Singapore Telecom MNO Market Trends and Insights
Drivers Impact Analysis*
| Driver | (~) % Impact on CAGR Forecast | Geographic Relevance | Impact Timeline |
|---|---|---|---|
| Nationwide 5G standalone roll-out with network slicing | +1.2% | National | Medium term (2-4 years) |
| Digital-first public-sector initiatives and cloud migration | +0.8% | National | Short term (≤ 2 years) |
| Full fiber-to-the-home saturation enabling 10 Gbps upgrades | +0.6% | National | Short term (≤ 2 years) |
| Surging per-capita mobile data use (>50 GB monthly) | +0.7% | National | Medium term (2-4 years) |
| Maritime and port private-network pilots for industrial 5G | +0.3% | Tuas, Changi | Long term (≥ 4 years) |
| 5G network-slicing “priority lanes” for gaming and fintech users | +0.4% | National | Medium term (2-4 years) |
| Source: Mordor Intelligence | |||
Nationwide 5G standalone roll-out with network slicing
Singapore became the first country to blanket all populated areas with 5G standalone in 2025, giving operators the architectural freedom to allocate dedicated slices for latency-sensitive traffic. Singtel’s 700 MHz layer lifted indoor coverage by 40% while permitting ultra-low-bandwidth IoT slices that cost only a fraction of regular mobile plans, expanding addressable enterprise use cases. Network slicing also underpins premium consumer “5G +” bundles that guarantee bandwidth during peak hours, generating a 23% ARPU uplift among early adopters in 2025
Digital-first public-sector initiatives and cloud migration
More than 80% of eligible government systems ran on the commercial cloud by late-2024, a milestone that immediately multiplied secure connectivity demand from agencies and their vendors. The Shared Responsibility Framework launched in December 2024 further compels financial institutions to co-innovate with telecom operators on anti-phishing defenses, spawning new compliance-driven messaging and API-security revenues.
Full fiber-to-the-home saturation enabling 10 Gbps upgrades
Nationwide FTTH coverage allows rapid monetization of speed upgrades. The regulator earmarked SGD 100 million to push 10 Gbps residential service to 500,000 homes by 2028, letting operators craft symmetric upstream tiers coveted by content creators and cloud gamers. Bundled convergence packages now attach cybersecurity suites and unlimited mobile allowances, trimming churn by 18% year over year for leading ISPs in 2025
Surging per-capita mobile data use (>50 GB monthly)
Singaporeans spend 6 hours 33 minutes online daily and open Telegram 237 times per month, statistics that strain radio networks yet validate unlimited-data monetization strategies. Between 2017 and 2025, the effective price per GB collapsed from SGD 4 to below SGD 0.10, but larger data bundles and premium 5G tiers now offset headline ARPU erosion.
Restraints Impact Analysis*
| Restraint | (~) % Impact on CAGR Forecast | Geographic Relevance | Impact Timeline |
|---|---|---|---|
| Hyper-competition from MVNOs and Simba | -0.9% | National | Short term (≤ 2 years) |
| OTT substitution of voice/SMS and Pay-TV | -0.6% | National | Medium term (2-4 years) |
| High spectrum-renewal and energy costs | -0.4% | National | Medium term (2-4 years) |
| Limited domestic scale for capex-heavy 5G investments | -0.3% | National | Long term (≥ 4 years) |
| Source: Mordor Intelligence | |||
Hyper-competition from MVNOs and Simba
Simba’s SGD 10-for-50 GB plan re-anchored consumer price expectations and helped the fourth operator exceed 10% subscriber share by 2024. With more than ten MVNOs targeting micro-segments, churn has risen above 1.7% monthly, curbing the ability of any provider to push list prices upward despite rising radio-access energy costs.
OTT substitution of voice/SMS and Pay-TV
Voice revenue shrank 80% and SMS revenue 94% globally over the past decade as WhatsApp, Telegram, and streaming platforms displaced legacy services. In Singapore, pay-TV bases fell 40% at StarHub and 10% at Singtel between 2015 and 2024, making content partnerships and broadband bundling the only viable retention tools for legacy video.
*Our forecasts treat driver/restraint impacts as directional, not additive. The impact forecasts reflect baseline growth, mix effects, and variable interactions.
Segment Analysis
By Service Type: Data services dominate while IoT accelerates
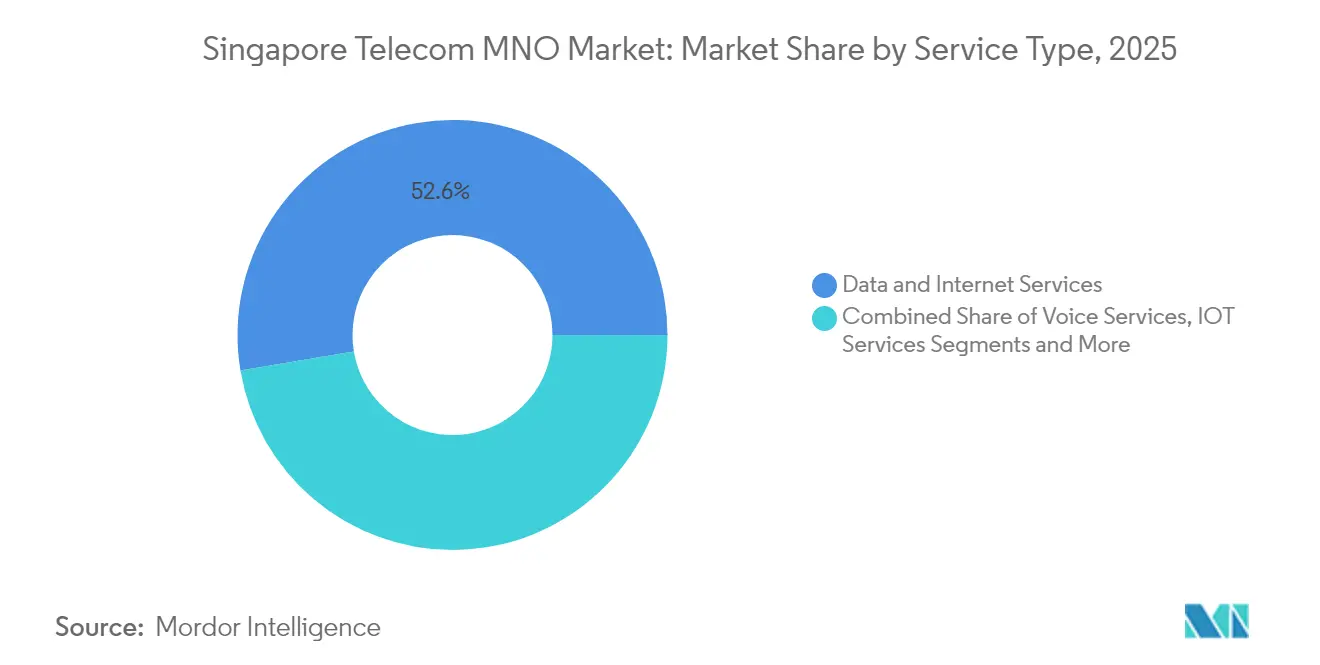
Data products commanded 52.64% of Singapore telecom MNO market share in 2025, reflecting ubiquitous mobile broadband adoption and 100% household fiber access. IoT and M2M posted the highest 3.94% CAGR, fueled by smart-factory pilots and city-wide sensor grids that demand ultrareliable low-latency connectivity. Voice held 19.74% yet lagged in growth as OTT erosion persisted. OTT and PayTV represented 10.08%, bolstered modestly by streaming bundles. Other value-added services including managed security and GPU-as-a-Service grew at 3.88% as operators diversified revenue. This breadth underscores how the Singapore MNO telecom market size increasingly tracks enterprise digital-transformation budgets rather than legacy consumer voice trends.
The competitive configuration encourages convergence. Operators package unlimited-data SIM-only plans with 2 Gbps home broadband and cloud storage at price points equal to 2019 single surfaces, driving multi-product take-rates above 65%. Industrial 5G use cases from automated guided vehicles at Tuas Port to AR-guided aircraft checks at Changi are projected to inject USD 340 million incremental service revenue by 2031, reinforcing the structural pivot toward high-margin platform services.

By End User: Enterprise momentum overtakes consumer saturation
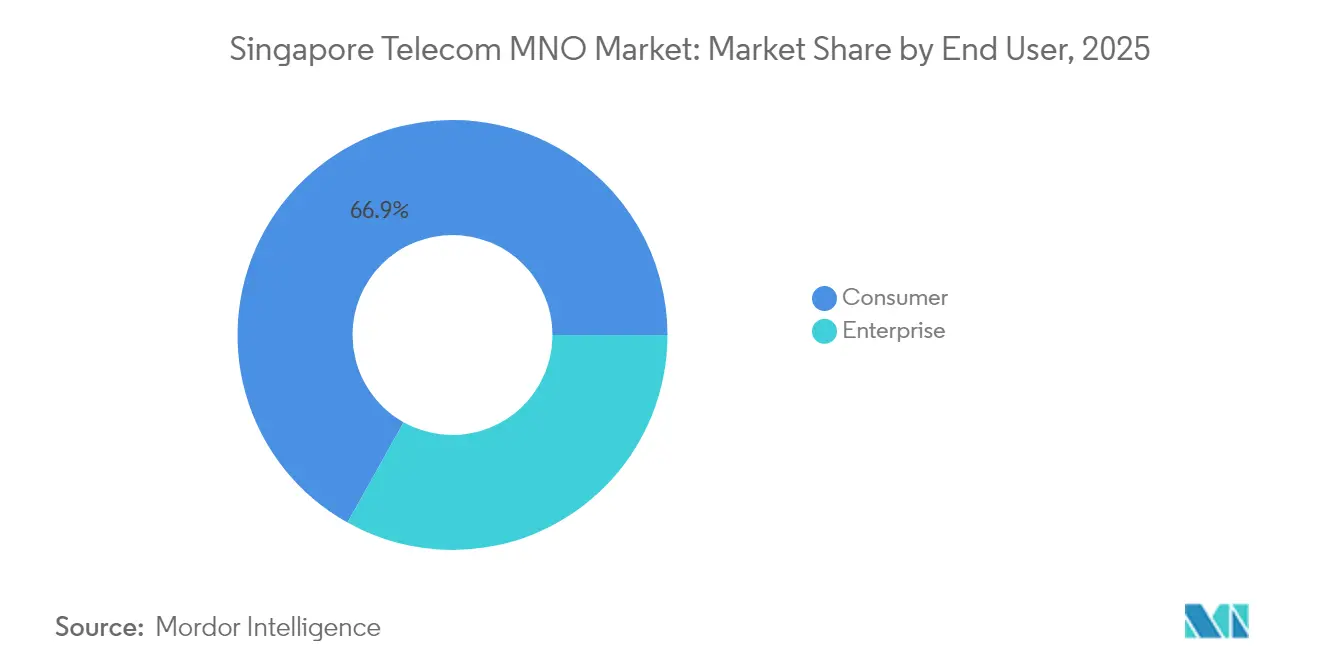
Enterprise clients produced 33.12% of 2025 value yet carry the fastest 4.12% CAGR through 2031. Government mandates for zero-trust architectures and sectoral digital roadmaps spur uptake of managed SD-WAN, SASE, and edge-compute nodes, providing sticky contract revenue with three-year renewals. M1’s enterprise segment expanded 50% YoY in 2024 on the back of maritime private networks and cloud contact-center solutions.
Conversely, consumer revenue growth slows to 3.58% as SIM-only price wars cannibalize traditional bundles. Still, the consumer base maintains a 66.88% share of the Singapore MNO telecom market size, thanks to record handset refresh cycles and rapid 5G adoption exceeding 75% of total subscriptions by mid-2025. Incremental growth derives from gaming-optimized data lanes and family cyber-wellness add-ons, signaling a shift from pure bandwidth sales to curated digital-lifestyle subscriptions.
Geography Analysis
Singapore’s compact 728 km² territory allows end-to-end fiber reach and city-wide 5G at population-density economics unreachable in larger markets. Central business and high-rise residential districts host premium 10 Gbps fiber rollouts and 5G mmWave nodes that cater to content creators and fintech traders requiring symmetric gigabit speeds. Western industrial corridors in Jurong and Tuas house the nation’s manufacturing and maritime clusters; here, private-network deployments deliver deterministic latency for autonomous cranes and digital twin simulations at Tuas Port, the world’s first fully automated mega-port. Eastern precincts around Changi Airport apply 5G network slicing to real-time aviation logistics, enhancing on-time performance while cutting turnaround times. Island-wide, over 30 submarine cables terminate in Singapore, elevating the city-state to a regional traffic hub and diversifying operator wholesale revenues.
Although total addressable population is only 5.9 million, the city’s role as a digital gateway to Southeast Asia supports disproportionate international bandwidth demand, translating into robust backhaul and data-center leasing for incumbent carriers. However, limited domestic scale also compels disciplined capex and co-build models; Singtel and StarHub now share 3,000 5G sites, trimming duplication and advancing sustainability targets by lowering energy draw per gigabyte.
Regulatory Landscape
Singapore telecom MNOs operate under the Telecommunications Act 1999 and the Info-communications Media Development Authority (IMDA) Act 2016, with IMDA acting as the converged regulator under the Ministry of Digital Development and Information. In April 2026, Parliament introduced the Info-communications Media Development Authority (Amendment) Bill (No. 9 of 2026) to update the IMDA Act and related frameworks, supporting fair and efficient market conduct and streamlining parts of the media regulatory burden. This is relevant as operators expand beyond connectivity into digital services.
Regulatory scrutiny on spectrum and market structure also remains a live factor for competition. In May 2026, IMDA suspended its review of SIMBA Telecom Pte. Ltd.'s proposed acquisition of M1 Ltd after an investigation into potential unauthorised use of radio frequency bands not assigned to SIMBA. The action underscores how compliance around radio-frequency usage can affect consolidation pathways and spectrum-related obligations in Singapore.
Competitive Landscape
Four facilities-based operators—Singtel, StarHub, M1, and Simba—compete head-to-head, while a growing roster of MVNOs exploits digital-only brands to slice micro-segments at minimal opex. Singtel holds roughly 44% of mobile subscriptions, leveraging regional content partnerships and early 5G leadership to defend premium ARPU. StarHub focuses on enterprise managed services, achieving 24.8% growth in regional ICT revenue in 2024 by bundling SASE and edge computing. M1 redeployed capital toward IoT and marine private networks after delisting, bagging three national awards for enterprise innovation. Simba, originally an ISP, surged past 10% market share by 2024 with aggressive pricing and no-frills digital care.
Strategic alliances define upcoming playbooks: Singtel joined SKT, Deutsche Telekom, e&, and SoftBank to co-create an AI-native telco edge-cloud platform, pooling R&D while accelerating multinational customer acquisition. StarHub inked a low-code partnership with OutSystems to slash time-to-market for industry apps, while all operators align on Open RAN trials to curb vendor lock-in. Disruptive threats loom from satellite newcomers pitching direct-to-device broadband and from hyperscale cloud providers courting the same enterprise spend. Against this backdrop, operators double down on cybersecurity, IoT orchestration, and GPU-as-a-Service to defend relevance beyond bit-pipe economics.
Singapore Telecom MNO Industry Leaders
-
Singapore Telecommunications Limited
-
SIMBA Telecom Pte Ltd
-
M1 Ltd
-
MyRepublic
- *Disclaimer: Major Players sorted in no particular order
Market Opportunities and Future Outlook
Completion of the nationwide shift to 5G Standalone (SA) architecture in 2026 creates room for differentiated connectivity, including network slicing and enterprise-grade service assurances that are harder to replicate on legacy 5G Non-Standalone networks. Household fiber penetration stands at 100%, and active upgrades toward multi-gigabit tiers make convergence bundles that combine mobile 5G, high-speed fixed broadband, and managed security a practical monetization lever, especially in a market where SIM-only pricing pressure is elevated by SIMBA and a large MVNO base.
Enterprise digitalization and compliance-driven security needs also create whitespace for MNO-led managed connectivity and cyber bundles aligned to government and sector frameworks. The December 2024 Shared Responsibility Framework for financial institutions has already increased demand around anti-phishing and API-security collaboration, and industrial 5G use cases in maritime and logistics, including pilots around Tuas Port and Changi-linked aviation workflows referenced in current deployments, support demand for private networks, edge compute, and IoT orchestration. At the same time, the May 2026 IMDA suspension of the SIMBA-M1 acquisition review highlights that consolidation timelines depend on regulatory clearance, which pushes operators to compete more directly on service differentiation (cloud, edge, slicing, and security) rather than near-term structural changes to improve pricing power.
Recent Industry Developments
- July 2026: Nationwide 5G Standalone coverage achieved; M1 completed SA rollout and StarHub ceased 5G-NSA operations as of May 31, 2026. The deployment expands the 5G SA footprint and enables more capable edge services for enterprise customers. The shift strengthens premium offerings and supports AI enabled applications across the network.
- June 2026: Retired 5G NSA network, completing transition to 5G Standalone services. The nationwide SA deployment simplifies network architecture and unlocks advanced capabilities such as network slicing and edge computing. This supports higher ARPU opportunities through enhanced service differentiation.
- May 2026: IMDA suspended review of SIMBA’s proposed acquisition of M1 Ltd following investigation into potential unauthorized RF band usage. Regulatory oversight could influence consolidation timelines and adjust competitive dynamics in the Singapore telco market. The development may shape market structure and strategic planning for operators in 2026 and beyond.
Research Methodology Framework and Report Scope
Market Definition and Coverage
For this report, the Singapore telecom market is measured as the value of telecom services consumed in Singapore across mobile and fixed connectivity, including consumer and enterprise service revenues linked to subscriptions and usage.
Scope exclusions: device sales, standalone telecom hardware, and pure media content revenues are excluded from this market sizing.
Segmentation Overview
- Overall Telecom Revenue and ARPU
- Service Type
- Voice Services
- Data and Internet Services
- Messaging Services
- IoT and M2M Services
- OTT and PayTV Services
- Other Services (VAS, Roaming & International Services, Enterprise And Wholesale Services, etc.)
- End-user
- Enterprises
- Consumer
Data Sources, Market Sizing, and Validation
Desk Research
We start with public telecom statistics and policy documents to map the demand base and service mix in a way that can be checked. Key references include Singapore IMDA telecom statistics releases, official spectrum and licensing notices, ITU indicator definitions, World Bank population and macro series, and OECD communications datasets (where Singapore series are available).
After that, company disclosures are used to connect the service revenue pools to how they shift over time, such as changes in prepaid versus postpaid mix and fiber broadband subscription trends. We also use paid subscriptions from company financials and news and financials to standardize timelines, and we review a patent database to see where network and service innovation is moving from trials to scaled offers. The desk inputs help set the initial structure, but they are not treated as final totals without field checks. This desk source list is not exhaustive because we also use other references during data collection and validation.
Primary Interviews and Surveys
Our sizing assumptions are tested through interviews and structured surveys with telecom service stakeholders, including operator functions, enterprise connectivity buyers, channel partners, and ecosystem experts who track network and tariff changes. We use these conversations to confirm which revenue lines are actually active in the market, how bundles are priced, and where usage and subscriber growth reflect underlying demand rather than short-term promotions, before finalizing inputs for the model.
Distribution of primary research fieldwork respondents
| Company type | Respondent position |
|---|---|
| Top tier: 36% | CXOs: 14% |
| Mid tier: 43% | Functional/Unit leaders: 39% |
| Smaller Players: 21% | Managers: 47% |
Market-Sizing & Forecasting
The model is built by reconstructing the Singapore telecom demand pool from subscription and traffic indicators, and then applying service level monetization to convert it into annual value, which is our top-down anchor. To keep it grounded, we corroborate it with selective bottom-up approximations, such as sampled price plans multiplied by subscriber counts, and then we check the implied revenue direction against what companies discuss in their disclosures.
A few inputs matter more than others, so we track them carefully and refresh them when new data arrives. These include mobile subscription counts by technology generation (3G, 4G, 5G), wired broadband subscriptions and fiber adoption, population penetration indicators, typical ARPU movement for SIM-only versus bundled plans, and enterprise connectivity take-up linked to 5G and IoT use cases. Where direct values are not observable, gaps are handled by using conservative ranges from interviews and then applying them consistently across the service categories until the totals align with independent signals.
For forecasting, scenario analysis is used because pricing pressure, plan migration, and network shutdown milestones can shift the mix even when subscriber levels look stable. The short list of drivers is projected first, and then the market value is derived, so the forecast stays explainable in client discussions and repeatable by another analyst.
Data Validation & Update Cycle
We run multi-step checks so the totals do not rely on a single source or one strong assumption. Outputs are compared with independent signals such as subscription series movements, technology migration pace, and macro indicators, and then outliers are reviewed before sign-off.
When a variance is large, we re-check the service mapping, revisit price assumptions, and re-contact selected interviewees if the change is linked to a real market event (for example, a network retirement or a major tariff reset). Reports are refreshed annually, and interim updates are done when material events affect demand or pricing. Before delivery, an analyst performs a fresh pass on key inputs so clients receive the latest updated view.
Mordor Intelligence's Singapore Telecom Market Size Compared Against Other Published Estimates
Published figures for Singapore telecom often do not line up because the underlying coverage is not the same, and the reporting year and currency conversion timing can differ as well. Some sources focus only on service revenue, while others blend in adjacent digital lines, which then changes what is counted as telecom.
Pay TV and OTT video revenues sit outside Mordor Intelligence's scope here, which is one reason a service-revenue-only estimate can look much smaller than a telecom market figure that includes broader consumer media bundles. Differences also come from how analysts treat enterprise connectivity and IoT lines, plus whether ARPU progression assumes steady price erosion or stabilization after 5G plan migration.
Benchmark comparison
| Source | Market Size | Gaps in Research Methodology |
|---|---|---|
| Mordor Intelligence | USD 14.07 B (2025) | |
| Trade Publisher A | USD 2.90 B (2024) | Uses telecom service revenue as the main measure, which typically excludes several value-added lines and can understate enterprise connectivity and IoT services when they are reported separately. |
| Industry Commentary B | USD 3.10 B (2030) | A forward projection centered on service revenue with a modest growth assumption, and it does not transparently show how shifts in subscriber mix, bundles, and ARPU are modeled year by year. |
The comparison shows that the spread is mainly explained by what is being counted and how the forecast is built. By tying the total to observable subscription and broadband signals and then pressure-testing pricing and mix changes through interviews, the market value remains traceable to clear inputs and repeatable update steps.
Key Questions Answered in the Report
What is the current value of the Singapore MNO telecom market?
It was valued at USD 14.6 billion in 2026 and is forecast to reach USD 17.58 billion by 2031.
How fast is the sector growing through 2031?
The market is projected to grow at a 3.78% CAGR during 2026-2031.
Which service category holds the largest share?
Data services accounted for 52.64% of 2025 revenue.
Which end-user group is expanding the quickest?
Enterprise customers are set to grow at a 4.12% CAGR, outpacing consumer growth.
How will 5G network slicing influence revenue?
Network slicing enables tiered premium services for industry and gaming, adding a projected 1.2 percentage-points to overall CAGR.