
Market Overview
| Study Period | 2020 - 2031 |
|---|---|
| Forecast Data Period | 2026 - 2031 |
| Base Year Market Size (2025) | 3.11 Million square feet |
| Market Volume (2026) | 3.29 Million square feet |
| Market Volume (2031) | 4.37 Million square feet |
| Growth Rate (2026 - 2031) | 5.85 % |
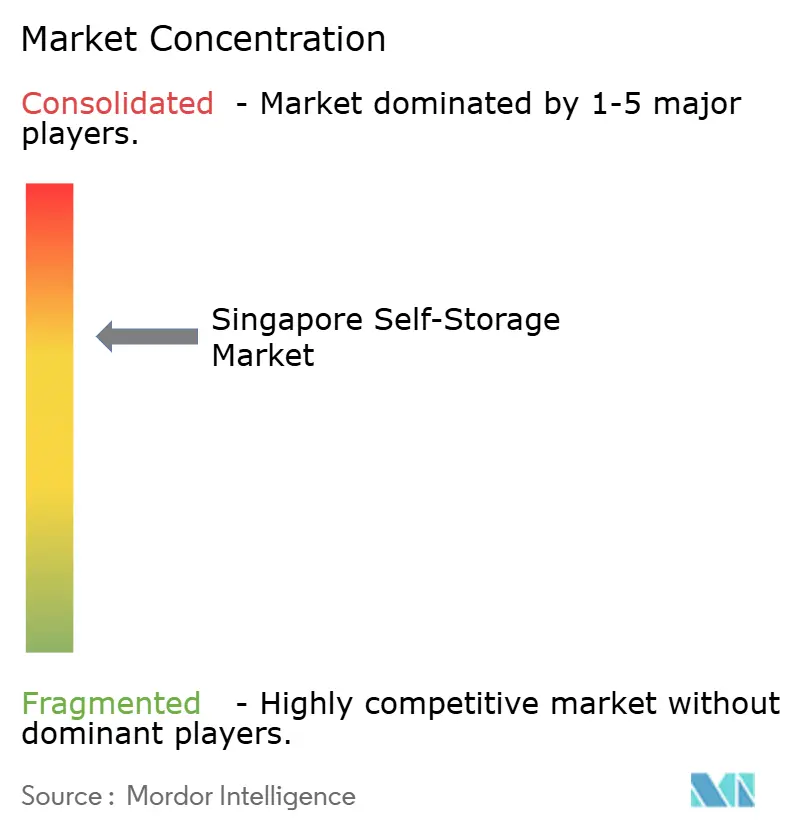
| Market Concentration | Medium |
Major Players *Disclaimer: Major Players sorted in no particular order Image © Mordor Intelligence. Reuse requires attribution under CC BY 4.0. | |
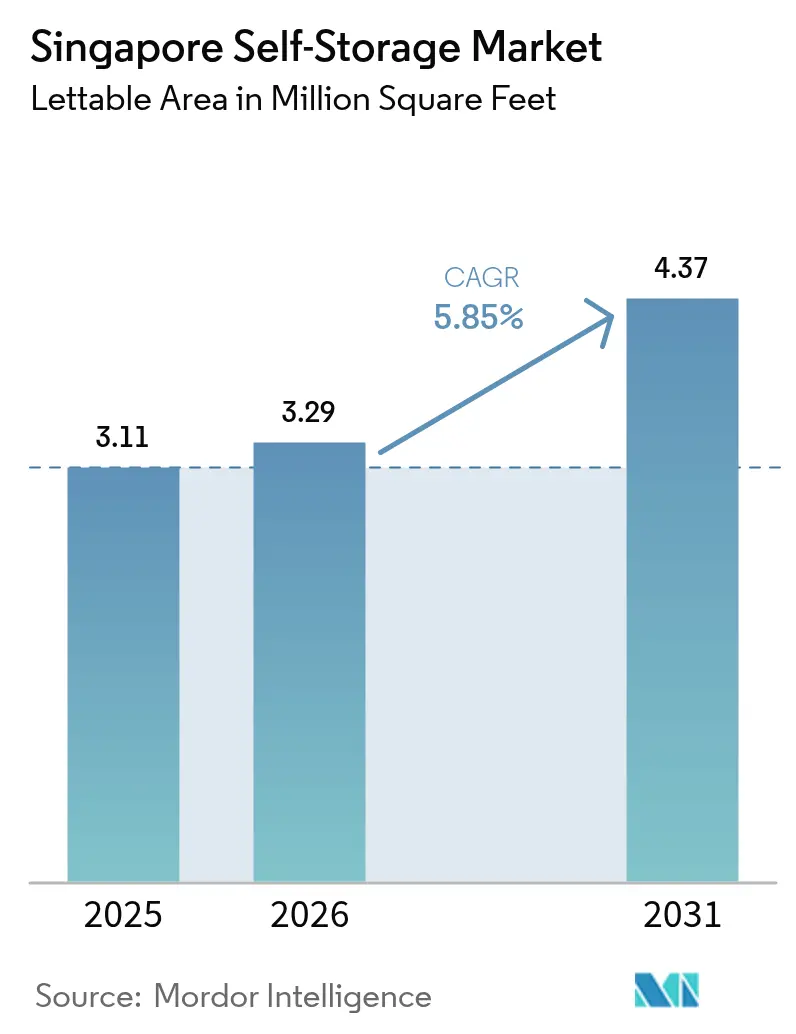
Singapore Self-Storage Market Analysis by Mordor Intelligence
Singapore Self-Storage market size in 2026 is estimated at 3.29 million sq ft, growing from 2025 value of 3.11 million sq ft with 2031 projections showing 4.37 million sq ft, growing at 5.85% CAGR over 2026-2031. Robust population growth, an affluent consumer base, and intensifying e-commerce activity underpin the momentum. Demand is further reinforced by urban redevelopment that continually shrinks average flat sizes, while institutional capital entering the space accelerates construction of modern, climate-controlled facilities. The Singapore self-storage market also benefits from the government’s regional logistics ambitions, specifically the upcoming RTS Link and second airport logistics park that will expand cross-border flows. Competitive intensity remains moderate as high land costs and stringent Fire-Safety Code rules restrict new entrants, yet incumbents deploy technology and premium services to lift yields.
Key Report Takeaways
- By end-user, personal storage led with 61.12% of Singapore self-storage market share in 2025; business applications are projected to grow at 7.05% CAGR through 2031.
- By unit size, small and medium units (less than 40 sq ft) held 48.10% share of the Singapore self-storage market size in 2025, while large units (above 40 sq ft) expand fastest at 6.62% CAGR.
- By storage type, non-climate-controlled units accounted for 71.95% of the Singapore self-storage market size in 2025; climate-controlled offerings record the highest 7.19% CAGR.
- By ownership, leased facilities captured 57.30% of Singapore self-storage market share in 2025, whereas owned properties grow at 6.82% CAGR as institutional investors deepen exposure.
Note: Market size and forecast figures in this report are generated using Mordor Intelligence’s proprietary estimation framework, updated with the latest available data and insights as of 2026.
Singapore Self-Storage Market Trends and Insights
Drivers Impact Analysis*
| Driver | (~) % Impact on CAGR Forecast | Geographic Relevance | Impact Timeline |
|---|---|---|---|
| High population density and affluent demographics | +1.2% | Singapore national | Medium term (2-4 years) |
| Shrinking residential floor area | +1.5% | Central Region focus | Long term (≥ 4 years) |
| SME and e-commerce micro-fulfilment growth | +1.8% | National, Johor spill-over | Short term (≤ 2 years) |
| Institutional investors’ entry | +0.9% | National | Medium term (2-4 years) |
| Rise of cross-border digital nomads | +0.6% | Central Region | Short term (≤ 2 years) |
| Mandatory Green-Mark retrofit demand | +0.4% | National | Short term (≤ 2 years) |
| Source: Mordor Intelligence | |||
High Population Density and Affluent Demographics Boost Discretionary Storage Demand
Singapore packs around 8,000 residents into each square kilometer, a figure unmatched in Asia outside of micro-states. Residents rank living-space constraints among their top stressors, and 50% admit shelving household items externally when feasible.[1] Rising household incomes support recurring rental fees, while a non-resident population that climbed 5% in 2024 values the flexibility to store possessions between relocations. Vertical city planning, exemplified by 50-storey public-housing blocks, concentrates living yet safeguards livability, indirectly pushing belongings into the Singapore self-storage market. Government programs such as GreenGov.SG further normalize “access over ownership,” nurturing structural demand for paid storage.[2]
Shrinking Residential Floor Area from Urban Redevelopment Projects
Higher plot-ratio allowances in prime districts shrink flat sizes even as total housing stock rises. The 2019 Master Plan rezoning of Tanjong Rhu for 5,000 new homes exemplifies how redevelopment favors compact units. The 1H 2025 Government Land Sales program will introduce 8,505 private units, largely within integrated mixed-use projects.[3] As older estates undergo en bloc redevelopment, households downgrade in space and compensate by renting self-storage. This trend guarantees a long-run feedstock of consumers for the Singapore self-storage market.
SME and E-commerce Micro-Fulfilment Growth Needing Flexible Inventory Space
Singapore processed 300,000 parcels daily at SingPost’s regional hub after its SGD 30 million upgrade in 2025, triple 2024 capacity. Small sellers on platforms such as Shopee need space beyond home but short of full warehouses. Operators like Spaceship offer “co-warehouse” space bundled with pick-and-pack stations to serve this niche. The upcoming RTS Link will shorten Singapore-Johor turnaround times, prompting merchants to stock inventory in northern facilities for same-day cross-border delivery. These requirements push businesses toward larger, configurable units within the Singapore self-storage market, bolstering volumes and revenue yield.
Institutional Investors’ Entry Improving Funding Access and Build-Out Pace
CapitaLand Investment folded self-storage into its SGD 134 billion portfolio in 2024, validating the asset class for pension and sovereign funds. Deep-pocketed sponsors accelerate new-build pipelines and upgrade existing sites with solar roofs, automated access, and 24/7 surveillance. Cross-border acquisitions, such as StorHub’s AUD 110 million purchase of three Sydney sites, illustrate the scale possible when institutional money enters. Professional managers standardize safety compliance, marketing, and dynamic pricing, lifting overall sector professionalism.
Restraints Impact Analysis*
| Restraint | (~) % Impact on CAGR Forecast | Geographic Relevance | Impact Timeline |
|---|---|---|---|
| High land costs inflating unit rental rates | -1.8% | Singapore National, acute in Central Region | Long term (≥ 4 years) |
| Limited supply of industrial-zoned land for new facilities | -1.1% | Singapore National | Long term (≥ 4 years) |
| Stringent Fire-Safety Code-2025 raising cap-ex for multilevel facilities | -0.7% | Singapore National | Medium term (2-4 years) |
| Concierge storage start-ups cannibalising traditional unit occupancy | -0.4% | Singapore National, concentrated in Central Region | Short term (≤ 2 years) |
| Source: Mordor Intelligence | |||
High Land Costs Inflating Unit Rental Rates
Industrial land in core districts commands SGD 20–23 per sq m monthly, a baseline many operators exceed to secure sites JTC. While affluent users absorb higher fees, price-sensitive households may delay adoption or downgrade unit sizes. To maintain occupancy, leading brands offer promotional bundles, StorHub enables two months free rent alongside 30% discounts. Sustained rental inflation therefore tempers the Singapore self-storage market’s longer-term CAGR even as nominal revenue grows.
Limited Supply of Industrial-Zoned Land for New Facilities
Singapore’s land-use hierarchy prioritizes advanced manufacturing and logistics over self-storage. Developers must navigate Green-Mark reviews, environmental impact assessments, and Fire-Safety approvals that prolong timelines and inflate soft costs. Smaller operators lacking patient capital struggle to obtain sites, reinforcing market entry barriers. Adaptive-reuse of under-occupied business parks is a partial solution but often entails expensive retrofits to satisfy compartmentalization and sprinkler mandates. The constrained pipeline limits square-footage expansion even as demand climbs, capping potential supply-side response.
*Our forecasts treat driver/restraint impacts as directional, not additive. The impact forecasts reflect baseline growth, mix effects, and variable interactions.
Segment Analysis
By End-User: Enterprise Adoption Outpaces Personal Uptake
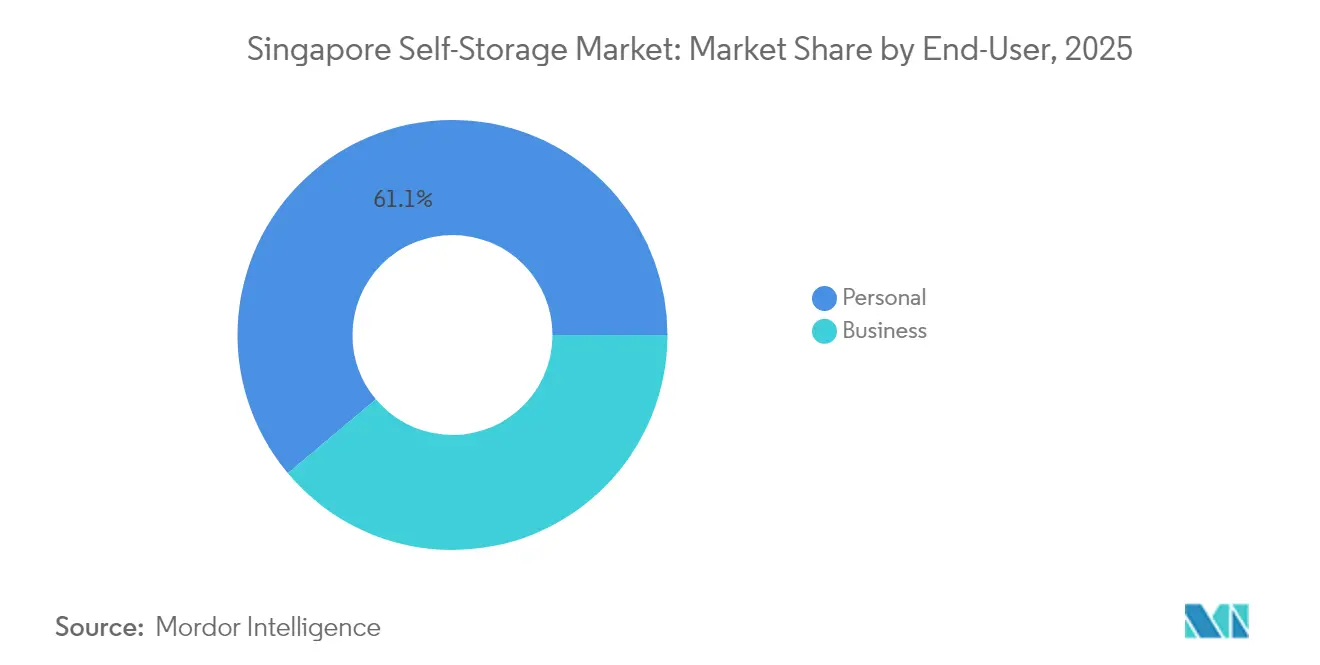
The business segment contributes a 7.05% CAGR to the Singapore self-storage market while personal storage still commands 61.12% share in 2025. Companies favor climate-controlled units and 24/7 access, accepting premium tariffs that elevate revenue per square foot. E-commerce micro-sellers exploit facilities as mini-fulfillment nodes to shorten delivery lead times. Meanwhile, the personal cohort remains a stable volume anchor, driven by apartment downsizing and expatriate churn. Together they sustain broad occupancy, though enterprise clients set the pricing tone through higher service expectations. The Singapore self-storage market size allocated to business users is projected to approach 1.7 million sq ft by 2031, supported by RTS-enabled binational trade flows.

By Storage Size: Large-Unit Uptake Mirrors Logistics Maturity
Small and medium units still account for 48.10% of the Singapore self-storage market size, reflecting individual consumers’ need to stash household overflow. Yet units exceeding 40 sq ft post a 6.62% CAGR as merchants consolidate inventory nearer to end-customers. SingPost’s capacity upgrade lifts parcel volumes, encouraging sellers to stage stock downtown rather than at distant warehouses. Operators respond by reconfiguring upper floors into contiguous blocks that can be subdivided on demand. Large-unit penetration thus signals the market’s shift from pure personal-effects storage to hybrid inventory solutions aligned with omnichannel retail growth.
By Storage Type: Climate-Control Premium Gains Traction
Non-climate-controlled rooms supplied 71.95% of inventory in 2025, yet climate-controlled footprints grow 7.19% annually. Electronics, pharmaceuticals, art, and high-value collectibles deteriorate quickly in 80%+ humidity; enterprises and affluent collectors willingly pay a 15–20% rental premium for controlled environments. StorHub outfits newer sites with solar arrays and energy-efficient HVAC to mitigate power costs and meet Green-Mark targets, keeping margins intact. As climate-control gradually becomes table stakes, operators differentiate via humidity monitoring apps, insurance partnerships, and value-added packing services, embedding stickiness into the Singapore self-storage market.

By Ownership Pattern: Freehold Assets Attract Long-Term Capital
Leased facilities managed 57.30% of space in 2025, but owned properties expand at 6.82% CAGR thanks to institutional appetite. Controlling the underlying real estate shields operators from renewal risk and amplifies equity upside in land-scarce Singapore. CapitaLand’s endorsement has catalyzed similar moves by family offices and REITs seeking stable cash yields. Leasehold models persist for early-stage operators testing micro-markets or occupying upper levels of mixed industrial complexes. The evolution toward ownership deepens the Singapore self-storage industry’s capital pool and encourages higher-spec builds that comply with evolving fire-safety and sustainability codes.
Geography Analysis
The city-state’s compact 728 sq km footprint means every major operator can service the full addressable base, yet micro-location advantages remain decisive. Central Region sites near MRT lines command 20–25% higher rents but fill faster owing to proximity to CBD offices and expatriate enclaves. Suburban estates such as Tampines or Jurong offer larger land parcels, supporting multi-storey complexes with drive-up access. StorHub’s simultaneous roll-out in Serangoon, Tampines, Changi, and Jurong East illustrates a hub-and-spoke model that balances premium rates with volume play.
Northern nodes may experience demand uplift once the RTS Link launches in 2026, enabling 100,000 daily trips between Woodlands and Johor Bahru. SMEs straddling both economies could favor Singapore self-storage market options close to the checkpoint for cross-border inventory splits. Meanwhile, business park under-utilization, International Business Park occupancy stood at 64.4% in 2024, presents adaptive-reuse opportunities, albeit with retrofit costs. Government land-sale priorities will continue to densify residential clusters like Tanjong Rhu, compressing household space and localizing storage demand surges. The second airport logistics park scheduled for the 2030s will attract freight forwarders and e-commerce consolidators, likely lifting climate-controlled unit uptake in Changi precincts. Given uniform national codes, geographic differentiation stems more from access convenience and complementary land-use synergies than from regulatory arbitrage, yet operators adept at micro-site selection should sustain occupancy above 85% across the Singapore self-storage market.
Regulatory Landscape
Singapore self-storage supply is shaped by industrial land-use controls and building and fire-safety compliance. From 1 April 2025, JTC Corporation restricted new self-storage operations on JTC industrial land primarily to selected Business 1 (B1) sites, and disallowed use on Business 2 (B2) and Business Park zones. Existing operators in specified areas were allowed to continue until their individual leases expired. On private industrial properties, change-of-use proposals are evaluated through Urban Redevelopment Authority (URA) processes and prevailing quantum control guidelines, increasing the importance of compliant site selection and space planning.
Facilities must also meet Singapore Civil Defence Force (SCDF) Fire Code requirements, including provisions on means of escape and detection and alarm systems, and relevant requirements such as SS 532 for flammable materials where applicable. This increases capex intensity for multi-level and higher-density layouts. In parallel, Building and Construction Authority (BCA) regulatory updates continue to affect design and retrofit work, including the Building Control (Amendment) Regulations 2026, which came into operation on 1 April 2026. That development reinforces the need for professional engineering and compliance management across new builds and conversions.
Value Chain Analysis
The value chain starts with site sourcing and approvals, where operators secure suitable industrial premises and navigate land-use constraints, including JTC Corporation policies effective from April 2025 that permitted new self-storage requests only on selected Business 1 zoned industrial land and prohibited use on Business 2 and Business Park sites. Development and fit-out then move through design, permitting and construction, with heavy reliance on specialist contractors for compartmentalization, access control, HVAC for climate-controlled units, and SCDF-aligned fire-safety systems.
Industry standard-setting and operating practices are supported by trade bodies such as the Self Storage Association Asia (SSAA), which provides member resources including codes of conduct and standardized documentation. Operations and go-to-market combine traditional facility management with technology-enabled customer acquisition and servicing, including app-based access and AI-enabled customer support. For some providers, robotics-enabled automated storage and retrieval can raise net lettable area by reducing aisle space. Demand is served through direct-to-consumer channels and B2B servicing, with business customers representing about 40% of users by 2025, up from 26% in 2023, which increases the relevance of value-added services such as pick-and-pack, co-warehouse formats and micro-fulfillment-adjacent workflows. Downstream activities include payments, insurance tie-ins, and retention programs, with performance tied to occupancy management, energy costs (especially for climate control), and the availability of compliant industrial space.
Competitive Landscape
The market supports more than 20 operators, yet the top five collectively hold an estimated 65% share, signaling moderate concentration. StorHub leads on footprint and continuous product refresh, recently launching the Lifestyle brand with digital locks and concierge services. Storefriendly counters with robotics-enabled automated retrieval that compresses aisle width and lifts net lettable area by up to 30%. Spaceship differentiates through co-warehouse offerings that wrap in coworking desks, photography booths, and last-mile tie-ups, a blueprint that appeals to omnichannel merchants.
Institutional funding has triggered cross-border M&A, exemplified by StorHub’s AUD 110 million Wilson Storage purchase and Public Storage’s bid for Abacus Storage King. Capital heft enables portfolio diversification beyond traditional urban cores into mixed-industrial clusters. Barriers remain high: the SCDF Fire Code mandates compartmentalized designs and sprinklers, while BCA Green-Mark pushes energy-efficiency standards requiring upfront capex. Operators that internalize design-build expertise and advanced facility-management systems are best placed to navigate compliance while preserving margins in the Singapore self-storage market.
Technology is an emerging battlefield. App-based unit access, dynamic pricing algorithms, and AI-driven capacity planning differentiate leaders from commodity providers. Yet customer service, 24/7 call centers, multilingual support, integrated insurance, continues to influence tenant stickiness. Over the next five years, the Singapore self-storage industry is likely to witness selective consolidation around tech-forward brands with strong balance-sheets, while niche specialists focus on high-margin verticals such as wine, art, or pharmaceutical storage.
Singapore Self-Storage Industry Leaders
-
Store Friendly Management Pte Ltd
-
Spaceship Singapore (Astore Pte. Ltd.)
-
Store Room Pte Limited
-
StorHub Self Storage Pte Ltd
-
Work Plus Store Pte Ltd (“Work+Store”)
- *Disclaimer: Major Players sorted in no particular order
Market Opportunities and Future Outlook
Land-use tightening and lease-expiry-linked relocation risk create whitespace for operators that can secure compliant Business 1 sites and deliver high-spec conversions quickly, particularly when displaced facilities need replacement capacity within the same catchment. The April 2025 shift in JTC Corporation policy reopened selected pathways for self-storage requests on JTC industrial land while restricting eligibility to B1 and excluding B2 and Business Park sites. This raises the competitive value of capable development teams, landlord relationships, and layouts that meet URA quantum controls.
With business customers comprising roughly 40% of demand as of 2025, B2B-oriented offerings such as configurable larger units, add-on logistics services, and integrated workspace-storage formats provide clearer room for differentiation. Technology and sustainability initiatives also offer a second path to protect yields under high land and operating costs. Operators are deploying robotics to improve space efficiency (up to 30% higher net lettable area in automated concepts) and scaling remote management via app-based access and AI-enabled service models. On sustainability, StorHub’s use of UnaBiz IoT sensors and LoRaWAN across its Singapore portfolio to collect air-quality and utility data in support of certifications such as LEED and Arc Skoru points to an investable pathway for energy management and portfolio-level reporting. That approach can support institutional capital requirements and Green-Mark-aligned retrofits, while tightening operating discipline in climate-controlled inventory.
Recent Industry Developments
- April 2026: Building and Construction Authority (BCA) brought the Building Control (Amendment) Regulations 2026 into operation from 1 April 2026, updating compliance requirements including aspects such as lightning protection. This increases the engineering and certification burden for new builds and major retrofits, sharpening the advantage of operators with standardized design, documentation, and contractor management.
- September 2025: StorHub Group acquired three Wilson Storage facilities in Sydney for AUD 110 million, adding 1,977 units across about 1.1 million sq ft. The deal showed the scale of institutional-style capital deployment and portfolio expansion strategies available to leading platforms, supporting stronger procurement leverage and operating playbooks that can be replicated in Singapore.
- January 2024: StorHub Self Storage Group announced certification in Arc Skoru and progress toward LEED v4.1 Operations and Maintenance certification across its Singapore facility portfolio. This formalized sustainability benchmarking and measurement as a competitive tool, reinforcing the shift toward data-driven operations and standards-led upgrades in a market with rising energy costs and tightening building expectations.
Research Methodology Framework and Report Scope
Market Definition and Coverage
This market is defined as the total self-storage space that is available to be rented in Singapore, captured as lettable area across facilities that offer paid storage units to personal and business customers.
Scope exclusions: We exclude non-commercial storage space inside homes, informal shared storage, and general warehousing that is not rented as self-storage units.
Segmentation Overview
- By End-User
- Personal
- Business
- By Storage Size
- Small and Medium Units (less than 40 sq ft)
- Large Units (above 40 sq ft)
- Others (Lockers/Double-Stacked)
- By Storage Type
- Climate-Controlled
- Non-Climate-Controlled
- By Ownership Pattern
- Owned Facilities
- Leased Facilities
Data Sources, Market Sizing, and Validation
Desk Research
Desk work starts by mapping the supply side because self storage in Singapore is closely tied to property availability and allowed land use. We refer to public sources such as Singapore Department of Statistics releases, Urban Redevelopment Authority zoning and planning materials, Singapore Land Authority land and property references, Building and Construction Authority guidance on building works, and Singapore Civil Defence Force fire and safety requirements, which help frame feasible facility additions and operating constraints.
To connect space supply to demand, we also review non-paywalled sources such as major operators' websites and rate cards, REIT and listed-company filings where relevant, and reputable press and property market commentary that discusses occupancy and customer mix. In parallel, we use paid subscriptions for company financials and intelligence, news and financials screening, and global contracts and tenders to capture major facility fit-out activity where it is visible. These sources are used to build assumptions and validate inputs, and the list here is not exhaustive because many other references were used for data collection, cross-checking, and clarification.
Primary Interviews and Surveys
Primary work focused on validating what the desk research cannot fully show, mainly utilization patterns, pricing behavior, and realistic expansion timelines. We spoke with a mix of facility operators, real estate and fit-out stakeholders, and business users, and then cross-checked the findings with feedback from personal storage customers so one demand pocket did not dominate the model.
Distribution of primary research fieldwork respondents
| Company type | Respondent position |
|---|---|
| Top tier: 29% | CXOs: 15% |
| Mid tier: 53% | Functional/Unit leaders: 39% |
| Smaller Players: 18% | Managers: 46% |
Market-Sizing & Forecasting
The sizing model is built mainly using a top-down and bottom-up combination where facility additions, closures, and usable lettable area are reconstructed for Singapore and then adjusted with expected ramp-up time to stabilized occupancy. Once that supply-led pool is set, we corroborate it with selective bottom-up checks such as sampled facility-level unit mix, posted rate ranges, and channel checks on occupancy, which helps us correct for overly optimistic capacity assumptions.
A few practical inputs are tracked closely because they move the total area meaningfully. These include net new facility openings and expansions, the split of climate-controlled versus non-climate-controlled space, typical unit-size mix (small, medium, and larger units), observed occupancy bands by location, and re-pricing behavior when utilization tightens. When some facility data is missing, we use proxy assumptions from comparable sites and then tighten them through follow-up calls until the totals look consistent with day-to-day operating reality.
For forecasting, we rely on scenario analysis tied to forward indicators that interviewees watch, such as projected space constraints in housing, business formation activity, and expected industrial or commercial space availability for conversion. The forecast is then stress-tested by checking whether implied new supply and occupancy progression stays feasible under local permitting and fit-out timelines.
Data Validation & Update Cycle
Validation is handled through repeated cross-checks across supply, demand signals, and operator feedback so that one noisy input does not drive the outcome. We compare model outputs with independent signals such as announced facility pipelines, observed pricing moves, and occupancy commentary, and then outliers are reviewed before sign-off.
When a material variance shows up, such as a sudden shift in achievable occupancy or an unexpected delay in new sites, the assumptions are revisited and interviewees may be re-contacted for clarification. Reports are refreshed annually, with interim updates when major events change supply or demand, and a final pre-delivery review is completed so clients receive the latest updated view.
Mordor Intelligence's Singapore Self Storage Market Size Versus Other Published Estimates
Published estimates for this market can look far apart because the unit of measurement is not consistent across sources, and the scope line between self storage and adjacent storage services is often drawn differently. Timing also matters because new facilities can come online in batches, which can move total lettable area quickly within a short window.
By checking facility openings, net lettable area, and occupancy ramp timing, Mordor Intelligence keeps the sizing tied to in-country square-foot capacity and avoids counting vehicle storage, document archiving, and general warehousing revenue when it is sold as a separate service. Differences also come from whether a source mixes in value-added services like pickup or packaging, and whether pricing is converted using a single exchange-rate point that does not match the base year.
Benchmark comparison
| Source | Market Size | Gaps in Research Methodology |
|---|---|---|
| Mordor Intelligence | USD 0.00 B (2026) | |
| Regional Consultancy A | USD 1.10 B (2024) | Uses a revenue-based definition and appears to widen scope into services such as warehousing and distribution, which does not align to a pure lettable-area capacity view. |
| Industry Newsletter B | USD 0.00 B (2025) | Presents a very small monetary value and does not clarify whether it is storage rent only or also includes ancillary services, making reconciliation to a capacity-led area model difficult. |
The table mainly shows that the spread is driven by unit choice and what services are counted, rather than a simple disagreement on growth direction. When inputs are anchored to facility pipeline, space actually brought to market, and occupancy maturation, the result is easier to reproduce and verify year to year.
Key Questions Answered in the Report
How large is the Singapore self-storage market in 2026?
The Singapore self-storage market size stands at 3.29 million sq ft in 2026 and is forecast to reach 4.37 million sq ft by 2031.
What is the expected growth rate of self-storage space in Singapore?
Total rentable space is projected to expand at a 5.85% CAGR between 2026 and 2031.
Which end-user segment is growing fastest?
Business users, driven by SMEs and e-commerce sellers, are expanding at 7.05% CAGR, outpacing personal storage demand.
Why are climate-controlled units gaining popularity?
Singapore’s high humidity damages electronics, documents, and collectibles, so enterprises and affluent consumers pay premiums for controlled environments growing at 7.19% CAGR.
How do high land costs affect pricing?
Central sites incur SGD 20–23 per sq m monthly in baseline rents, forcing operators to charge higher unit fees and offer promotions to maintain occupancy.