
Market Overview
| Study Period | 2020 - 2031 |
|---|---|
| Forecast Data Period | 2026 - 2031 |
| Historical Data Period | 2020 - 2024 |
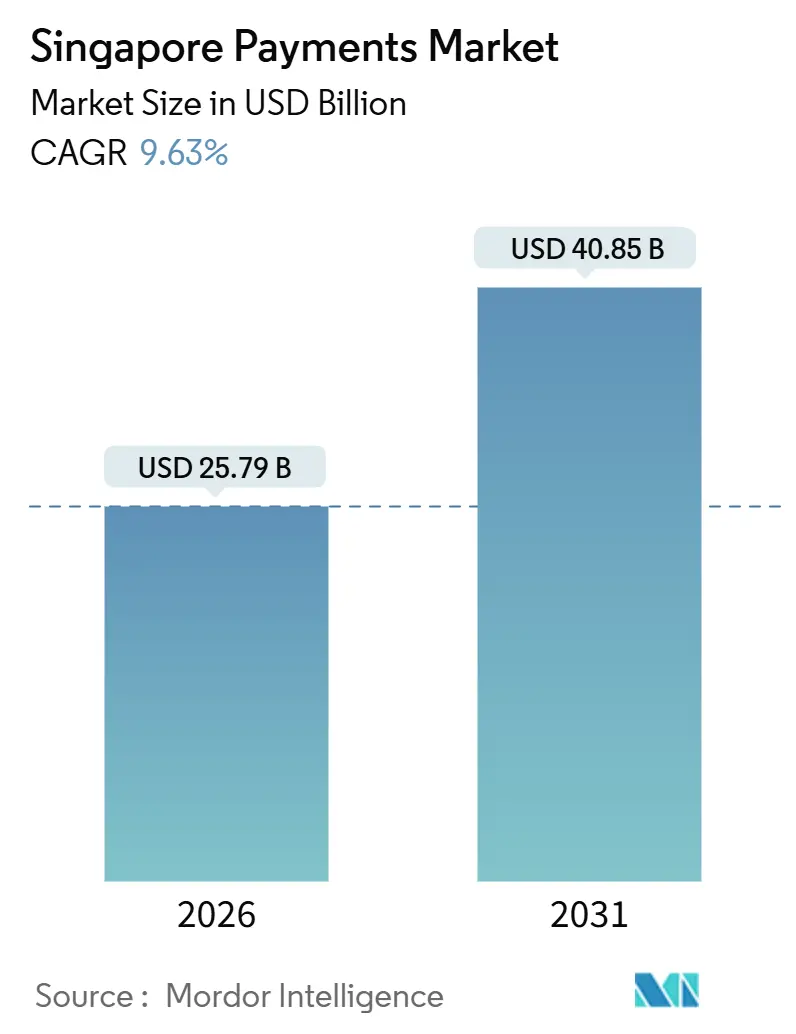
| Market Size (2026) | USD 25.79 Billion |
| Market Size (2031) | USD 40.85 Billion |
| Growth Rate (2026 - 2031) | 9.63% CAGR |
| Market Concentration | Medium |
Major Players *Disclaimer: Major Players sorted in no particular order Image © Mordor Intelligence. Reuse requires attribution under CC BY 4.0. | |
Singapore Payments Market Analysis by Mordor Intelligence
The Singapore payments market size is valued at USD 25.79 billion in 2026 and is forecast to reach USD 40.85 billion by 2031, reflecting a 9.63% CAGR. Ongoing government mandates, the rapid scaling of PayNow rails, and aggressive super-app expansion position the Singapore payments market as a living laboratory for real-time, low-cost transactions. Real-time account-to-account options are absorbing share in e-commerce, while physical retail still leans on cards because of terminal ubiquity. Cross-border corridors that connect PayNow to India, Malaysia, and Thailand shorten settlement cycles from days to seconds, supporting inbound tourism and overseas remittances. Competitive pressure stems from merchant-discount-rate caps that squeeze processors even as volumes rise, forcing pivot toward lending, foreign-exchange conversion, and loyalty orchestration.
Key Report Takeaways
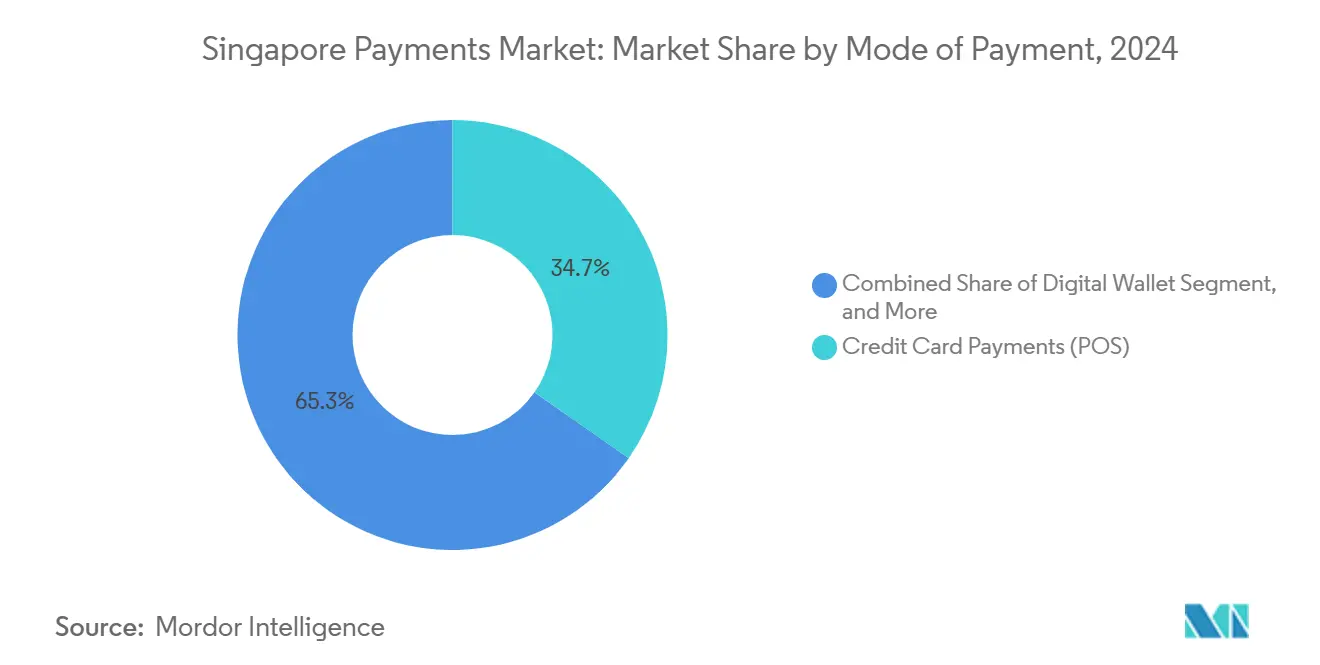
- By mode of payment, credit cards held 34.72% of transaction value at point-of-sale in 2025, whereas online account-to-account transfers are projected to post a 10.62% CAGR through 2031.
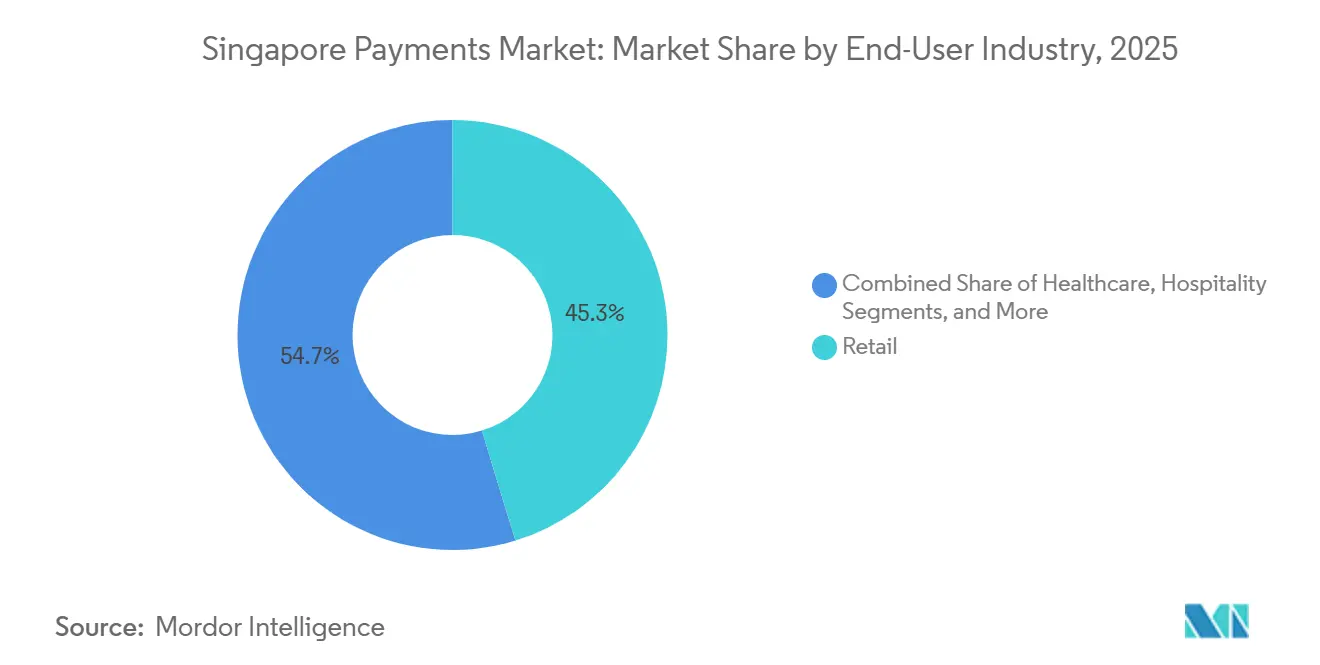
- By end-user industry, retail commanded 45.72% of value in 2025, while healthcare is projected to expand at a 10.73% CAGR to 2031.
Note: Market size and forecast figures in this report are generated using Mordor Intelligence’s proprietary estimation framework, updated with the latest available data and insights as of January 2026.
Singapore Payments Market Trends and Insights
Drivers Impact Analysis*
| Restraint | (~) % Impact on CAGR Forecast | Geographic Relevance | Impact Timeline |
|---|---|---|---|
| E-commerce boom and cross-border retail spend | +2.3% | National, spillover to ASEAN | Medium term (2-4 years) |
| Government-led digital voucher and SGQR initiatives | +2.1% | National, concentrated in hawker centers, healthcare, public transport | Short term (≤ 2 years) |
| Near-real-time PayNow and FAST rails scaling to SMEs | +1.9% | National, cross-border extension to India, Malaysia, Thailand | Medium term (2-4 years) |
| Super-app ecosystems bundling payments and services | +1.7% | National, Southeast Asia reach | Long term (≥ 4 years) |
| Project Orchid CBDC pilots for B2B settlement | +0.8% | National, pilot phase | Long term (≥ 4 years) |
| ESG-linked incentives for low-carbon transactions | +0.5% | National, early corporate banking adoption | Long term (≥ 4 years) |
| Source: Mordor Intelligence | |||
E-Commerce Boom and Cross-Border Retail Spend
Visa-free entry restoration in 2024, PayNow-UPI linkage in February 2025, and previous tie-ups with PromptPay and DuitNow compress settlement to seconds, shaving 40-60 basis points off foreign-exchange spreads.[1]Monetary Authority of Singapore, “PayNow and FAST Payment Services,” MAS.gov.sg Chinese tourists increasingly favor Alipay+ and WeChat Pay at Orchard Road and Changi outlets, reflecting Beijing’s QR-code push over card schemes. E-commerce majors such as Shopee and Lazada route Singapore-dollar proceeds via SGQR, letting overseas sellers bypass local bank accounts, which intensifies competition in fashion, electronics, and beauty.
Government-Led Digital Voucher and SGQR Initiatives
The RedeemSG scheme disbursed SGD 300 (USD 222) digital vouchers to citizens in 2024, compelling 164,000 PayNow-enabled merchants to accept SGQR payments.[2]Infocomm Media Development Authority, “Hawkers Go Digital Programme,” IMDA.gov.sg Hawkers Go Digital waived the 0.5% merchant discount rate through December 2025, removing cost objections for small food vendors. SGQR reached 27 public hospitals and polyclinics in May 2025, cutting outpatient queue times by 30%.[3]SingHealth, “SGQR Rollout to Public Healthcare Facilities,” SingHealth.com.sg Healthcare’s high-ticket, repeat transactions now reinforce habitual wallet use that spills into retail and entertainment.
Near-Real-Time PayNow and FAST Rails Scaling to SMEs
PayNow registrations topped 5 million by end-2024, with cumulative value above SGD 50 billion (USD 37 billion). The Inland Revenue Authority’s November 2025 InvoiceNow mandate embeds PayNow numbers in Peppol invoices, shrinking accounts-receivable cycles from 30 days to under 48 hours. Freelancers and gig workers now generate QR codes at zero marginal cost, while SMEs gain automated reconciliation that disadvantages card settlements lacking machine-readable data.
Super-App Ecosystems Bundling Payments and Services
Grab’s 43.9 million monthly users generated USD 253 million in financial-services revenue in 2024, underpinned by USD 1.2 billion in deposits and a USD 536 million loan book. GrabPay’s 35.3% wallet share and loyalty program lock users into ride-hailing, delivery, and commerce. The November 2025 pact with StraitsX pilots stablecoin payouts that could sidestep correspondent fees, though regulatory clarity on reserves is pending.
Restraints Impact Analysis*
| Driver | (~) % Impact on CAGR Forecast | Geographic Relevance | Impact Timeline |
|---|---|---|---|
| Rising e-commerce fraud and social-engineering scams | -1.4% | National, affects consumer trust | Short term (≤ 2 years) |
| Merchant MDR cap pressures PSP profitability | -1.2% | National, hawker and small-merchant focus | Medium term (2-4 years) |
| Inter-wallet gaps for inbound foreign visitors | -0.6% | Tourist districts and airport retail | Short term (≤ 2 years) |
| Real-time rails cannibalizing card interchange | -0.9% | National, card network revenues | Long term (≥ 4 years) |
| Source: Mordor Intelligence | |||
Rising E-Commerce Fraud and Social-Engineering Scams
Scam losses hit SGD 1.01 billion (USD 750 million) in 2024, a 53% jump year-on-year. Real-time irrevocability speeds fund dispersal across jurisdictions. Banks responded with Money Lock sub-accounts that impose 12-hour withdrawal cooling-off, while the Monetary Authority’s shared-liability proposal would reimburse compliant victims up to SGD 100,000 (USD 74,000). PSPs must now invest in behavioral analytics and device fingerprinting, raising onboarding costs.
Merchant MDR Cap Pressures PSP Profitability
The Hawkers Go Digital subsidy erased a 0.5% MDR through December 2025, forcing acquirers to absorb interchange and network fees without offsetting revenue. Expectations of zero-cost acceptance may linger, making fee reinstatement politically sensitive. Processors seek margin in working-capital loans and inventory financing but need credit-risk capabilities many lack. International entrants such as Stripe and Adyen face local super-apps that can cross-subsidize acceptance from profits in ride-hailing and banking, producing a cost dynamic hard to match.
*Our forecasts treat driver/restraint impacts as directional, not additive. The impact forecasts reflect baseline growth, mix effects, and variable interactions.
Segment Analysis
By Mode of Payment: Real-Time Rails Reshape Channel Economics
Credit cards retained a 34.72% slice of point-of-sale value in 2025, underscoring entrenched terminal networks and rewards propositions. Conversely, online account-to-account transfers are forecast to grow at 10.62% CAGR, the fastest pace across channels, reflecting consumer preference for instant, low-fee settlement. Digital wallets captured 39% of e-commerce value in 2024, down from 47% a year earlier as card issuers countered with enhanced cashback and installment options. Debit cards remain relevant for spend-control users, yet growth lags wallets that bundle loyalty and one-click checkout. Cash-on-delivery persists for luxury goods but continues to shrink.
Apple’s Tap to Pay on iPhone debuted in December 2025, letting merchants accept contactless payments with only a phone, which could accelerate small-merchant card and wallet penetration. Legacy stored-value cards such as NETS FlashPay survive in transport niches but face gradual displacement as mobile wallets integrate NFC and QR formats. These shifts illustrate how the Singapore payments market recalibrates economic models as real-time rails cannibalize card interchange in digital commerce, while physical retail remains anchored to cards until hardware costs fall.


By End-User Industry: Healthcare Digitization Outpaces Retail
Retail accounted for 45.72% of transaction value in 2025, driven by high-frequency supermarket and e-commerce spend. Healthcare, however, is projected to post a 10.73% CAGR through 2031, the swiftest among industries, after SGQR reached 27 public hospitals and polyclinics in May 2025. The Singapore payments market size attributable to healthcare is therefore on a steeper growth curve than legacy retail as aging demographics push recurring medical outlays.
Digital acceptance now spans telemedicine and pharmacy chains, where PayNow numbers embed directly into bills, cutting reconciliation overhead. Entertainment and hospitality receive a lift from tourism rebound, with Alipay+ and WeChat Pay acceptance at Sentosa, Marina Bay Sands, and Changi Airport capturing Chinese visitor spend. Education, transport, and government services are integrating digital channels but remain smaller contributors. The InvoiceNow mandate compels large businesses to embed PayNow IDs in invoices, shortening receivables cycles and reinforcing account-to-account uptake.
Geography Analysis
The compact city-state concentrates 5.9 million digitally connected residents, letting regulators pivot the entire Singapore payments market with policy strokes. The regulatory sandbox born in 2016 nurtured fintech pilots that matured into PayNow and FAST, which now act as ASEAN templates. Cross-border ties to India’s UPI, Thailand’s PromptPay, and Malaysia’s DuitNow remove correspondent banks, lowering migrant-worker remittance costs and simplifying merchant settlement.
The June 2025 creation of Singapore Payments Network unified oversight of NETS, SGQR, and real-time schemes, tackling wallet fragmentation that frustrated tourists. Project Orchid’s November 2025 BLOOM trial tokenized wholesale deposits for instantaneous cross-border B2B settlement, hinting at liquidity savings of 20-30%.
While retail CBDC remains distant, wholesale insights shape future architecture. The Payment Services Act licenses all providers and aligns AML, CTF, and cybersecurity rules with FATF norms, while the shared-liability scam framework shifts risk onto institutions, prompting heavier investment in fraud controls. Regional peers observe Singapore’s model when crafting their own regulatory blueprints, cementing the city-state’s influence on Southeast Asian payment standards.
Regulatory Landscape
The Monetary Authority of Singapore (MAS) regulates payment services primarily under the Payment Services Act 2019 (PS Act), which sets licensing, safeguarding, AML/CFT, and technology-risk expectations for payment service providers across account issuance, e-money issuance, merchant acquisition, domestic and cross-border money transfer, and digital payment token (DPT) services. Amendments that commenced on 4 April 2024 expanded the scope of regulated payment services and introduced additional user protection requirements for DPT service providers, reinforcing MAS supervision over both retail payments and token-linked use cases.
Industry governance is also changing. MAS and the Association of Banks in Singapore (ABS) incorporated Singapore Payments Network (SPaN) in 2025 to consolidate the administration and governance of national payment schemes. MAS and ABS also launched the PayNow Generation 2 (PayNow Gen2) study in June 2026 to evaluate enhancements across customer experience, business payments, network coverage, and scheme-level enablers, reflecting continued regulatory and industry attention on system-wide interoperability and resilience.
Value Chain Analysis
Singapore's payments value chain begins with end users (consumers, SMEs, enterprises, and public-sector billers) and merchants, then moves through acceptance and enablement layers such as PSPs/payment gateways, merchant acquirers, and wallet providers. Transactions run over national and international rails, including FAST, PayNow, Inter-bank GIRO, and SGQR for domestic account-to-account and QR payments, alongside global card networks and cross-border money transfer networks for card and remittance flows. Scheme and infrastructure governance is consolidating under Singapore Payments Network (SPaN), incorporated by MAS and ABS in 2025, to align standards, access rules, and product roadmaps across national payment schemes.
Upstream dependencies include bank core systems, identity/AML screening, fraud monitoring, and dispute handling, while downstream services increasingly bundle reconciliation, invoicing, and working-capital enablement around payments. The transition away from cheques toward electronic deferred payment (EDP) methods (introduced via banks from mid-2025) also pushes enterprise payment operations toward digital workflows that connect more directly with invoicing and treasury systems. License enforcement remains a gating factor for participation in certain segments of the chain, with MAS actions under the PS Act able to remove non-compliant entities from providing regulated services.
Competitive Landscape
Competition spans global card networks, super-apps, and specialist processors. Visa and Mastercard still earn interchange on point-of-sale flows but face margin compression as PayNow rails siphon digital-commerce volume. Grab leverages its closed ecosystem, 43.9 million users, and USD 1.2 billion in deposits to cross-sell loans, insurance, and wealth products, blunting pure-play processors. Stripe, Adyen, and Checkout.com attract merchants via developer-friendly APIs yet must operate within MDR caps that local super-apps can subsidize through ancillary profits.
White-space lies in cross-border B2B payments as the BLOOM CBDC trial proved tokenized settlement can slash liquidity costs, attracting banks and corporates. Emerging players such as StraitsX pilot stablecoin payouts with Grab, aiming at near-zero FX costs for remittances, though capital rules remain unsettled. Technology differentiation now tilts toward embedded finance, where payments become a feature inside vertical software rather than a standalone integration.
Singapore Payments Industry Leaders
PayPal Holdings, Inc.
Grab Holdings Ltd.
Network for Electronic Transfers (Singapore) Pte Ltd.
Visa Inc.
Apple Inc. (Apple Pay)
- *Disclaimer: Major Players sorted in no particular order


Market Opportunities and Future Outlook
A key whitespace is merchant-side interoperability and simpler routing at point-of-sale, since multiple QR schemes and payment methods still create operational friction. MAS and ABS are planning an end-2026 pilot to enable interoperability between PayNow and NETS QR, allowing consumers to scan and pay at participating merchants regardless of the underlying scheme. This can create room for aggregators, POS platforms, and acquirers to standardize checkout, reconciliation, and settlement across rails.
Cross-border real-time corridors provide another opportunity set tied to measurable expansion and institutional support. NPCI International Payments Limited expanded the UPI-PayNow linkage in July 2025 by adding 13 banks, bringing participation to 19 banks for remittances between India and Singapore, while MAS continues to position PayNow as a platform for further cross-border linkages through its own initiatives. Separately, the June 2026 PayNow Gen2 study prioritizes business payments and scheme-level enablers, pointing to demand for richer data, stronger coverage, and more enterprise-ready rails that support InvoiceNow-style workflows and automated reconciliation, particularly for SMEs and high-frequency service sectors.
Recent Industry Developments
- July 2026: Grab completed its acquisition of digital investing platform Stash Financial, Inc., moving beyond payments into wealth and money-management capabilities within its ecosystem. The deal strengthens cross-sell potential from wallet and merchant acceptance into investing journeys, raising the bar for super-app led financial services bundles in Singapore.
- June 2026: MAS and ABS launched the PayNow Generation 2 (PayNow Gen2) study, framing four enhancement themes covering customer experience, business payments, network coverage, and scheme-level enablers. The program formalizes the next upgrade cycle for national instant payments and supports deeper adoption of PayNow in enterprise and software-embedded payment flows.
- December 2025: Apple launched Tap to Pay on iPhone in Singapore, enabling merchants to accept contactless payments using only an iPhone and supported partners such as Stripe and Adyen. This lowers hardware barriers for small merchants and can accelerate card and wallet acceptance density across micro-retail and services.


Research Methodology Framework and Report Scope
Market Definition and Coverage
For this report, the Singapore payments market is defined as the value of non-cash payment transactions made by consumers to merchants in Singapore, across in-store and online acceptance. It covers the major payment instruments and rails that support everyday purchase activity, and it is measured in USD.
Scope exclusions: motor vehicle and real estate purchases, utility or loan bill payments, capital market trades, and cash usage are excluded from the market value.
Segmentation Overview
- By Mode of Payment
- Point-of-Sale
- Debit Card Payments
- Credit Card Payments
- Account-to-Account (A2A) Payments
- Digital Wallet
- Cash
- Other Point-of-Sale Payment Mode
- Online Sale
- Debit Card Payments
- Credit Card Payments
- Account-to-Account (A2A) Payments
- Digital Wallet
- Cash-on-Delivery
- Other Online Sales Payment Mode
- Point-of-Sale
- By End-User Industry
- Retail
- Entertainment
- Hospitality
- Healthcare
- Other End-User Industries
Data Sources, Market Sizing, and Validation
Desk Research
Desk research helped us set clear market boundaries and pull stable reference data for Singapore payments. We reviewed public releases and statistical series from sources such as the Monetary Authority of Singapore, Department of Statistics Singapore, Infocomm Media Development Authority, and the Association of Banks in Singapore to understand payment usage shifts, digital readiness, and system-level adoption signals.
To ground assumptions further, we referenced non-paywalled publications and data notes from the Bank for International Settlements and the World Bank for comparable payment system indicators, then used listed-company annual reports, audited financial statements, and investor presentations for directional validation on payment activity and merchant acceptance. Where required for cross-checking, we also used paid subscriptions for company financials and intelligence, news and financials, and a shipment-level import and export database to verify select cross-border commerce signals that influence payment acceptance. The desk sources listed here are illustrative only, and other public references were also used for data collection, validation, and clarification during the study.
Primary Interviews and Surveys
Primary work was used to pressure-test assumptions that are not fully visible in public data, such as mix shifts across cards, wallets, and account-to-account payments, and the pace of adoption across key merchant categories. We spoke with payment ecosystem participants across issuers, acquirers, gateways, large merchants, and service providers, then reconciled the inputs against Singapore-specific usage patterns so the final numbers stay consistent and explainable.
Distribution of primary research fieldwork respondents
| Company type | Respondent position | Region |
|---|---|---|
| Top tier: 31% | CXOs: 15% | |
| Mid tier: 50% | Functional/Unit leaders: 33% | |
| Smaller Players: 19% | Managers: 52% |
Market-Sizing & Forecasting
Sizing was built using a top-down reconstruction that starts from consumer purchase activity and then allocates it across payment instruments used at physical points of sale and in domestic e-commerce (including travel platforms). Once the demand pool was set, it was adjusted using indicators that move payment value in practice, such as reported card and e-money transaction value trends, growth in online retail spending, PayNow adoption by use case, changes in merchant acceptance, and the ramp-up pace of linked real-time payment corridors.
We then ran selective bottom-up checks to keep totals realistic, using sampled merchant category volumes, simple volume times average ticket approximations where suitable, and channel checks on how value is split between cards, wallets, and account-to-account rails. If a sub-area had sparse disclosure, the gap was handled using conservative adoption ramps and follow-up expert validation before it was merged back into the overall total.
Forecasting was done using scenario analysis so the outlook stays usable when macro conditions and consumer spend change. The forward view leaned on a small set of drivers, including consumer spending outlook, e-commerce penetration, real-time payments usage expansion, cross-border linkage ramp-up, and the expected pace of cash displacement, with each driver reviewed and refined using primary feedback.
Data Validation & Update Cycle
Validation was completed by comparing modeled outputs with independent signals, such as public transaction value series, regulatory milestones, and visible shifts in acceptance across large merchant categories. When variances appeared, they were investigated through year-to-year consistency checks and instrument-level splits, then reviewed again through an internal analyst pass before sign-off.
The report is refreshed annually, and interim updates are triggered when material events occur, such as new rail linkages, major rule changes, or step-changes in adoption. Before delivery, a fresh review is performed so clients receive the latest updated view available at the time of publication.
Mordor Intelligence's Singapore Payments Market Size Versus Other Published Estimates
Published market sizes for payments in Singapore often vary because each publisher defines the transaction universe differently, counts different legs of a flow, and sometimes shifts between transaction value views and revenue-type views. Differences also come from how cross-border flows are treated, how SGD values are converted to USD, and whether the base year and refresh timing align with major rails changes.
Utility or loan bill payments sit outside Mordor Intelligence's scope for this report, which can pull the total away from estimates that bundle recurring bill-pay volumes into everyday merchant payments. We also see gaps when some sources mix person-to-person transfers with merchant payments without de-duplication, or when card-only views are interpreted as the whole payments market even though wallets and account-to-account activity are meaningful in Singapore.
Benchmark comparison
| Source | Market Size | Gaps in Research Methodology |
|---|---|---|
| Mordor Intelligence | USD 25.79 B (2026) | |
| Trade Journal A | USD 113.70 B (2030) | Uses a broader digital payments basket and is not limited to consumer-to-merchant purchase activity, which can fold in adjacent transfer and non-merchant flows, and it also reflects a later forecast year than the baseline. |
| Industry Association B | USD 158.20 B (2025) | Represents card payment value only, which can be overstated when read as an overall payments market number, and it does not include wallet and account-to-account flows that contribute to total purchase payments. |
The spread across the three figures mainly comes down to what is counted and the year each number represents. By keeping the model tied to consumer-to-merchant purchase value and then verifying mix and adoption signals through interviews and public checks, the final sizing remains traceable to clear inputs and repeatable steps.


Key Questions Answered in the Report
How fast is the Singapore payments market expected to grow through 2031?
Market value is projected to rise from USD 25.79 billion in 2026 to USD 40.85 billion by 2031, registering a 9.63% CAGR.
Which payment channel is expanding the quickest?
Online account-to-account transfers are forecast to grow at 10.62% CAGR, the fastest among all modes.
Why is healthcare becoming a high-growth vertical?
SGQR deployment across 27 public hospitals and polyclinics in 2025 streamlined billing, pushing healthcare transaction value to a projected 10.73% CAGR.
What is driving cross-border payments growth?
PayNow links to India, Malaysia, and Thailand reduce settlement times to seconds and lower FX costs, increasing tourist and remittance flows.
How are providers countering MDR caps?
Processors diversify into lending, FX conversion, and data analytics to offset thinner acceptance margins.
Page last updated on:


