
Market Overview
| Study Period | 2020 - 2031 |
|---|---|
| Forecast Data Period | 2026 - 2031 |
| Base Year Market Size (2025) | USD 9.48 Billion |
| Market Size (2026) | USD 10.18 Billion |
| Market Size (2031) | USD 14.57 Billion |
| Growth Rate (2026 - 2031) | 7.42 % |
| Market Concentration | Medium |
Major Players *Disclaimer: Major Players sorted in no particular order Image © Mordor Intelligence. Reuse requires attribution under CC BY 4.0. | |
Singapore Luxury Residential Real Estate Market Analysis by Mordor Intelligence
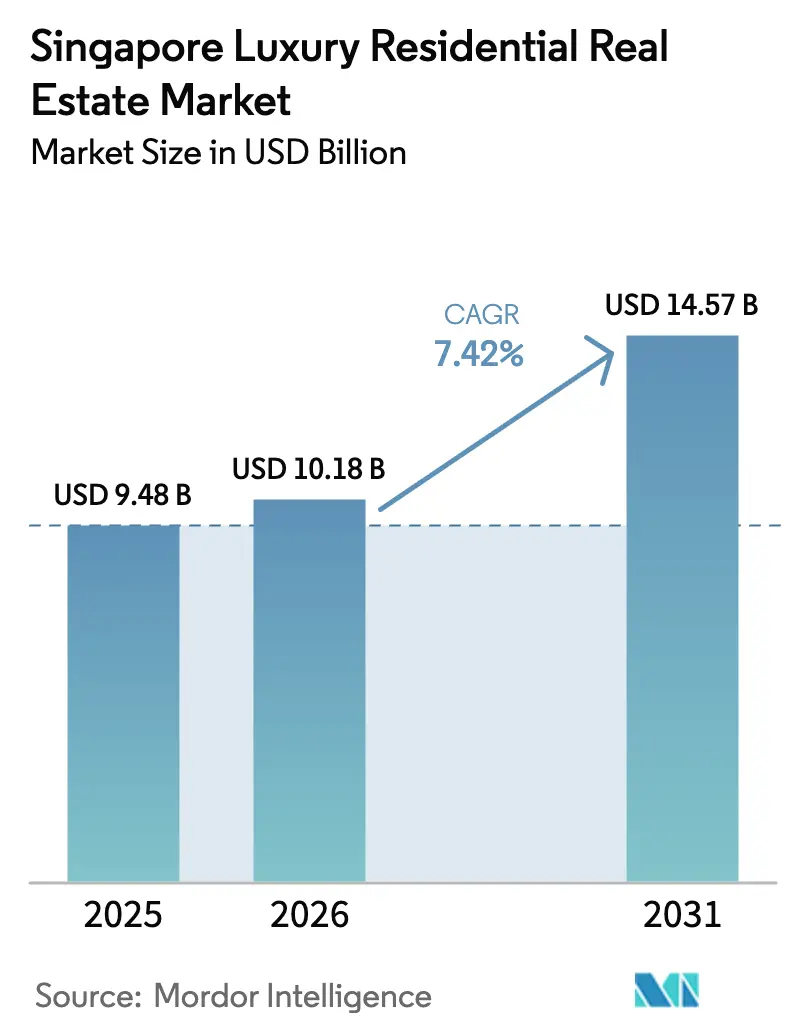
The Singapore Luxury Residential Real Estate Market size was valued at USD 9.48 billion in 2025 and estimated to grow from USD 10.18 billion in 2026 to reach USD 14.57 billion by 2031, at a CAGR of 7.42% during the forecast period (2026-2031). Demand remains underpinned by the city-state’s safe-haven status for ultra-high-net-worth individuals (UHNWIs), a tight land bank, and a regulatory framework that favors long-term end-users over short-term speculators. Executive-level housing needs generated by Singapore’s USD 9.99 billion fixed-asset investment inflows in 2024 offset much of the decline in speculative foreign buying. Villas and landed houses are gaining momentum alongside a parallel surge in rental demand as wealthy newcomers test the market before committing to ownership. Technology is reshaping product design and investment channels, with tokenization pilots widening access to prime assets for crypto-wealthy investors. Finally, climate-resilient infrastructure—most notably the USD 125.8 million flood-protection works around Orchard Road—has started to command tangible price premiums.
Key Report Takeaways
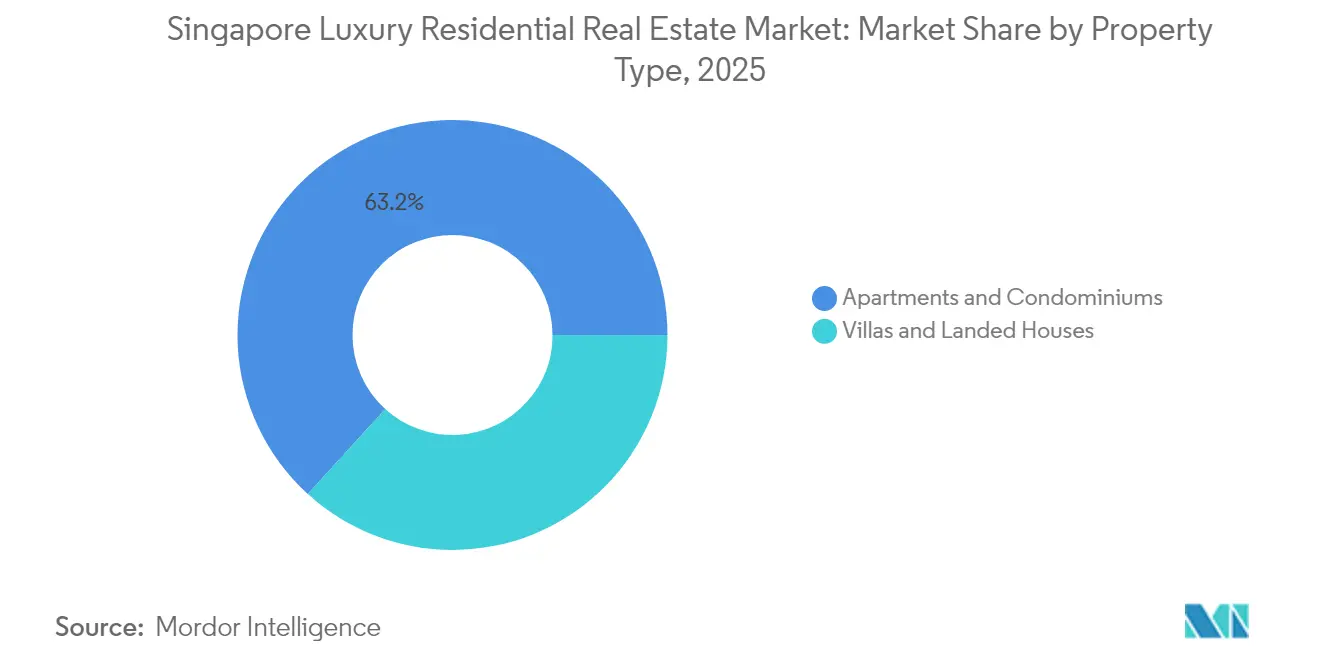
- By property type, apartments and condominiums secured 63.25% of the Singapore luxury residential real estate market share in 2025, while villas and landed houses are forecast to expand at an 8.05% CAGR through 2031.
- By business model, the sales segment held 70.35% revenue share in 2025, whereas rentals are projected to grow at 8.62% CAGR to 2031.
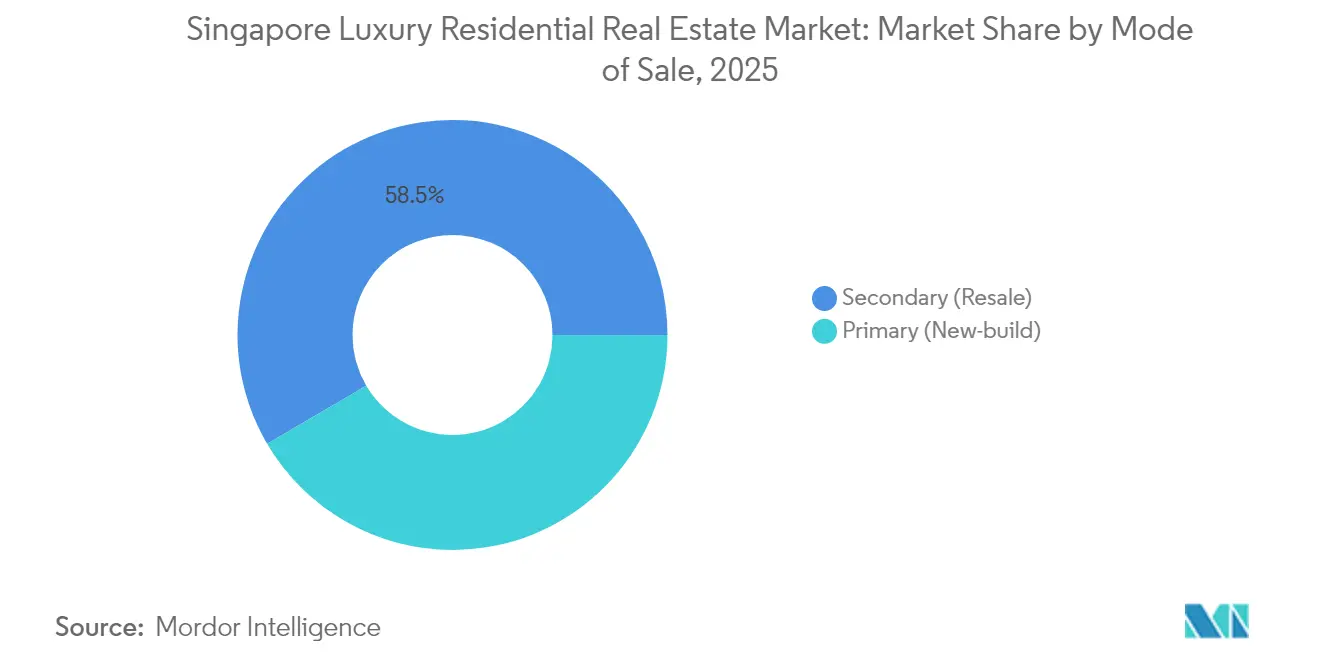
- By mode of sale, secondary (resale) transactions accounted for 58.45% of the Singapore luxury residential real estate market size in 2025; primary new-builds are advancing at an 8.17% CAGR over the same period.
- By district, the Central Business District commanded 45.40% share of the Singapore luxury residential real estate market in 2025; Sentosa Cove is the fastest-growing district, rising at a 8.92% CAGR through 2031.
Note: Market size and forecast figures in this report are generated using Mordor Intelligence’s proprietary estimation framework, updated with the latest available data and insights as of 2026.
Singapore Luxury Residential Real Estate Market Trends and Insights
Drivers Impact Analysis*
| Driver | (~) % Impact on CAGR Forecast | Geographic Relevance | Impact Timeline |
|---|---|---|---|
| Robust UHNW inflows & Singapore's safe-haven appeal | +2.1% | Global, with concentration in Core Central Region | Medium term (2-4 years) |
| Ultra-low interest rates fuelling hard-asset allocation | +1.8% | Global, particularly affecting foreign buyers | Short term (≤ 2 years) |
| Foreign buyer demand leveraging SGD strength & political stability | +1.3% | Global, with emphasis on APAC and European buyers | Long term (≥ 4 years) |
| Tokenised property platforms enabling crypto-wealth deployment | +0.9% | Global, with early adoption in Singapore CBD | Medium term (2-4 years) |
| Wellness-centric "healthy homes" commanding premiums | +0.7% | National, with premium in Sentosa Cove and Orchard Road | Long term (≥ 4 years) |
| Singapore's fintech & biotech boom boosting prime demand | +0.6% | National, concentrated in CBD and emerging districts | Medium term (2-4 years) |
| Source: Mordor Intelligence | |||
Robust UHNW inflows & Singapore’s safe-haven appeal
Net migration of 3,500 millionaires in 2024 places Singapore third globally for private-wealth inflows. Many of these newcomers establish operational bases rather than passive asset parks, creating durable demand across central districts. Rental caveats in the Core Central Region rose 5.7% as UHNWIs opted to lease premium condominiums before purchasing. The city-state’s political stability, transparent regulations, and tax consistency reinforce this inflow momentum. As a result, luxury listings seldom stay on the market long, sustaining price resilience even during policy tightening.
Ultra-low interest rates fuelling hard-asset allocation
Monetary easing across major economies continues to steer global capital toward hard assets. The Monetary Authority of Singapore’s measured currency-band adjustments sustain an accommodative backdrop that enhances real estate’s inflation-hedge appeal. Crypto-wealthy investors convert volatile digital holdings into tangible property, illustrated by a 52.2% jump in heritage shophouse sales during Q1 2024. Developers leveraging construction automation—robots that lift painting productivity by 30%—help contain build costs, ensuring new launches remain attractive. The driver is set to moderate only when global interest-rate normalization becomes entrenched.
Foreign buyer demand leveraging SGD strength & political stability
A firm Singapore dollar offsets the doubled 60% Additional Buyer’s Stamp Duty (ABSD) for foreigners, filtering out speculators yet retaining committed investors. Transaction evidence, such as the USD 29.2 million Ford Avenue mansion purchase by banking-family scion Grace Wee, shows that governance premiums outweigh elevated entry costs for many overseas buyers. Climate-resilient investments further protect long-term value, strengthening confidence among global UHNWIs.
Tokenised property platforms enabling crypto-wealth deployment
Project Guardian has brought 24 global banks and asset managers into live pilots that fractionalize prime real estate on shared ledgers. This framework lowers ticket sizes and enhances liquidity, broadening the investor pool for marquee condominiums in the Singapore luxury residential real estate market. Early adopters are already marketing tokenised stakes in CBD projects, signaling an on-ramp for digital-asset holders seeking geographic diversification[1].
Restraints Impact Analysis*
| Restraint | (~) % Impact on CAGR Forecast | Geographic Relevance | Impact Timeline |
|---|---|---|---|
| Additional Buyer's Stamp Duty (ABSD) on foreign purchases | -2.3% | National, particularly affecting foreign buyer segments | Short term (≤ 2 years) |
| Limited land supply & strict government land release policies | -1.4% | National, with acute impact in prime districts | Long term (≥ 4 years) |
| Construction cost inflation & labor shortages | -1.1% | National, with higher impact on new developments | Short term (≤ 2 years) |
| Climate-risk considerations for waterfront properties | -0.8% | Coastal districts, particularly Sentosa Cove and East Coast | Medium term (2-4 years) |
| Source: Mordor Intelligence | |||
Limited land supply & strict government land-release policies
Singapore’s land scarcity is structural, leaving the Government Land Sales (GLS) programme as the main channel for adding supply. Only 8,505 private units are earmarked for release in 1H 2025, marginally above the previous tranche. Competitive bidding drives plot prices higher, as seen in Allgreen’s USD 540.3 million Zion Road bid and GuocoLand’s unsuccessful offer for Marina Gardens Crescent. Reclamation plans like the Long Island project will not deliver residential plots for at least a decade, keeping prime land a scarce commodity and capping volume growth.
Additional Buyer’s Stamp Duty (ABSD) on foreign purchases
The April 2023 ABSD hike to 60% created a formidable cost hurdle for non-resident buyers. Luxury bungalow deals shrank in early 2025 as global investors recalibrated after the policy shock. Some foreign buyers now explore indirect structures or real-estate investment trusts to bypass ABSD, but volumes remain subdued. While the measure curbs speculation and cools prices, it removes a pool of incremental capital that might otherwise accelerate market turnover.
*Our forecasts treat driver/restraint impacts as directional, not additive. The impact forecasts reflect baseline growth, mix effects, and variable interactions.
Segment Analysis
By Property Type: Condominiums Anchor Demand While Landed Homes Outpace
Apartments and condominiums captured 63.25% of the Singapore luxury residential real estate market share in 2025, reflecting the city’s high-rise urban model and turnkey appeal to globally mobile investors. Premium towers in Marina Bay and Orchard Road offer hotel-grade concierge services, integrated retail, and rapid transit access, attributes that resonate with time-pressed executives. Condominium values have also benefited from tokenisation pilots that unlock smaller investment tickets without requiring whole-unit ownership.
Landed houses, though smaller in base, are the fastest-growing slice at an 8.05% CAGR through 2031 as UHNWIs chase space and privacy unavailable in vertical living. Supply is inherently capped by zoning controls, with good-class bungalow areas rarely expanded. The USD 29.2 million Ford Avenue transaction underscores buyers’ willingness to absorb ABSD for unique assets. Developers respond by retrofitting older landed stock with wellness features and climate-resilient drainage to command even higher premiums, reinforcing the segment’s upward trajectory.

By Business Model: Sales Still Dominate as Rentals Bloom
Sales transactions delivered 70.35% of 2025 revenue, cementing Singapore's luxury residential real estate market norms that privilege ownership for wealth preservation. Permanent-resident upgraders join foreign family offices in viewing prime property as a multi-generational store of value. ABSD differentials also continue to favor citizens, sustaining local buy-to-hold activity even as foreign enthusiasm moderates.
Rentals, however, are expanding at a brisk 8.62% CAGR as 3,500 new millionaires trickle in and opt for flexibility. Core Central Region leases grew 5.7% in 2024, led by longer-term executive contracts that often exceed three years. A pipeline of 40,000 completions slated for 2025 should ease vacancy pressures and stabilise rents. Investors see upside in assembling rental portfolios that can later be tokenised, providing liquidity without outright divestment.
By Mode of Sale: Resale Raises Liquidity While New-Builds Gain Cachet
Secondary deals made up 58.45% of market turnover in 2025, a testament to Singapore’s deep pool of mature luxury stock across Districts 9, 10, and 11. Buyers value immediate availability, proven management, and established neighbourhood character. Resale liquidity also appeals to investors who prefer price discovery through recent transaction evidence.
Primary launches, advancing at an 8.17% CAGR, are moving up the amenity curve to justify premiums. The latest GLS sites at Zion Road and Keppel Golf Course will debut carbon-neutral materials, robotic valet parking, and in-house telehealth clinics. Green Mark 2021 certification has become table stakes, nudging developers toward solar-ready rooftops and grey-water recycling. Buyers willing to wait for completion gain a future-proof design and lower operating costs, balancing the immediate gratification of resale.
Geography Analysis
Singapore’s compact geography means the entire island functions as one interconnected Singapore luxury residential real estate market. Prime central zones—Districts 1, 2, 9, 10, and 11—collectively own 45.40% of the 2025 value owing to unrivalled access to multinational headquarters, luxury retail, and top medical facilities. The government’s USD 125.8 million Orchard Road flood-mitigation upgrade enhances asset durability, a feature prized by institutional landlords and family offices alike. Meanwhile, job creation from USD 9.99 billion semiconductor and biopharma investments funneled into the Core Central Region keeps leasing momentum elevated.
Sentosa Cove, though just minutes from the central mainland, offers a distinct resort environment with golf, marina, and beachfront assets that are impossible to replicate inland. Its 8.92% CAGR to 2031 leads all districts, supported by scarcity—foreigners cannot own landed property elsewhere without explicit government approval. Elevated plot lines and robust seawalls future-proof the enclave against sea-level rise, adding a layer of environmental security that many yacht-owning buyers value.
Peripheral upscale precincts such as Bukit Timah and Keppel Golf Course are being unlocked through timely GLS releases, injecting fresh luxury supply into green-rich corridors. Rail extensions like the Thomson-East Coast Line compress commute times to the CBD, improving these districts’ competitiveness. As a result, pricing gaps between core and fringe prime areas have narrowed, broadening the geographic spread of the Singapore luxury residential real estate market without eroding the CBD’s dominance.
Regulatory Landscape
Singapore's luxury residential market is operating under a tightening regime led by URA. Market cooling measures are anchored by the April 2023 Additional Buyer's Stamp Duty (ABSD) hike to 60% for foreigners, which directly affects buyer eligibility and demand in the high-end segment. The Government Land Sales (GLS) programme continues to channel supply through government-led land releases, while Master Plan 2025, gazetted in June 2025, sets the long-run land-use blueprint guiding prime-site allocations over the next 10 to 15 years.
In 2026, URA has added further discipline through enforcement tools. It implemented the Land Sales Disqualification Framework and a Sales Suspension Framework in May 2026 to deter severe errant developer behavior, raising the stakes around project delivery and sales conduct. In July 2026, URA issued revised AML/CTF guidance for developers' property sales, adopting a more risk-proportionate approach that increases the need for enhanced due diligence for higher-risk purchasers.
Value Chain Analysis
The Singapore luxury residential value chain runs from land origination, including GLS and selective en-bloc acquisitions, through development planning, construction and fit-out, marketing and sales, and then building operations and asset management. URA sets land-use parameters, while developers and consultants handle design, approvals, and product positioning for prime districts. Agencies and platform-led channels support lead generation and transactions, and the secondary market provides liquidity that underpins primary launch demand.
Execution risk concentrates in the approvals workflow and construction logistics. From 1 October 2025, CORENET X digital submission became mandatory for all new projects with GFA of at least 30,000 square metres, shifting coordination toward integrated digital delivery and increasing process discipline for compliance-driven timelines. On the physical supply chain, wider use of prefabrication and specialized imported finishes can expose luxury projects to logistics constraints, including limited off-site storage space for large prefabricated components reported in 2025, which can pressure schedules and handover sequencing in prime developments.
Competitive Landscape
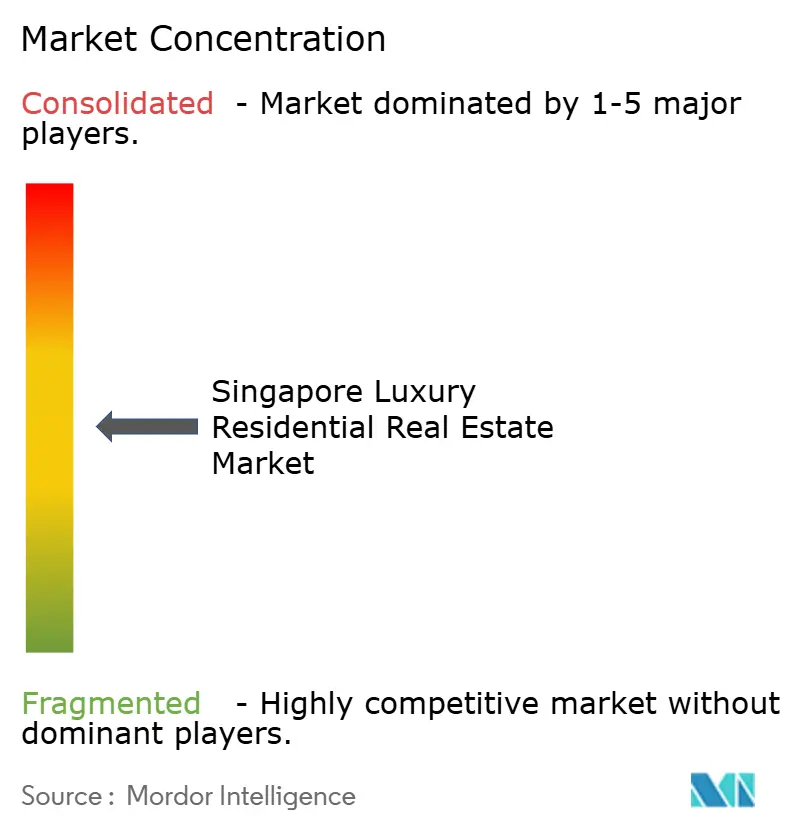
The Singapore luxury residential real estate market is moderately concentrated. Competition is intensifying as traditional incumbents face governance hiccups and digital disruptors. City Developments Limited (CDL) ceded its long-held leadership after internal succession issues diluted its pipeline focus. CapitaLand and Keppel Land quickly capitalised, accelerating premium launches that integrate hospitality, retail, and residential verticals for experiential upsell.
Sustainability has moved from a marketing tagline to a competitive necessity. Developers race to lock in Green Mark Super Low Energy ratings, embed onsite renewables, and secure green-financing tranches that shave interest margins. Keppel Land’s upcoming Marina projects, for example, target carbon-neutral operations from day one, attracting ESG-aligned investors.
Fintech-enabled models are also reshaping market power. Tokenisation platforms born under the MAS Project Guardian allow boutique developers to crowd-in global capital without bloating balance sheets. This levels the playing field: smaller firms can pre-fund projects via digital units while offering retail-style liquidity to global investors. Incumbents respond by forming joint ventures with technology providers to avoid market share erosion, making innovation partnerships as critical as landbank depth.
Singapore Luxury Residential Real Estate Industry Leaders
-
City Developments Limited (CDL)
-
CapitaLand Limited
-
Keppel Land Limited
-
GuocoLand Limited
-
Bukit Sembawang Estates Limited
- *Disclaimer: Major Players sorted in no particular order
Market Opportunities and Future Outlook
A key whitespace sits at the intersection of scarce prime land and an uneven new-launch cadence, where resale liquidity and repositioning of existing luxury stock can fill gaps when primary supply is thin. This shows up in 2026 conditions where Core Central Region luxury demand stayed active (353 luxury units priced at SGD 5 million or more sold in H1 2026), while new luxury home sales value fell sharply in Q2 2026 amid limited launches. For developers and marketers, the gap highlights an execution premium, since timing of releases and differentiation through design, amenities, and readiness for immediate occupation can influence conversion.
Technology-enabled delivery and compliance also create opportunity across the development, sales, and construction phases. The mandatory ramp-up of digital workflows, including CORENET X for large projects from October 2025, alongside wider adoption of digital tools and robotics (from about 20% by gross floor area in 2018 to about 70% in 2025) supports more standardized collaboration across consultants, contractors, and regulators. In July 2026, the Ministry of National Development and the Building and Construction Authority launched a two-year rental fee waiver for technology sandboxes to support construction tech firms and robotics adoption, which can provide practical on-ramps for developers and contractors to trial productivity tools and protect schedules and quality in high-spec luxury builds.
Recent Industry Developments
- May 2026: URA implements Land Sales Disqualification Framework to deter errant developer behavior and protect orderly prime-market development. The policy expands triggers for project disqualification and imposes more stringent consequences for sales misconduct, affecting timing and capital allocation in prime districts.
- April 2026: CapitaLand Investment secured a SGD 2.4 billion real estate investment mandate from Income Insurance to manage its direct real estate portfolio. The mandate expands third-party capital exposure and reinforces asset-management-led operating models across Singapore's prime portfolio.
- June 2025: The Urban Redevelopment Authority gazetted Master Plan 2025 as Singapore's official land use blueprint for the next 10 to 15 years. This codifies planning parameters that shape future prime-site availability and redevelopment potential, directly affecting luxury supply pipelines and the attractiveness of districts as new land parcels and intensification opportunities are formalized.
Research Methodology Framework and Report Scope
Market Definition and Coverage
For this study, we size luxury residential real estate in Singapore as the value of transactions and rentals for prime, high-end homes. The coverage includes new launches and resale activity, and we report the results in USD terms.
Scope exclusions: We exclude commercial real estate, public housing, and mass market private homes that do not meet the typical luxury positioning (location and finish) used in the report.
Segmentation Overview
- By Property Type
- Apartments & Condominiums
- Villas & Landed Houses
- By Business Model
- Sales
- Rental
- By Mode of Sale
- Primary (New-build)
- Secondary (Resale)
- By District
- Central Business District (CBD)
- Orchard Road
- Sentosa Cove
- Other Prime Districts
Data Sources, Market Sizing, and Validation
Desk Research
Desk research started with official datasets that describe the housing pipeline, resale conditions, and buyer composition in Singapore. We used public sources such as the Urban Redevelopment Authority (URA) for private residential price indexes and transaction indicators, the Singapore Land Authority for land supply signals, and the Department of Statistics Singapore for macro and household level context.
To interpret luxury demand and financing conditions, we also reviewed sources including the Monetary Authority of Singapore (MAS) for mortgage and policy signals, Inland Revenue Authority of Singapore (IRAS) guidance on stamp duties (including ABSD), and selected Singapore government budget and policy releases that shift housing rules over time. Company filings, investor presentations, and reputed press were used to cross-check launch timing, project mix, and observed pricing guidance, then a paid subscription covering company financials, patent databases, and news and financials was used selectively to tighten timelines and validate key assumptions. These examples are not exhaustive, and we also referred to other public sources for data collection, validation, and clarification.
Primary Interviews and Surveys
Primary work focused on converting listed transaction activity into an investable luxury value pool, where desk sources can miss parts of the flow. We spoke with developers and channel partners, brokerage leaders, property managers, and financing and legal professionals, and we also covered local and cross-border buyer perspectives to confirm price bands, deal pacing, and rental yield expectations across Singapore.
Distribution of primary research fieldwork respondents
| Company type | Respondent position |
|---|---|
| Top tier: 39% | CXOs: 12% |
| Mid tier: 44% | Functional/Unit leaders: 34% |
| Smaller Players: 17% | Managers: 54% |
Market-Sizing & Forecasting
We first built the market using a top down reconstruction that starts from private residential transaction and price signals. We then narrowed the pool to luxury stock and activity using prime district weightings, high value deal shares, and the split between new launches and resale. At the end of that flow, the market value is formed by applying inferred luxury average selling prices to estimated luxury unit volumes, and we added an aligned view of luxury rental value where leasing demand is material.
To keep the totals grounded, we used bottom up checks on a selective basis, including project level channel checks on launch pipelines, sampled price per square foot ranges by prime micro markets, and sanity checks against reported sales momentum by major developers and agencies. Inputs that mattered most included URA private residential price indexes, new launch and resale activity direction, observed luxury price per square foot progression, stamp duty and financing friction that shifts buyer behavior, foreign buyer participation trends, and vacancy and rental yield signals that influence hold versus sell decisions.
For forecasting, we relied mainly on scenario analysis tied to policy and rate paths. We anchored the scenario ranges using expert consensus from interviews on buyer sentiment, expected supply in prime districts, and likely rental absorption. Where bottom up visibility was patchy, such as off market deals, we handled gaps using conservative participation factors that were stress-tested with brokers and property managers before finalizing the time series.
Data Validation & Update Cycle
Validation was done through consistency checks so volumes, prices, and resulting value stayed aligned to observable market signals. We compared outputs against independent indicators such as price index direction, launch pipelines, and policy driven shifts in buyer mix, and we investigated any step changes before sign off.
A second analyst review was used to challenge assumptions that move the model most, including luxury price growth, prime district weightings, and the split between primary and secondary activity. The report is refreshed annually, and interim updates are triggered when there are material events such as stamp duty changes, sharp mortgage rate moves, or major shifts in prime supply. Before delivery, we run a fresh update pass so clients receive the latest view that reflects the most recent public releases and validated interview inputs.
Mordor Intelligence's Singapore Luxury Residential Real Estate Market Sizing Compared With Other Published Estimates
Published market values for Singapore luxury homes can look far apart because each publisher draws the line differently between prime residential, broader private housing, and luxury adjacent assets, and because they use different approaches to treat sales versus rental value. We also see gaps driven by how foreign buyer demand is modeled after policy changes and by how currency conversion timing is handled when numbers are presented in USD.
Some estimates combine a broader private residential value pool and then label a portion as luxury using a single price threshold. In addition, the treatment of resale and leasing can vary across years. In Mordor Intelligence, luxury is counted only when the unit falls into prime positioning, and the value pool is built across sales and rental with separate checks on ASP progression and transaction pace. This reduces over counting during policy driven slowdowns.
Benchmark comparison
| Source | Market Size | Gaps in Research Methodology |
|---|---|---|
| Mordor Intelligence | USD 10.18 B (2026) | |
| Industry Association A | USD 12.60 B (2026) | Uses a broader private residential value pool and applies a high price cut off without consistently filtering for prime district concentration, and rental value is blended with sales in a way that can double count turnover. |
| Regional Consultancy B | USD 8.90 B (2026) | Limits the scope mainly to new launch luxury projects and excludes a meaningful share of secondary market activity and prime rentals, and it applies conservative ASP growth that does not fully reflect prime price per square foot resets. |
The spread is mainly explained by whether the luxury definition is tied to prime positioning and by how resale and rental value are treated within the same year. By keeping the model traceable to transaction direction, prime pricing signals, and interview checked participation factors, we produce a number that can be repeated and updated when policy or supply conditions change.
Key Questions Answered in the Report
What is the current size of the Singapore luxury residential real estate market?
The Singapore luxury residential real estate market stands at USD 10.18 billion in 2026 and is projected to reach USD 14.57 billion by 2031.
How has the ABSD hike affected foreign demand?
The doubled 60% ABSD has reduced speculative foreign buying, yet long-term investors still transact when strategic or lifestyle priorities outweigh the cost.
Which district is growing the fastest?
Sentosa Cove leads with a forecast 8.92% CAGR through 2031 due to its waterfront lifestyle, limited supply, and climate-resilient positioning.
Are rentals becoming more popular in the luxury segment?
Yes. Rentals are projected to grow at 8.62% CAGR as newly arrived UHNWIs opt for flexible leasing before committing to ownership.
What role does tokenisation play in the market?
MAS’s Project Guardian supports platforms that fractionalise luxury units, allowing global investors and crypto-wealth holders to access prime assets with smaller tickets.
Why are landed houses outperforming in growth rates?
Limited supply, privacy, and larger living spaces have pushed landed houses to an 8.05% CAGR, outpacing high-rise counterparts despite a smaller base.