
Market Overview
| Study Period | 2020 - 2031 |
|---|---|
| Forecast Data Period | 2026 - 2031 |
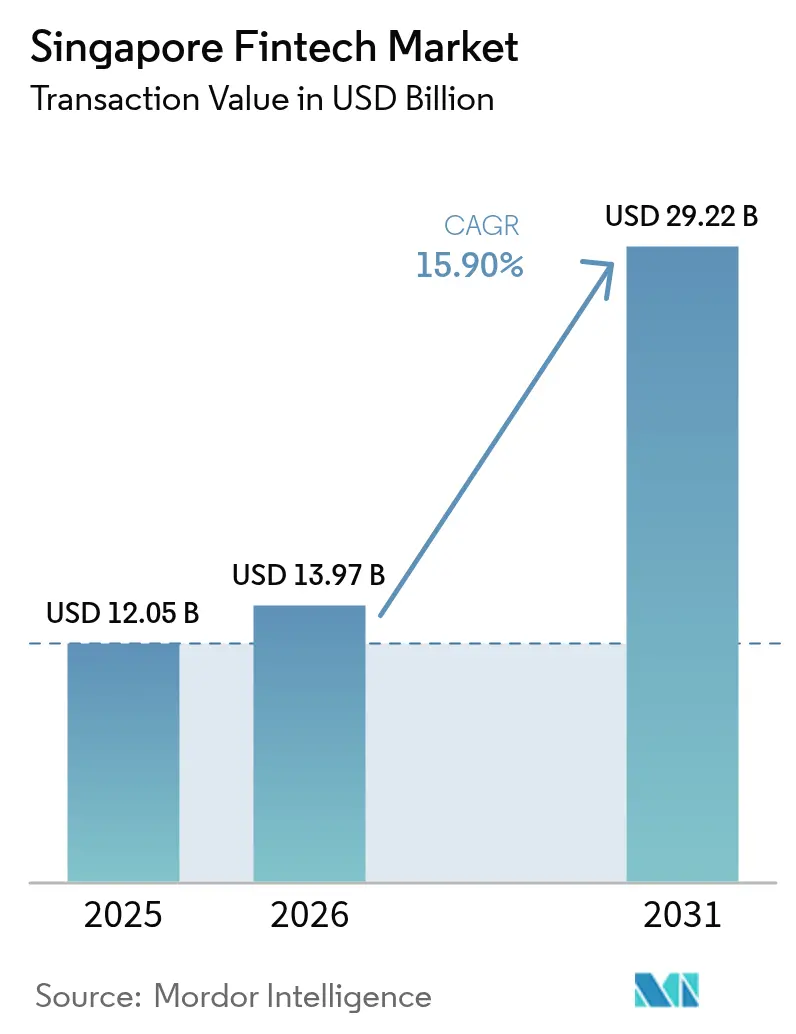
| Base Year Market Size (2025) | USD 12.05 Billion |
| Market Size (2026) | USD 13.97 Billion |
| Market Size (2031) | USD 29.22 Billion |
| Growth Rate (2026 - 2031) | 15.90% CAGR |
| Market Concentration | Medium |
Major Players *Disclaimer: Major Players sorted in no particular order Image © Mordor Intelligence. Reuse requires attribution under CC BY 4.0. | |
Singapore Fintech Market Analysis by Mordor Intelligence
Singapore fintech market size in 2026 is estimated at USD 13.97 billion, growing from 2025 value of USD 12.05 billion with 2031 projections showing USD 29.22 billion, growing at 15.9% CAGR over 2026-2031. Strong policy support, deep digital infrastructure, and sustained inflows of private capital keep the Singapore fintech market on a steep expansion path, even as competitive intensity and regulatory scrutiny increase. Market momentum reflects the Monetary Authority of Singapore’s (MAS) SGD 100 million (USD 77 million) FSTI 3.0 program, which co-funds quantum-safe cybersecurity and AI-driven risk models, giving early adopters a durable technology lead[1]Monetary Authority of Singapore, “Overview of Regulatory Sandbox,” MAS.GOV.SG. . Additional uplift comes from Project Nexus—the five-country instant-payment corridor that is scheduled to go live by 2026—which will compress settlement cycles and open new revenue pools for cross-border trade service providers. The Singapore fintech market also benefits from PayNow’s growing regional linkages, accelerating demand for multi-currency wallets among SMEs engaged in cross-border e-commerce. At the same time, tightened consumer-protection rules for crypto and buy-now-pay-later (BNPL) products temper near-term revenue growth, prompting business-model pivots toward embedded finance and B2B2C distribution.
Key Report Takeaways
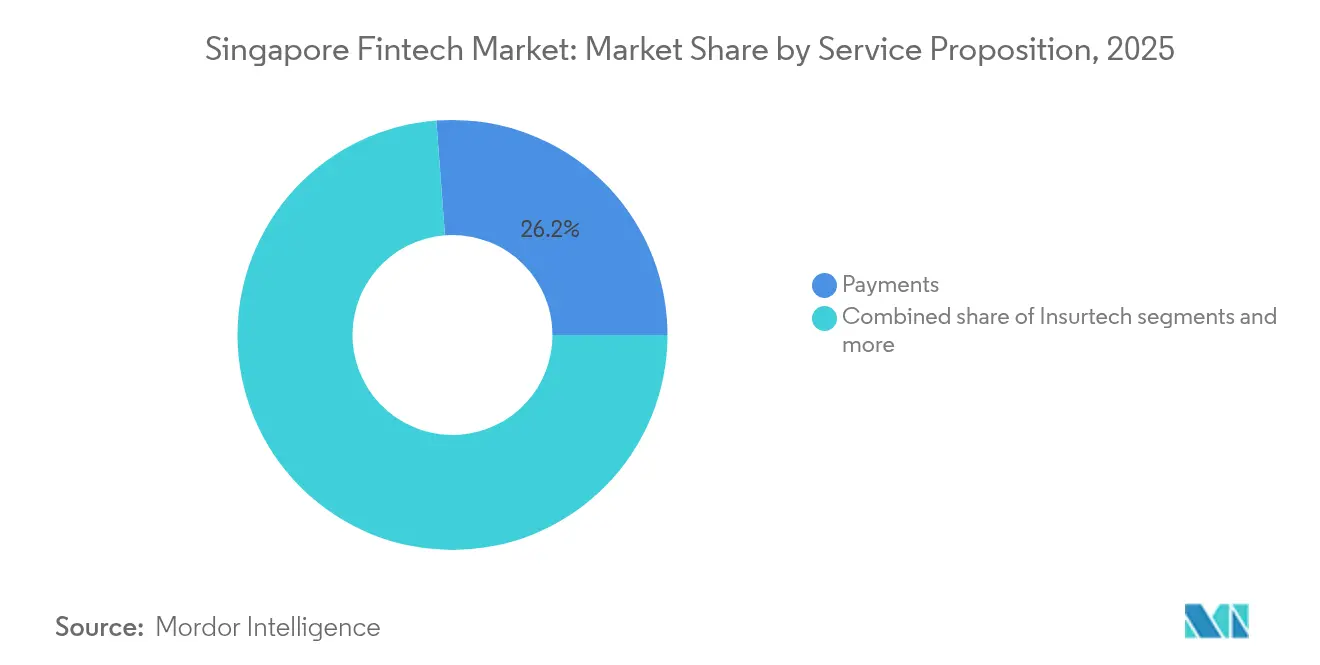
- By service proposition, payments accounted for 26.20% of the Singapore fintech market share in 2025, while the Singapore fintech market size for digital payments is projected to grow fastest at a CAGR of 16.95% between 2026 and 2031.
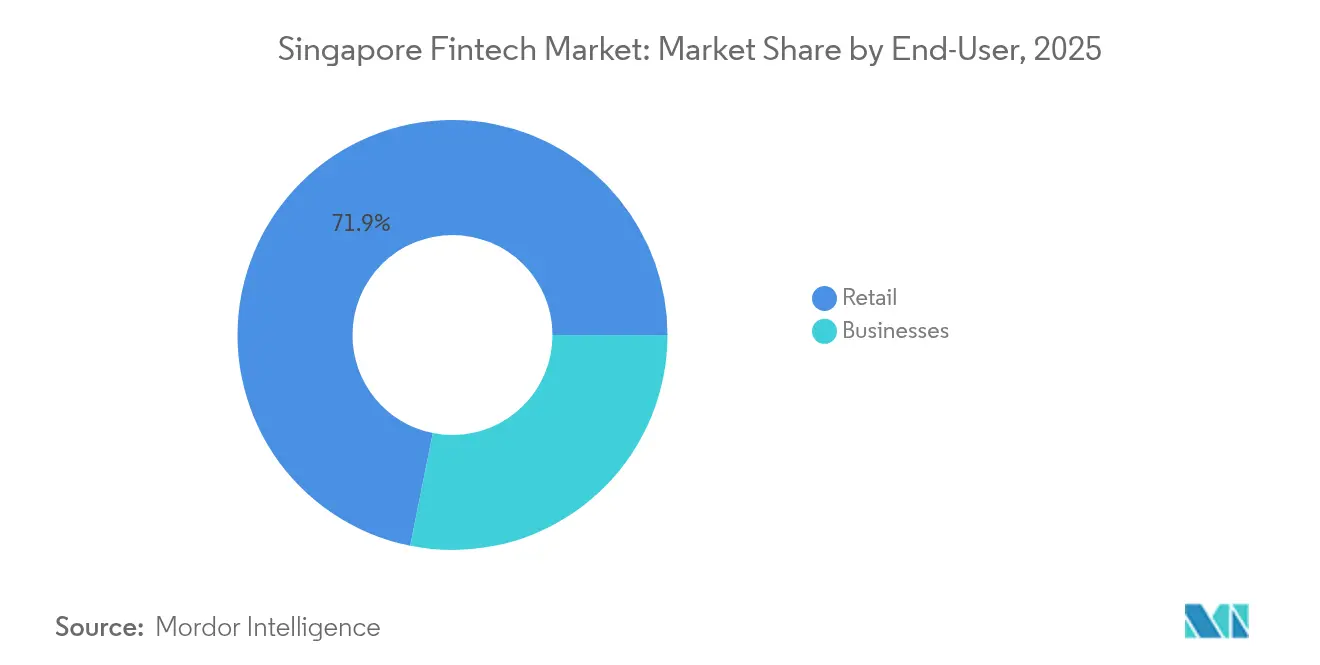
- By end-user, retail captured 71.85% of the Singapore fintech market share in 2025, with the Singapore fintech market size for business users expected to post the highest growth rate at 8.55% CAGR through 2031.
- By user interface, mobile apps held 69.10% of the Singapore fintech market share in 2025, while the Singapore fintech market size for POS/IoT devices is forecast to expand at a 13.38% CAGR during 2026–2031.
- By geography, the Central Region led with 34.10% of the Singapore fintech market share in 2025, while the Singapore fintech market size in the North-East Region is anticipated to grow at the fastest CAGR of 5.55% from 2026 to 2031.
Note: Market size and forecast figures in this report are generated using Mordor Intelligence’s proprietary estimation framework, updated with the latest available data and insights as of 2026.
Singapore Fintech Market Trends and Insights
Drivers Impact Analysis*
| Driver | ( ) % Impact on CAGR Forecast | Geographic Relevance | Impact Timeline |
|---|---|---|---|
| Rapid real-time payment rail adoption | +4.2% | Global, APAC focus | Medium term (2-4 years) |
| MAS grants spurring AI & quantum fintech | +2.8% | Singapore with APAC spillover | Long term (≥ 4 years) |
| Cross-border e-commerce & wallets | +1.9% | APAC, Southeast Asia concentration | Short term (≤ 2 years) |
| Digital-only banking licences | +1.1% | Singapore national | Medium term (2-4 years) |
| ESG-driven green-finance mandates | +0.9% | Global with Singapore leadership | Long term (≥ 4 years) |
| SME credit gap & alt-lending platforms | +0.8% | Singapore national, APAC expansion | Medium term (2-4 years) |
| Source: Mordor Intelligence | |||
Real-Time Payment Rails Transform Settlement Economics
Project Nexus will connect payment rails in Singapore, Malaysia, Thailand, the Philippines, and India by 2026, eliminating the need for nostro accounts and cutting settlement from T+2 to real-time [2]Monetary Authority of Singapore, “Project Nexus,” MAS.GOV.SG.. The shift frees up an estimated USD 120 billion in trapped liquidity and reduces cross-border transaction fees, generating immediate cost savings for merchants and SMEs. Early integrating fintech firms will gain share in B2B trade finance, where real-time settlement unlocks working-capital products tied to shipment milestones. PayNow’s bilateral links with PromptPay and DuitNow processed more than 2.5 million transactions in 2024, demonstrating proven customer appetite for instant regional payments. As rails converge, traditional banks must overhaul legacy APIs or risk ceding high-margin corridors to nimble challengers. The new infrastructure also supports micropayments and micro-insurance, widening addressable use cases across Southeast Asia.
Quantum-Ready Innovation Funding Accelerates Competitive Differentiation
Through FSTI 3.0, MAS co-funds up to 50% of projects deploying quantum-resistant encryption and AI-powered risk analytics[3]Monetary Authority of Singapore, “FSTI 3.0 Factsheet,” MAS.GOV.SG. . The subsidy lowers capex barriers for mid-tier fintechs, enabling them to harden cybersecurity stacks ahead of regulatory mandates. Collaboration inside the Cyber and Technology Resilience Experts (CTREX) panel ensures knowledge transfer from Microsoft, Amazon, and Google Cloud, aligning domestic standards with global best practices. Early movers already test quantum-safe payment protocols that withstand Shor-algorithm attacks, positioning them for compliance once post-quantum cryptography becomes compulsory. Banks adopting quantum-secure key exchange safeguard high-value treasury flows, giving Singapore a first-mover lead in safe-harbor financial hosting. Over the long term, quantum-enhanced optimization may also streamline credit-risk modelling and portfolio rebalancing, boosting sector productivity.
Cross-Border E-Commerce Growth Drives Multi-Currency Innovation
The ASEAN digital economy is projected to top USD 1 trillion by 2030, with cross-border transactions the fastest-expanding slice of that value pool. As sellers in Vietnam, Indonesia, and the Philippines list on Singapore-based platforms, demand for multi-currency wallets surges. Fintechs enable merchants to hold, pay, and hedge in local currencies, cutting FX spreads by up to 400 basis points versus traditional banks. Instant settlement improves supplier liquidity, while API-based invoicing accelerates order-to-cash cycles. MAS expanded the Payment Services Act to cover spot FX conversions, assuring consumer protection and guarding against hidden fees. The regulatory clarity supports further wallet innovation, including dynamic FX pricing and automated hedge triggers based on real-time inventory data.
Digital Banking Licenses Create Niche Market Opportunities
Singapore’s digital-bank regime requires licensees to serve underserved consumers and SMEs, opening profitable niches that incumbents long overlooked. GXS Bank targets gig-economy incomes with daily-interest savings accounts, while Trust Bank leverages NTUC’s membership base to cross-sell groceries and financial services. ANEXT Bank taps Ant Group’s underwriting engine to automate SME credit scores, compressing loan-origination cycles from weeks to hours. License caps on leverage and deposit exposure ensure system stability, yet still compel traditional banks such as DBS and OCBC to double down on digital reinvention. Open-banking APIs foster third-party integrations, letting merchants embed lending and insurance at checkout. Over time, digital-bank customer data will refine alternative credit models, further shrinking the SGD 20 billion (USD 14.70 billion) SME financing gap.
Restraints Impact Analysis*
| Restraint | ( ~) % Impact on CAGR Forecast | Geographic Relevance | Impact Timeline |
|---|---|---|---|
| High customer-acquisition costs | –2.1% | Singapore national, APAC spillover | Short term (≤ 2 years) |
| Tightened crypto & BNPL consumer protection | –1.4% | Singapore national | Medium term (2-4 years) |
| AI / cybersecurity talent shortages | –1.2% | Singapore national, regional rivalry | Long term (≥ 4 years) |
| Legacy core-bank integration barriers | –0.9% | Singapore national, APAC markets | Medium term (2-4 years) |
| Source: Mordor Intelligence | |||
Customer Acquisition Costs Strain Fintech Profitability Models
Nearly universal smartphone ownership produces a saturated addressable base, making marginal customer wins increasingly expensive. Incentive budgets for e-wallet sign-ups ballooned by 40–60% in 2024, pushing payback periods for small fintechs beyond 30 months. App fatigue further erodes return on marketing spend because consumers prefer multifunction super-apps such as Grab, which bundle ride-hailing, food delivery, and payments. The trend forces standalone providers to pivot toward embedded-finance partnerships, integrating services into merchant or platform ecosystems to share acquisition costs. B2B2C distribution also improves unit economics; SME software vendors, for example, can embed invoicing-linked credit lines, spreading marketing costs across multiple revenue streams. Elevated acquisition costs therefore act as a filtering mechanism, rewarding fintechs with strong ecosystems or differentiated IP, while pushing under-capitalized startups to consolidate or exit.
Regulatory Tightening Constrains High-Growth Fintech Segments
MAS clamped down on high-risk marketing tactics after 2024’s enforcement action that suspended Qoo10’s payment services over delayed merchant settlements. New rules cap BNPL late-payment fees and ban crypto cash-backs, trimming revenue margins for companies that relied on aggressive promotions. Updated AML/CFT guidelines demand enhanced transaction monitoring, raising compliance costs, especially for small-cap virtual-asset providers. Mandatory risk-disclosure statements lengthen onboarding flows, putting friction into user acquisition funnels. Stricter custodial requirements also sideline lightly regulated offshore exchanges, funneling volume toward licensed entities but narrowing product scope. While the measures strengthen systemic safety, they compress growth rates of previously breakneck segments, forcing a shift toward sustainable revenue models grounded in fee-based or subscription services.
*Our forecasts treat driver/restraint impacts as directional, not additive. The impact forecasts reflect baseline growth, mix effects, and variable interactions.
Segment Analysis
By Service Proposition: Payments Infrastructure Drives Market Leadership
In 2025, digital payments accounted for 26.20% of the Singapore fintech market size, reflecting their central role in day-to-day commerce. The segment is on track to expand at a 16.95% CAGR through 2031, propelled by SGQR+ interoperability, merchant SoftPOS adoption, and PayNow’s regional links. Card-rail bypass via account-to-account transfers reduces interchange fees, encouraging merchants to prioritize QR and instant payments. Meanwhile, alternative credit scoring in digital lending continues to unlock quick-turnaround microloans for gig workers, albeit at a slower growth than payments. Insurtech firms embed bite-sized coverage within ride-hailing and delivery apps, widening reach without requiring stand-alone policy purchases. Wealth-tech platforms such as StashAway scale on low-cost ETF portfolios, challenging private banks for mass-affluent assets. MAS’s regulatory sandbox supports experiments that bundle payments, lending, and insurance, fostering holistic financial offerings. By 2030, integrated platforms are expected to direct more than 40% of domestic retail transaction value, cementing payments as the linchpin of broader fintech ecosystems.
Competition intensifies as digital-wallet providers extend credit lines and insurance add-ons, blurring traditional segment boundaries. Super-apps leverage first-party consumption data to refine underwriting, while incumbents open APIs to retain relevance within merchant checkout flows. The Singapore fintech market, therefore, continues to reward providers that control the point of sale and can layer higher-margin, add-on services onto high-frequency payment use cases. Regulatory support for tokenized deposits and network tokenization further improves security and interchange economics. As real-time rails mature, payments revenue will increasingly derive from value-added data analytics, loyalty, and payment services rather than per-transaction fees.


By End-User: Business Segment Acceleration Signals B2B Opportunity
Retail customers remain the majority, holding 71.85% of the Singapore fintech market share in 2025, but growth has plateaued in basic deposits and payments. Businesses, especially SMEs, now represent the fastest-growing user group, projected at an 8.55% CAGR to 2031. The SGD 20 billion (USD 15.60 billion) funding gap leaves many SMEs underserved by traditional banks that struggle with collateral-light balance sheets. Alt-lenders deploy cash-flow-based scoring, granting approvals in under 48 hours, a service level unattainable for legacy lenders burdened by manual processes. B2B cross-border payments profit from Project Nexus’s real-time corridors, slashing supplier settlement costs and improving cash conversion cycles.
SMEs also adopt treasury APIs that reconcile invoices in real time, aiding cash-flow forecasting. Invoice-financing fintechs further monetize transaction data, pricing risk dynamically rather than relying on static collateral. For retail users, saturation in wallets and current accounts shifts innovation toward wealth and insurance; robo-advisors now bundle term-life policies alongside ETF portfolios to widen wallet share. Forward-looking analytics recommend savings goals and automated round-ups, deepening engagement. Conversely, evolving privacy norms and MAS’s data-governance guidelines restrict unchecked data monetization, prompting platforms to emphasize consent-driven personalization.
By User Interface: POS/IoT Devices Emerge Through Merchant Innovation
Mobile applications controlled 69.10% of the Singapore fintech market size in 2025, sustained by near-universal smartphone usage and mature app ecosystems. However, POS/IoT devices are the breakout channel, forecast to climb at a 13.38% CAGR to 2031 as merchants embrace SoftPOS and sensor-based payments. Solutions from NETS, FOMO Pay, and 2C2P turn Android phones into contactless terminals, eliminating hardware costs for small retailers. IoT integration enables invisible payments at parking gates, vending machines, and smart buildings, elevating user convenience.
Web portals still serve complex, high-value B2B transactions that demand audit trails and bulk upload features. Yet browsers increasingly operate as control centers for API configuration, with the transaction front-end shifting to in-context touchpoints such as ERP systems or chatbots. MAS’s Technology Risk Management guidelines stress end-to-end encryption and secure element usage in SoftPOS deployments, safeguarding consumer data. As the line between interface and embedded layer blurs, customer experience hinges on latency, uptime, and context relevance rather than visual design. Providers optimizing for sub-200-millisecond transaction processing will capture share among merchants whose revenue depends on checkout speed.
Geography Analysis
The Central Region held 34.10% of the Singapore fintech market share in 2025, anchored by the downtown core that hosts MAS, global banks, and dense fiber connectivity. Ultra-low latency links attract high-frequency traders and data-rich fintechs that co-locate servers within proximity to hosting sites. Shared regulatory offices streamline licensing conversations, cutting time-to-market for new product launches. East Region’s airport-centric economy funnels steady demand for multi-currency wallets and duty-free payments, while its logistics hubs drive adoption of supply-chain finance solutions.
North-East Region enjoys the fastest CAGR at 5.55%, catalysed by Punggol’s digital district, where test beds for 5G, IoT, and edge data centers lower barriers for deep-tech startups. Residential demographics skew younger and more tech-savvy, producing early adopters for pilot deployments of wallet-linked wearables and biometric login. West and North Regions grow steadily as industrial estates modernize payment workflows and implement ESG-aligned carbon-credit exchanges. Across all regions, government-backed 5G densification supports pervasive connectivity, enabling fintech operators to deliver consistent user experiences city-wide.
Regulatory Landscape
The Monetary Authority of Singapore (MAS) is the primary regulator shaping fintech activity through licensing, supervision, and innovation pathways such as the MAS Regulatory Sandbox, alongside enforcement of consumer protection and AML/CFT requirements across payments, lending, and digital asset services. A key legislative pillar is the Financial Services and Markets Act 2022 (FSMA), implemented in phases, with Phase 3 commencing on June 30, 2025 to introduce a regulatory framework for digital token service providers operating from Singapore.
Regulatory focus has shifted further toward technology governance and operational resilience. In 2026, MAS issued a consultation proposing amendments to Technology Risk Management (TRM) Notices to strengthen IT resilience, including capacity planning and immutable data backups. MAS and industry partners also published the Safeguards for Agentic Finance at Runtime (SAFR) white paper (July 2026), which formalizes governance checkpoints for AI agents used in financial services. On payments infrastructure, MAS and the Association of Banks in Singapore (ABS) launched the PayNow Generation 2 study (June 2026), indicating continued upgrades to national instant payments and interoperability requirements for participant institutions.
Value Chain Analysis
Singapore's fintech value chain begins with core enablers including MAS policy programs (innovation and supervisory frameworks), national payment rails (PayNow and related QR and instant-payment interoperability), cloud and cybersecurity infrastructure, and digital identity and data-sharing capabilities. Product and solution creation is led by banks and licensed fintechs across payments, digital lending, wealth-tech, and insurtech, supported by regtech, risk analytics, and AI model governance tooling as compliance and technology risk requirements expand.
Go-to-market and distribution rely on merchant acquirers and aggregators, super-app ecosystems, SME software and ERP integrations, and Banking-as-a-Service partnerships that allow non-banks to embed regulated services. Trade and B2B flows increasingly link to shared data utilities such as SGTraDex, which connects physical, information, and financial flows in trade, while banks such as DBS and UOB provide digital supply chain financing modules integrated into corporate workflows. Common bottlenecks include onboarding friction from AML/CFT, legacy bank integration constraints, and rising operational demands tied to technology risk management, which is pushing fintechs toward partnerships with licensed entities and standardized API connectivity.
Competitive Landscape
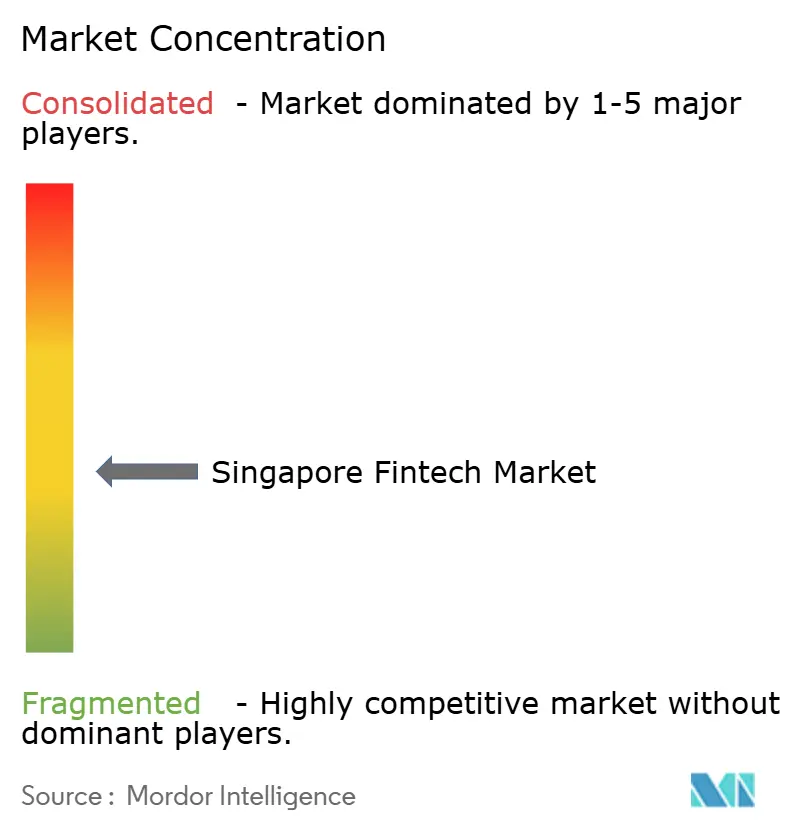
The Singapore fintech market shows a moderate level of concentration, with the leading five players holding a significant portion of the market, while still leaving ample room for niche and specialist providers to emerge. Grab Financial Group has capitalized on its super-app model, successfully converting its ride-hailing and food delivery user base into digital wallet customers. Meanwhile, DBS Bank has maintained a strong position by expanding its digital wealth management services and seamlessly integrating real-time payment solutions into its corporate banking offerings. These dynamics highlight the strength of ecosystem-driven strategies and the growing importance of integrated financial services. The market remains competitive, offering opportunities for both established players and innovative entrants. OCBC, UOB, and FOMO Pay round out the top tier, each focusing on distinct niches such as SME lending or merchant acquiring.
Competitive pressure centers on technology differentiation and compliance execution. Firms that operationalize MAS’s data-governance guidelines and quantum-safe encryption gain institutional trust, a key advantage when courting enterprise clients. Quantum-ready security also attracts foreign asset managers seeking a safe jurisdiction for regional hubs. Startups without deep compliance budgets partner with licensed entities under Banking-as-a-Service frameworks, trading margin for speed-to-market.
M&A activity accelerates as customer-acquisition costs soar; 2025 has already seen mid-tier robo-advisor MoneyOwl exit, while Syfe turned profitable by cross-selling insurance and pension products. Investors now prioritize path-to-profitability metrics, steering capital toward embedded-finance plays that monetize existing traffic rather than burning cash on standalone apps. Across the board, firms capable of leveraging real-time payments, AI-driven underwriting, and ESG-linked instruments are best positioned to compound growth within the Singapore fintech market.
Singapore Fintech Industry Leaders
Grab Financial Group (GrabPay, GrabFin)
DBS Bank (DBS PayLah!, digibank)
Wise
Funding Societies
Singlife with Aviva
- *Disclaimer: Major Players sorted in no particular order

Market Opportunities and Future Outlook
Institution-building and infrastructure upgrades are creating room for fintechs that can package AI governance, programmable money, and instant-payment interoperability into enterprise-grade offerings. MAS established the Future of Finance Institute in June 2026 as a national innovation center to build capabilities in AI, tokenisation, and programmable money. The SAFR framework (July 2026) also lays out practical checkpoints for deploying AI agents in financial services, which supports demand for compliance-by-design tooling, auditability, and runtime controls across banks and regulated fintechs.
Payments and cross-border commerce remain a key opportunity area as national and regional rails evolve from connectivity into richer data and feature sets. The PayNow Generation 2 study (June 2026) and ongoing implementation of Project Nexus create scope for value-added layers such as request-to-pay, merchant and SME cash-flow services, and reconciliation automation embedded into business software. In digital assets, MAS consultations in 2026 on the prudential treatment for cryptoassets on permissionless blockchains, alongside the FSMA rollout framework for digital token service providers, point to product development that prioritizes risk controls, custody, and institutional workflows over retail-led promotion. On funding and scaling, additional commitments to Startup SG Equity and an anchor fund aimed at facilitating exits from 2026 reinforce a pipeline for growth-stage fintechs, particularly those focused on infrastructure-heavy, compliance-intensive segments.
Recent Industry Developments
- July 2026: Grab completed its acquisition of Stash Financial, Inc., taking 100% equity ownership of the U.S. digital financial services company. The deal broadened Grab Financial Group's product depth beyond payments toward digital investing and wealth-linked services, supporting cross-sell within the super-app ecosystem.
- March 2026: GrabInsure launched motor insurance tailored for private-hire vehicle drivers in Singapore, with pricing linked to driving performance. The product expanded embedded insurance use cases inside mobility platforms, tightening the linkage between transactional data and underwriting.
- February 2026: DBS announced a partnership with Granite Asia and closed a USD 110 million AI IPO fund as part of broader efforts to develop AI-enabled investment and financing solutions. The move signaled continued bank-led innovation in wealth and capital markets tooling, increasing competitive pressure on standalone wealth-tech platforms to differentiate through distribution and product specialization.


Research Methodology Framework and Report Scope
Market Definition and Coverage
For this methodology, the market covers fintech activity in Singapore where technology is used to deliver financial services, and revenue is tied to enabling transactions, accounts, lending, investing, insurance, and related digital financial workflows.
Scope exclusions: Pure IT outsourcing, generic software development, and non-financial consumer apps are excluded when they do not directly enable a financial service outcome.
Segmentation Overview
- By Service Proposition
- Digital Payments
- Digital Lending & Financing
- Digital Investments
- Insurtech
- Neobanking
- By End-User
- Retail
- Businesses
- By User Interface
- Mobile Applications
- Web / Browser
- POS / IoT Devices
- By Geography
- Central Region
- East Region
- North Region
- North-East Region
- West Region
Data Sources, Market Sizing, and Validation
Desk Research
Desk research was used to establish the factual base for Singapore, then translate it into a workable demand-and-supply view for fintech revenues. We reviewed public regulatory and ecosystem materials, such as Monetary Authority of Singapore publications, Singapore Department of Statistics releases, and datasets shared by Enterprise Singapore, so the model reflects local market realities.
To make inputs usable, we also scanned sources such as the World Bank and IMF for macro indicators, along with association and ecosystem references, such as the Singapore FinTech Association and similar public directories, for counts and activity signals. Company filings, investor presentations, and reputable press coverage helped us sense-check business models and monetization paths. Where needed, a paid subscription database was used only for company financials, patent checks, and news screening. These examples are not exhaustive, and many other public sources were used for collection, validation, and clarification.
Primary Interviews and Surveys
Primary work was done through expert interviews and structured surveys with fintech operators, regulated entities, ecosystem enablers, and buyers of fintech solutions, so we could confirm what is monetized in practice versus what stays as pass-through value. We tested assumptions on pricing logic, channel mix, adoption pace, and compliance-driven constraints, and then revisited areas where desk research signals did not align across sources. The respondent feedback also clarified how Singapore-specific implementation constraints affected how quickly products move from pilot to revenue generation.
Distribution of primary research fieldwork respondents
| Company type | Respondent position | Region |
|---|---|---|
| Top tier: 25% | CXOs: 14% | |
| Mid tier: 56% | Functional/Unit leaders: 41% | |
| Smaller Players: 19% | Managers: 45% |
Market-Sizing & Forecasting
Sizing starts from a top-down build where Singapore-level demand pools are reconstructed using payments and transfer activity, digital account usage, credit origination intensity, and investing and insurance participation signals, and then converted into revenue using realistic take-rate ranges. Once the total is formed, we corroborate it using selective bottom-up approximations like sampled provider revenue bands, channel checks across retail versus business buyers, and a few ASP-by-volume sanity checks where data is available.
Key model inputs include indicators such as digital payment usage and transaction momentum, lending and financing product uptake, user interface shifts (mobile versus web and assisted points), and the pace of adoption across retail and business customers. In the forecast, changes in regulation and consumer protection rules were treated as measurable modifiers to adoption speed, followed by adjustments to take rates where pricing pressure was discussed by interviewees. For forecasting, scenario analysis was used so the base case could be stress-tested against faster adoption and slower monetization paths, and the final trajectory was aligned back to expert expectations gathered in primary research. When bottom-up signals had gaps, we used conservative interpolation anchored to observed revenue patterns rather than filling with aggressive growth assumptions.
Data Validation & Update Cycle
Outputs were validated through triangulation across independent signals, including macro checks, regulatory timelines, and cross-checks between transaction activity and implied revenue pools. We looked for anomalies like sudden step-changes in implied take rates, unusual year-to-year jumps, and inconsistencies between adoption indicators and projected monetization, and then revisited assumptions with follow-up calls when needed.
Before sign-off, the model and assumptions go through multiple review steps so calculation logic, unit consistency, and scope interpretation stay stable across updates. Reports are refreshed annually, with interim updates triggered by material events such as major regulatory shifts or notable demand shocks. Right before delivery, we run a fresh update pass so clients receive the latest view available at that time.
Mordor Intelligence's Singapore Fintech Market Size Versus Other Published Estimates
Published figures for Singapore fintech can vary widely because the underlying number is not always measuring the same thing, even when the title looks similar. Differences usually come from what is counted as fintech value, whether the figure represents revenue or investment value, and how pass-through transaction amounts are treated.
Total investment value and funding activity are commonly mixed into market sizing in public commentary, and some estimates also blend fintech revenue with broader financial services digitalization. Payment and transfer flows, take-rate assumptions, and currency timing can also shift the headline number up or down, especially when the refresh cadence is not aligned to the same base year.
Benchmark comparison
| Source | Market Size | Gaps in Research Methodology |
|---|---|---|
| Mordor Intelligence | USD 12.05 B (2025) | |
| Industry Blog A | USD 5.50 B (2025) | Likely reflects a narrower view of fintech value, with limited clarity on whether revenues are counted across all fintech services or only a few demand drivers such as payments and remittances. |
| Insights Article B | USD 0.91 B (2024) | The metric is not clearly defined (revenue versus funding or another value measure), and the base year differs, which can understate size when compared to a revenue-based, service-wide market build. |
Funding totals and investment value sit outside Mordor Intelligence's scope, which helps explain why revenue-led sizing lands far from figures that appear to be capital flow based. Across the table, the most consistent gap drivers are unclear metric definitions and mixed scopes, and those are reduced when sizing is anchored to observable usage signals and explicit take-rate logic.


Key Questions Answered in the Report
What is the 2026 value of the Singapore fintech market?
The Singapore fintech market size was USD 13.97 billion in 2026.
How fast will digital payments grow in Singapore?
Digital payments are projected to record a 16.95% CAGR between 2026 and 2031, the highest among service categories.
Which user group is expanding the quickest?
Business users, led by SMEs, are expected to grow at an 8.55% CAGR through 2031 as alternative lending and real-time payments gain traction.
Why is the North-East Region a high-growth area?
Punggol’s digital district, lower rents, and smart-infrastructure pilots support a 5.55% CAGR, the fastest regional pace to 2031.
What role does MAS play in sector growth?
MAS drives innovation with FSTI 3.0 grants, post-quantum security standards, and instant-payment corridors that lower settlement costs.
Page last updated on:






