| Study Period | 2018 - 2030 |
| Base Year For Estimation | 2024 |
| Forecast Data Period | 2025 - 2030 |
| Market Volume (2025) | 1.02 Thousand MW |
| Market Volume (2030) | 1.16 Thousand MW |
| CAGR | 2.48 % |
| Market Concentration | Low |
Major Players*Disclaimer: Major Players sorted in no particular order |

Singapore Data Center Market Analysis
The Singapore Data Center Market size is estimated at 1.02 thousand MW in 2025, and is expected to reach 1.16 thousand MW by 2030, growing at a CAGR of 2.48%. Further, the market is expected to generate colocation revenue of USD 1,068.8 Million in 2025 and is projected to reach USD 1,599.3 Million by 2030, growing at a CAGR of 8.40% during the forecast period (2025-2030).
Singapore's data center industry is undergoing a significant transformation driven by sustainability imperatives and energy efficiency concerns. Currently, data centers account for approximately 7% of Singapore's total electricity consumption, with projections indicating this could rise to 12% by 2030. Leading operators are actively implementing innovative solutions to address these challenges, as exemplified by STT GDC's achievements in improving their Power Usage Effectiveness (PUE) by 4% and Water Usage Effectiveness (WUE) by 18% in 2022. The industry is witnessing increased adoption of district cooling systems and Power Purchase Agreements (PPAs) as operators strive to balance growing demand with environmental responsibility.
The market is experiencing robust data center growth in the startup ecosystem, which is driving demand for data center services. As of 2022, eleven Singapore-based startups achieved unicorn status, bringing the total to twenty-two. This growth is further evidenced by the 517 deals recorded in the first nine months of 2022, amounting to SGD 11.35 billion in total funding, according to Enterprise Singapore. The surge in startup activity has created increased demand for scalable and flexible data center solutions, particularly in the wholesale and hyperscale segments.
Digital transformation across industries is reshaping the data center market landscape, with a particular focus on advanced manufacturing and innovation hubs. A notable development is the establishment of the Hyundai Motor Group Innovation Center in Singapore (HMGICS), which serves as a testbed for Industry 4.0 technologies including robotics, 5G, artificial intelligence, and IoT. The facility exemplifies Singapore's commitment to becoming a leading smart manufacturing hub, driving increased demand for high-performance computing and data processing capabilities.
The market is characterized by a strong focus on operational excellence and technological advancement, particularly in cooling technologies and infrastructure efficiency. Industry players are actively exploring innovative cooling solutions, including the use of cold energy from the Singapore LNG Terminal and the development of floating data center parks that utilize seawater for cooling. These initiatives align with the government's strict infrastructure norms for new data centers, implemented following the lifting of the moratorium. Additionally, the digital maturity of businesses continues to evolve, with 54% of SMEs at the starter level of digital maturity in 2022, indicating significant potential for future growth in data center services demand.
Singapore Data Center Market Trends
Growing application of connected devices and smart homes to boost the market demand
- The country has a smaller population compared to other Southeast Asian countries, owing to which the number of smartphone users is comparatively lesser than the rest.
- The country is expected to grow significantly and reach 6.21 million users by 2029, from 5.4 million users in 2022.
- According to Hootsuite, the country has a 100% urbanized population with 8.7 million cellular mobile connections, accounting for 147% of the population. This data suggests that each citizen in the country owns more than one cellular device. The growing application of connected devices and smart homes also boosted the demand for digital data and increased network traffic. Such factors are anticipated to increase the number of smartphone users in the country.

Understand The Key Trends Shaping This Market
Download PDF
Singtel's expanding 5G network in partnership with Ericsson boost the data center demand
- Singapore was one of the early adopters of the 5G network in 2020, while the presence of 2G was decommissioned as early as 2016. As of 2022, 4G dominated the market with 49.7 Mbps, while its speed is expected to reach 54.75 Mbps by 2029.
- The country's 5G network is booming and is expected to reach 946.04 Mbps by 2029. 5G networks and services are expected to form the backbone of growth in the telecom sector over the coming years as service providers seek new ways to engage customers in a market that is otherwise already saturated.
- Singtel is ramping up its 5G standalone (SA) deployment in Singapore by expanding the network and developing new 5G use cases in partnership with Ericsson. In a press release, the Swedish vendor stated its plans to power Singtel’s 5G SA network with 5G radio access products and cloud-native dual-mode 5G Core network solutions. In September 2021, Singtel confirmed that its 5G network covers over two-thirds of Singapore. New 5G sites were added in densely populated areas like Choa Chu Kang, Punggol, Sembawang, and Tampines.

OTHER KEY INDUSTRY TRENDS COVERED IN THE REPORT
- 13.3 GB per month and growing would drive the data centers market
- Growing demand for the bandwidth, FTTH penetration, and Government initivatives to develop fiber Deployment drives the growth of the market
- Transition to Fiber and roll out of fiber optic cables nationwide trends boost the market demand
Segment Analysis: Data Center Size
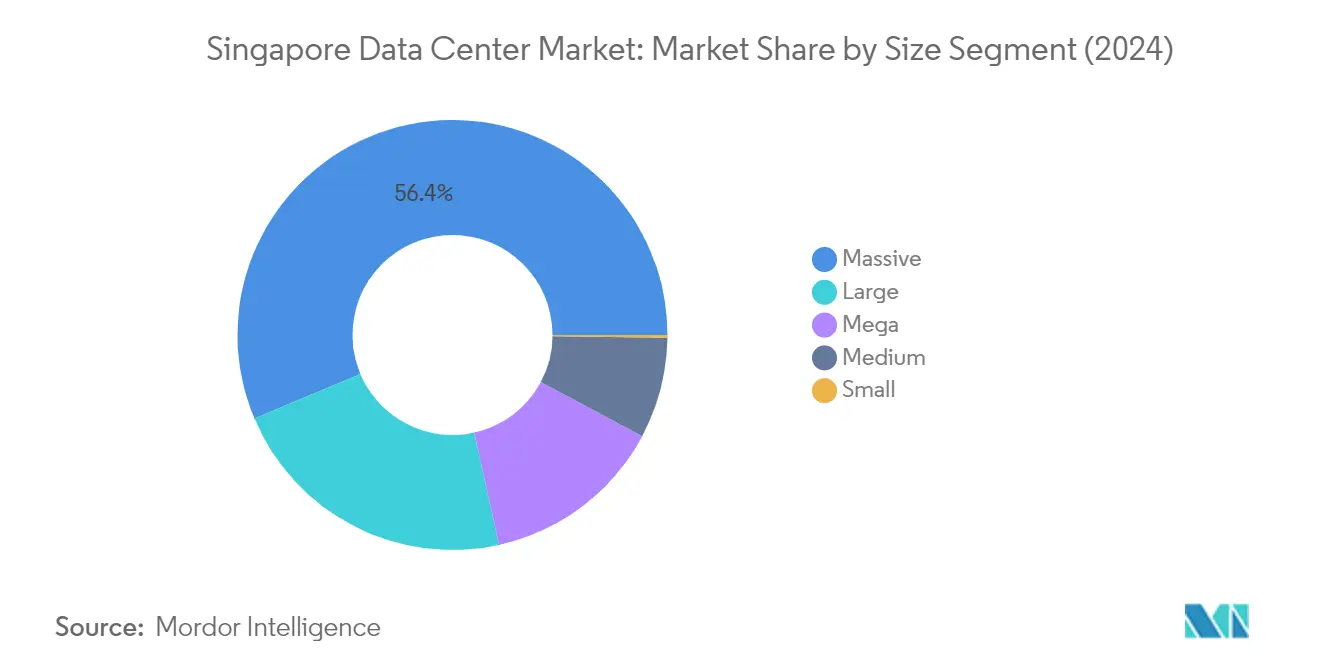
Massive Segment in Singapore Data Center Market
The massive data center segment dominates the Singapore data center market, commanding approximately 56% data center market share in 2024. With an IT load capacity of around 496 MW, massive data centers are primarily concentrated in West Singapore, which hosts over 40% of these facilities, followed by East Singapore and the rest of Singapore with 30% each. Leading operators like Equinix Inc., Keppel Data Center, and STT GDC Pte Ltd are actively expanding their massive data center footprint in the region, with plans to launch new facilities having IT load capacities ranging from 27 MW to 56 MW. The segment's dominance is further strengthened by local governments offering various incentives and benefits related to tax, electricity, and land costs.
Small Segment in Singapore Data Center Market
The small data center segment is projected to demonstrate the most robust growth in the Singapore data center market from 2024 to 2029, with an expected CAGR of approximately 31%. This remarkable growth trajectory is primarily driven by the increasing adoption of edge computing and the need for localized data processing capabilities. Currently, Singapore has one small data center owned by INAP, but the segment is poised for expansion with Keppel Data Center's plans to construct new small facilities in various regions of Singapore. Despite the growing popularity of 5G technology driving demand for massive and mega data centers, small data centers are finding their niche in serving specific industry requirements and edge computing needs.
Remaining Segments in Data Center Size
The remaining segments in the market include mega, large, and medium data centers, each serving distinct market needs. Mega data centers are particularly significant in East Singapore, catering to hyperscale requirements and large-scale cloud operations. Large data centers maintain a strong presence across all regions, offering balanced capabilities for enterprise-level requirements. Medium data centers, predominantly concentrated in West Singapore, serve specific industry verticals with specialized needs. These segments collectively contribute to Singapore's diverse data center ecosystem, ensuring comprehensive coverage of various business requirements and technological demands.
Segment Analysis: Tier Type
Tier 3 Segment in Singapore Data Center Market
The Tier 3 segment dominates the Singapore data center market, commanding approximately 69% market share in 2024. This significant market presence is attributed to the segment's optimal balance between reliability and cost-effectiveness, making it particularly attractive for enterprise-level deployments. The majority of Tier 3 data centers in Singapore are concentrated in East Singapore, which hosts nearly 48% of these facilities, followed by the rest of Singapore at 23% and West Singapore at 29%. Major players like Keppel Data Center and STT GDC Pte Ltd are actively expanding their Tier 3 certified facilities across these regions, with four new data center facilities currently under construction built to Tier 3 standards.
Tier 4 Segment in Singapore Data Center Market
The Tier 4 segment is experiencing the most rapid growth in the Singapore data center market, projected to grow at approximately 13% during 2024-2029. This remarkable growth trajectory is driven by increasing demands for fault-tolerant infrastructure and the highest levels of data center reliability. The segment's expansion is further supported by Singapore's focus on efficient data center operations, with operators investing in modern infrastructure and cooling techniques. Companies like STT GDC Pte Ltd, Equinix Inc., and Digital Realty Trust are leading this growth with their Tier 4 certified facilities, while other major players like Equinix Inc. and NTT Communication are planning to construct new mega data centers with Tier 4 certification.
Remaining Segments in Tier Type
The Tier 1 & 2 segment represents the basic level of data center infrastructure in Singapore's market. While these facilities offer lower redundancy levels compared to their higher-tier counterparts, they continue to serve specific market niches where cost-effectiveness takes precedence over advanced reliability features. These facilities are primarily concentrated in East and West Singapore, catering to businesses with less demanding uptime requirements or those using these facilities as secondary backup locations. The segment maintains its relevance in the market by offering more economical solutions for small and medium enterprises that don't require the advanced features of higher-tier facilities.
Segment Analysis: Absorption
Utilized Segment in Singapore Data Center Market
The utilized segment dominates the Singapore data center market, accounting for approximately 84% of the total IT load capacity in 2024, equivalent to around 737 MW. This segment's strong performance is driven by increasing data center facilities' occupancy rates and the onboarding of additional firms across various industries. The segment is projected to maintain its growth momentum with an expected growth rate of nearly 5% during 2024-2029, driven by the relocation of cloud hyperscale data centers and the expanding e-commerce market. Singapore's position as a significant e-commerce hub in Asia, with more than 3 million e-commerce users and the largest shopping cart size among Southeast Asian countries at USD 67.40, continues to fuel the demand for utilized data center capacity. The high internet penetration rate of 98%, smartphone penetration rate of 93%, and online purchase rate of 58% of residents further necessitate the usage of more servers, contributing to the segment's dominance and growth trajectory.
Non-Utilized Segment in Singapore Data Center Market
The non-utilized segment represents the remaining portion of Singapore's data center market, showing a declining trend as data center operators focus on maximizing efficiency and utilization rates. This segment plays a crucial role in maintaining operational flexibility and allowing for future expansion capabilities within existing facilities. Data center operators are implementing sophisticated capacity planning strategies and advanced infrastructure management systems to optimize the balance between utilized and non-utilized capacity. The segment serves as a buffer for rapid scaling requirements, particularly important for hyperscale facilities and cloud service providers who need to maintain headroom for unexpected demand surges. Additionally, the non-utilized capacity helps facilities maintain optimal performance levels and provides the necessary space for implementing new technologies or upgrading existing infrastructure without disrupting ongoing operations.
Singapore Data Center Industry Overview
Top Companies in Singapore Data Center Market
The data center market in Singapore is characterized by continuous innovation and strategic expansion initiatives by major players. Data center companies in Singapore are increasingly focusing on sustainable operations by implementing carbon monitoring frameworks and improving Power Usage Effectiveness (PUE) metrics across their facilities. Operational excellence is being pursued through advanced cooling technologies, including district cooling systems and innovative building-integrated photovoltaic panels. Strategic partnerships with technology providers and cloud service aggregators have become commonplace to enhance service offerings. Market leaders are actively expanding their footprint through new facility constructions, particularly in emerging business districts, while simultaneously upgrading existing infrastructure to meet growing demand. The industry is witnessing a shift toward green data centers, with companies investing in renewable energy sources and implementing energy-efficient technologies to align with Singapore's sustainability goals.
Market Dominated by Global Infrastructure Specialists
The Singapore data center market exhibits a relatively concentrated structure dominated by established global infrastructure providers and telecommunications companies. These major players leverage their extensive experience, technical expertise, and robust financial capabilities to maintain their market positions. Local players, while present, primarily operate in specialized niches or serve specific industry segments. The market demonstrates a high barrier to entry due to substantial capital requirements, technical complexity, and stringent regulatory compliance needs.
The competitive landscape is characterized by strategic collaborations and partnerships rather than aggressive acquisition activities. Companies are focusing on organic growth through facility expansions and technology upgrades rather than inorganic growth through mergers and acquisitions. The market structure encourages specialization, with players differentiating themselves through service quality, technological innovation, and customer support capabilities. International players continue to strengthen their presence by establishing regional headquarters and expanding their operational footprint in Singapore, recognizing its strategic importance as a digital hub in the Asia-Pacific region.
Innovation and Sustainability Drive Future Success
Success in the Singapore data center industry increasingly depends on companies' ability to balance operational efficiency with environmental sustainability. Market leaders must focus on developing innovative cooling solutions, implementing advanced power management systems, and investing in renewable energy sources to maintain their competitive edge. The ability to offer customized solutions for different industry verticals while maintaining high reliability and security standards will be crucial. Companies need to develop strong relationships with cloud service providers and establish robust interconnection capabilities to enhance their value proposition.
For new entrants and smaller players, success lies in identifying and serving underserved market segments or specialized industry needs. Developing expertise in emerging technologies such as edge computing and artificial intelligence infrastructure could provide opportunities for market differentiation. Companies must also navigate the evolving regulatory landscape, particularly regarding energy consumption and environmental impact. Building strong relationships with local authorities and demonstrating commitment to Singapore's sustainability goals will be essential for long-term success. The ability to adapt to changing customer needs while maintaining cost competitiveness will be crucial for market players to sustain and grow their market presence. Additionally, the demand for colocation services in Singapore is expected to rise as businesses seek cost-effective and scalable solutions.
Singapore Data Center Market Leaders
-
China Mobile International Ltd
-
Cyxtera Technologies
-
Digital Realty Trust Inc.
-
Equinix Inc.
-
Rackspace Technology Inc.
- *Disclaimer: Major Players sorted in no particular order

Need More Details on Market Players and Competiters?
Download PDF
Singapore Data Center Market News
- November 2022: AirTrunk completed the final phase of the SGP1 data center, expanding its total capacity to more than 78 MW to deploy hyperscale capacity at an unprecedented speed and scale.
- September 2022: Equinix Inc. announced a partnership with the Centre for Energy Research & Technology (CERT) under the National University of Singapore's (NUS) College of Design and Engineering to explore technologies that enable the use of hydrogen as a green fuel source for mission-critical data center infrastructure.
- June 2022: PhoenixNAP announced that it had entered a partnership with Pliops, a leading provider of data processors for cloud and enterprise data centers. Through this collaboration, PhoenixNAP will deliver on-demand cloud services that meet the needs of performance-sensitive users.
Free With This Report
We provide a complimentary and exhaustive set of data points on the country and regional level metrics that present the fundamental structure of the industry. Presented in the form of 50+ free charts, the sections cover difficult to find data on various countries on smartphone users, data traffic per smartphone, mobile and broadband data speed, fiber connectivity network, and submarine cables.


Singapore Data Center Market Report - Table of Contents
1. EXECUTIVE SUMMARY & KEY FINDINGS
2. REPORT OFFERS
3. INTRODUCTION
- 3.1 Study Assumptions & Market Definition
- 3.2 Scope of the Study
- 3.3 Research Methodology
4. MARKET OUTLOOK
- 4.1 It Load Capacity
- 4.2 Raised Floor Space
- 4.3 Colocation Revenue
- 4.4 Installed Racks
- 4.5 Rack Space Utilization
- 4.6 Submarine Cable
5. Key Industry Trends
- 5.1 Smartphone Users
- 5.2 Data Traffic Per Smartphone
- 5.3 Mobile Data Speed
- 5.4 Broadband Data Speed
- 5.5 Fiber Connectivity Network
-
5.6 Regulatory Framework
- 5.6.1 Singapore
- 5.7 Value Chain & Distribution Channel Analysis
6. MARKET SEGMENTATION (INCLUDES MARKET SIZE IN VOLUME, FORECASTS UP TO 2030 AND ANALYSIS OF GROWTH PROSPECTS)
-
6.1 Hotspot
- 6.1.1 East Singapore
- 6.1.2 West Singapore
- 6.1.3 Rest of Singapore
-
6.2 Data Center Size
- 6.2.1 Large
- 6.2.2 Massive
- 6.2.3 Medium
- 6.2.4 Mega
- 6.2.5 Small
-
6.3 Tier Type
- 6.3.1 Tier 1 and 2
- 6.3.2 Tier 3
- 6.3.3 Tier 4
-
6.4 Absorption
- 6.4.1 Non-Utilized
- 6.4.2 Utilized
- 6.4.2.1 By Colocation Type
- 6.4.2.1.1 Hyperscale
- 6.4.2.1.2 Retail
- 6.4.2.1.3 Wholesale
- 6.4.2.2 By End User
- 6.4.2.2.1 BFSI
- 6.4.2.2.2 Cloud
- 6.4.2.2.3 E-Commerce
- 6.4.2.2.4 Government
- 6.4.2.2.5 Manufacturing
- 6.4.2.2.6 Media & Entertainment
- 6.4.2.2.7 Telecom
- 6.4.2.2.8 Other End User
7. COMPETITIVE LANDSCAPE
- 7.1 Market Share Analysis
- 7.2 Company Landscape
-
7.3 Company Profiles (includes Global Level Overview, Market Level Overview, Core Business Segments, Financials, Headcount, Key Information, Market Rank, Market Share, Products and Services, and Analysis of Recent Developments).
- 7.3.1 1-Net Singapore Pte Ltd (Mediacorp)
- 7.3.2 Air Trunk Operating Pty Ltd
- 7.3.3 China Mobile International Ltd
- 7.3.4 Cyxtera Technologies
- 7.3.5 Digital Realty Trust Inc.
- 7.3.6 Empyrion DC
- 7.3.7 Equinix Inc.
- 7.3.8 Global Switch Holdings Limited
- 7.3.9 PhoenixNAP
- 7.3.10 Princeton Digital Group
- 7.3.11 Rackspace Technology Inc.
- 7.3.12 STT GDC Pte Ltd
- 7.4 LIST OF COMPANIES STUDIED
8. KEY STRATEGIC QUESTIONS FOR DATA CENTER CEOS
9. APPENDIX
-
9.1 Global Overview
- 9.1.1 Overview
- 9.1.2 Porter’s Five Forces Framework
- 9.1.3 Global Value Chain Analysis
- 9.1.4 Global Market Size and DROs
- 9.2 Sources & References
- 9.3 List of Tables & Figures
- 9.4 Primary Insights
- 9.5 Data Pack
- 9.6 Glossary of Terms
You Can Purchase Parts Of This Report. Check Out Prices For Specific Sections
Get Price Break-up Now
List of Tables & Figures
- Figure 1:
- VOLUME OF IT LOAD CAPACITY, MW, SINGAPORE, 2018 - 2030
- Figure 2:
- VOLUME OF RAISED FLOOR AREA, SQ.FT. ('000), SINGAPORE, 2018 - 2030
- Figure 3:
- VALUE OF COLOCATION REVENUE, USD MILLION, SINGAPORE, 2018 - 2030
- Figure 4:
- VOLUME OF INSTALLED RACKS, NUMBER, SINGAPORE, 2018 - 2030
- Figure 5:
- RACK SPACE UTILIZATION, %, SINGAPORE, 2018 - 2030
- Figure 6:
- COUNT OF SMARTPHONE USERS, IN MILLION, SINGAPORE, 2018 - 2030
- Figure 7:
- DATA TRAFFIC PER SMARTPHONE, GB, SINGAPORE, 2018 - 2030
- Figure 8:
- AVERAGE MOBILE DATA SPEED, MBPS, SINGAPORE, 2018 - 2030
- Figure 9:
- AVERAGE BROADBAND SPEED, MBPS, SINGAPORE, 2018 - 2030
- Figure 10:
- LENGTH OF FIBER CONNECTIVITY NETWORK, KILOMETER, SINGAPORE, 2018 - 2030
- Figure 11:
- VOLUME OF IT LOAD CAPACITY, MW, SINGAPORE, 2018 - 2030
- Figure 12:
- VOLUME OF HOTSPOT, MW, SINGAPORE, 2018 - 2030
- Figure 13:
- VOLUME SHARE OF HOTSPOT, %, SINGAPORE, 2018 - 2030
- Figure 14:
- VOLUME SIZE OF EAST SINGAPORE, MW, SINGAPORE, 2018 - 2030
- Figure 15:
- VOLUME SHARE OF EAST SINGAPORE, MW, HOTSPOT, %, SINGAPORE, 2018 - 2030
- Figure 16:
- VOLUME SIZE OF WEST SINGAPORE, MW, SINGAPORE, 2018 - 2030
- Figure 17:
- VOLUME SHARE OF WEST SINGAPORE, MW, HOTSPOT, %, SINGAPORE, 2018 - 2030
- Figure 18:
- VOLUME SIZE OF REST OF SINGAPORE, MW, SINGAPORE, 2018 - 2030
- Figure 19:
- VOLUME SHARE OF REST OF SINGAPORE, MW, HOTSPOT, %, SINGAPORE, 2018 - 2030
- Figure 20:
- VOLUME OF DATA CENTER SIZE, MW, SINGAPORE, 2018 - 2030
- Figure 21:
- VOLUME SHARE OF DATA CENTER SIZE, %, SINGAPORE, 2018 - 2030
- Figure 22:
- VOLUME SIZE OF LARGE, MW, SINGAPORE, 2018 - 2030
- Figure 23:
- VOLUME SIZE OF MASSIVE, MW, SINGAPORE, 2018 - 2030
- Figure 24:
- VOLUME SIZE OF MEDIUM, MW, SINGAPORE, 2018 - 2030
- Figure 25:
- VOLUME SIZE OF MEGA, MW, SINGAPORE, 2018 - 2030
- Figure 26:
- VOLUME SIZE OF SMALL, MW, SINGAPORE, 2018 - 2030
- Figure 27:
- VOLUME OF TIER TYPE, MW, SINGAPORE, 2018 - 2030
- Figure 28:
- VOLUME SHARE OF TIER TYPE, %, SINGAPORE, 2018 - 2030
- Figure 29:
- VOLUME SIZE OF TIER 1 AND 2, MW, SINGAPORE, 2018 - 2030
- Figure 30:
- VOLUME SIZE OF TIER 3, MW, SINGAPORE, 2018 - 2030
- Figure 31:
- VOLUME SIZE OF TIER 4, MW, SINGAPORE, 2018 - 2030
- Figure 32:
- VOLUME OF ABSORPTION, MW, SINGAPORE, 2018 - 2030
- Figure 33:
- VOLUME SHARE OF ABSORPTION, %, SINGAPORE, 2018 - 2030
- Figure 34:
- VOLUME SIZE OF NON-UTILIZED, MW, SINGAPORE, 2018 - 2030
- Figure 35:
- VOLUME OF COLOCATION TYPE, MW, SINGAPORE, 2018 - 2030
- Figure 36:
- VOLUME SHARE OF COLOCATION TYPE, %, SINGAPORE, 2018 - 2030
- Figure 37:
- VOLUME SIZE OF HYPERSCALE, MW, SINGAPORE, 2018 - 2030
- Figure 38:
- VOLUME SIZE OF RETAIL, MW, SINGAPORE, 2018 - 2030
- Figure 39:
- VOLUME SIZE OF WHOLESALE, MW, SINGAPORE, 2018 - 2030
- Figure 40:
- VOLUME OF END USER, MW, SINGAPORE, 2018 - 2030
- Figure 41:
- VOLUME SHARE OF END USER, %, SINGAPORE, 2018 - 2030
- Figure 42:
- VOLUME SIZE OF BFSI, MW, SINGAPORE, 2018 - 2030
- Figure 43:
- VOLUME SIZE OF CLOUD, MW, SINGAPORE, 2018 - 2030
- Figure 44:
- VOLUME SIZE OF E-COMMERCE, MW, SINGAPORE, 2018 - 2030
- Figure 45:
- VOLUME SIZE OF GOVERNMENT, MW, SINGAPORE, 2018 - 2030
- Figure 46:
- VOLUME SIZE OF MANUFACTURING, MW, SINGAPORE, 2018 - 2030
- Figure 47:
- VOLUME SIZE OF MEDIA & ENTERTAINMENT, MW, SINGAPORE, 2018 - 2030
- Figure 48:
- VOLUME SIZE OF TELECOM, MW, SINGAPORE, 2018 - 2030
- Figure 49:
- VOLUME SIZE OF OTHER END USER, MW, SINGAPORE, 2018 - 2030
- Figure 50:
- VOLUME SHARE OF MAJOR PLAYERS, %, SINGAPORE
Singapore Data Center Industry Segmentation
East Singapore, West Singapore are covered as segments by Hotspot. Large, Massive, Medium, Mega, Small are covered as segments by Data Center Size. Tier 1 and 2, Tier 3, Tier 4 are covered as segments by Tier Type. Non-Utilized, Utilized are covered as segments by Absorption.| Hotspot | East Singapore | |||
| West Singapore | ||||
| Rest of Singapore | ||||
| Data Center Size | Large | |||
| Massive | ||||
| Medium | ||||
| Mega | ||||
| Small | ||||
| Tier Type | Tier 1 and 2 | |||
| Tier 3 | ||||
| Tier 4 | ||||
| Absorption | Non-Utilized | |||
| Utilized | By Colocation Type | Hyperscale | ||
| Retail | ||||
| Wholesale | ||||
| By End User | BFSI | |||
| Cloud | ||||
| E-Commerce | ||||
| Government | ||||
| Manufacturing | ||||
| Media & Entertainment | ||||
| Telecom | ||||
| Other End User | ||||
Need A Different Region or Segment?
Customize Now
Market Definition
- IT LOAD CAPACITY - The IT load capacity or installed capacity, refers to the amount of energy consumed by servers and network equipments placed in a rack installed. It is measured in megawatt (MW).
- ABSORPTION RATE - It denotes the extend to which the data center capacity has been leased out. For instance, a 100 MW DC has leased out 75 MW, then absorption rate would be 75%. It is also referred as utilization rate and leased-out capacity.
- RAISED FLOOR SPACE - It is an elevated space build over the floor. This gap between the original floor and the elevated floor is used to accommodate wiring, cooling, and other data center equipment. This arrangement assist in having proper wiring and cooling infrastructure. It is measured in square feet (ft^2).
- DATA CENTER SIZE - Data Center Size is segmented based on the raised floor space allocated to the data center facilities. Mega DC - # of Racks must be more than 9000 or RFS (raised floor space) must be more than 225001 Sq. ft; Massive DC - # of Racks must be in between 9000 and 3001 or RFS must be in between 225000 Sq. ft and 75001 Sq. ft; Large DC - # of Racks must be in between 3000 and 801 or RFS must be in between 75000 Sq. ft and 20001 Sq. ft; Medium DC # of Racks must be in between 800 and 201 or RFS must be in between 20000 Sq. ft and 5001 Sq. ft; Small DC - # of Racks must be less than 200 or RFS must be less than 5000 Sq. ft.
- TIER TYPE - According to Uptime Institute the data centers are classified into four tiers based on the proficiencies of redundant equipment of the data center infrastructure. In this segment the data center are segmented as Tier 1,Tier 2, Tier 3 and Tier 4.
- COLOCATION TYPE - The segment is segregated into 3 categories namely Retail, Wholesale and Hyperscale Colocation service. The categorization is done based on the amount of IT load leased out to potential customers. Retail colocation service has leased capacity less than 250 kW; Wholesale colocation services has leased capacity between 251 kW and 4 MW and Hyperscale colocation services has leased capacity more than 4 MW.
- END CONSUMERS - The Data Center Market operates on a B2B basis. BFSI, Government, Cloud Operators, Media and Entertainment, E-Commerce, Telecom and Manufacturing are the major end-consumers in the market studied. The scope only includes colocation service operators catering to the increasing digitalization of the end-user industries.
| Keyword | Definition |
|---|---|
| Rack Unit | Generally referred as U or RU, it is the unit of measurement for the server unit housed in the racks in the data center. 1U is equal to 1.75 inches. |
| Rack Density | It defines the amount of power consumed by the equipment and server housed in a rack. It is measured in kilowatt (kW). This factor plays a critical role in data center design and, cooling and power planning. |
| IT Load Capacity | The IT load capacity or installed capacity, refers to the amount of energy consumed by servers and network equipment placed in a rack installed. It is measured in megawatt (MW). |
| Absorption Rate | It denotes how much of the data center capacity has been leased out. For instance, if a 100 MW DC has leased out 75 MW, then the absorption rate would be 75%. It is also referred to as utilization rate and leased-out capacity. |
| Raised Floor Space | It is an elevated space built over the floor. This gap between the original floor and the elevated floor is used to accommodate wiring, cooling, and other data center equipment. This arrangement assists in having proper wiring and cooling infrastructure. It is measured in square feet/meter. |
| Computer Room Air Conditioner (CRAC) | It is a device used to monitor and maintain the temperature, air circulation, and humidity inside the server room in the data center. |
| Aisle | It is the open space between the rows of racks. This open space is critical for maintaining the optimal temperature (20-25 °C) in the server room. There are primarily two aisles inside the server room, a hot aisle and a cold aisle. |
| Cold Aisle | It is the aisle wherein the front of the rack faces the aisle. Here, chilled air is directed into the aisle so that it can enter the front of the racks and maintain the temperature. |
| Hot Aisle | It is the aisle where the back of the racks faces the aisle. Here, the heat dissipated from the equipment’s in the rack is directed to the outlet vent of the CRAC. |
| Critical Load | It includes the servers and other computer equipment whose uptime is critical for data center operation. |
| Power Usage Effectiveness (PUE) | It is a metric which defines the efficiency of a data center. It is calculated by: (𝑇𝑜𝑡𝑎𝑙 𝐷𝑎𝑡𝑎 𝐶𝑒𝑛𝑡𝑒𝑟 𝐸𝑛𝑒𝑟𝑔𝑦 𝐶𝑜𝑛𝑠𝑢𝑚𝑝𝑡𝑖𝑜𝑛)/(𝑇𝑜𝑡𝑎𝑙 𝐼𝑇 𝐸𝑞𝑢𝑖𝑝𝑚𝑒𝑛𝑡 𝐸𝑛𝑒𝑟𝑔𝑦 𝐶𝑜𝑛𝑠𝑢𝑚𝑝𝑡𝑖𝑜𝑛). Further, a data center with a PUE of 1.2-1.5 is considered highly efficient, whereas, a data center with a PUE >2 is considered highly inefficient. |
| Redundancy | It is defined as a system design wherein additional component (UPS, generators, CRAC) is added so that in case of power outage, equipment failure, the IT equipment should not be affected. |
| Uninterruptible Power Supply (UPS) | It is a device that is connected in series with the utility power supply, storing energy in batteries such that the supply from UPS is continuous to IT equipment even during utility power is snapped. The UPS primarily supports the IT equipment only. |
| Generators | Just like UPS, generators are placed in the data center to ensure an uninterrupted power supply, avoiding downtime. Data center facilities have diesel generators and commonly, 48-hour diesel is stored in the facility to prevent disruption. |
| N | It denotes the tools and equipment required for a data center to function at full load. Only "N" indicates that there is no backup to the equipment in the event of any failure. |
| N+1 | Referred to as 'Need plus one', it denotes the additional equipment setup available to avoid downtime in case of failure. A data center is considered N+1 when there is one additional unit for every 4 components. For instance, if a data center has 4 UPS systems, then for to achieve N+1, an additional UPS system would be required. |
| 2N | It refers to fully redundant design wherein two independent power distribution system is deployed. Therefore, in the event of a complete failure of one distribution system, the other system will still supply power to the data center. |
| In-Row Cooling | It is the cooling design system installed between racks in a row where it draws warm air from the hot aisle and supplies cool air to the cold aisle, thereby maintaining the temperature. |
| Tier 1 | Tier classification determines the preparedness of a data center facility to sustain data center operation. A data center is classified as Tier 1 data center when it has a non-redundant (N) power component (UPS, generators), cooling components, and power distribution system (from utility power grids). The Tier 1 data center has an uptime of 99.67% and an annual downtime of <28.8 hours. |
| Tier 2 | A data center is classified as Tier 2 data center when it has a redundant power and cooling components (N+1) and a single non-redundant distribution system. Redundant components include extra generators, UPS, chillers, heat rejection equipment, and fuel tanks. The Tier 2 data center has an uptime of 99.74% and an annual downtime of <22 hours. |
| Tier 3 | A data center having redundant power and cooling components and multiple power distribution systems is referred to as a Tier 3 data center. The facility is resistant to planned (facility maintenance) and unplanned (power outage, cooling failure) disruption. The Tier 3 data center has an uptime of 99.98% and an annual downtime of <1.6 hours. |
| Tier 4 | It is the most tolerant type of data center. A Tier 4 data center has multiple, independent redundant power and cooling components and multiple power distribution paths. All IT equipment are dual powered, making them fault tolerant in case of any disruption, thereby ensuring interrupted operation. The Tier 4 data center has an uptime of 99.74% and an annual downtime of <26.3 minutes. |
| Small Data Center | Data center that has floor space area of ≤ 5,000 Sq. ft or the number of racks that can be installed is ≤ 200 is classified as a small data center. |
| Medium Data Center | Data center which has floor space area between 5,001-20,000 Sq. ft, or the number of racks that can be installed is between 201-800, is classified as a medium data center. |
| Large Data Center | Data center which has floor space area between 20,001-75,000 Sq. ft, or the number of racks that can be installed is between 801-3,000, is classified as a large data center. |
| Massive Data Center | Data center which has floor space area between 75,001-225,000 Sq. ft, or the number of racks that can be installed is between 3001-9,000, is classified as a massive data center. |
| Mega Data Center | Data center that has a floor space area of ≥ 225,001 Sq. ft or the number of racks that can be installed is ≥ 9001 is classified as a mega data center. |
| Retail Colocation | It refers to those customers who have a capacity requirement of 250 kW or less. These services are majorly opted by small and medium enterprises (SMEs). |
| Wholesale Colocation | It refers to those customers who have a capacity requirement between 250 kW to 4 MW. These services are majorly opted by medium to large enterprises. |
| Hyperscale Colocation | It refers to those customers who have a capacity requirement greater than 4 MW. The hyperscale demand primarily originates from large-scale cloud players, IT companies, BFSI, and OTT players (like Netflix, Hulu, and HBO+). |
| Mobile Data Speed | It is the mobile internet speed a user experiences via their smartphones. This speed is primarily dependent on the carrier technology being used in the smartphone. The carrier technologies available in the market are 2G, 3G, 4G, and 5G, where 2G provides the slowest speed while 5G is the fastest. |
| Fiber Connectivity Network | It is a network of optical fiber cables deployed across the country, connecting rural and urban regions with high-speed internet connection. It is measured in kilometer (km). |
| Data Traffic per Smartphone | It is a measure of average data consumption by a smartphone user in a month. It is measured in gigabyte (GB). |
| Broadband Data Speed | It is the internet speed that is supplied over the fixed cable connection. Commonly, copper cable and optic fiber cable are used in both residential and commercial use. Here, optic cable fiber provides faster internet speed than copper cable. |
| Submarine Cable | A submarine cable is a fiber optic cable laid down at two or more landing points. Through this cable, communication and internet connectivity between countries across the globe is established. These cables can transmit 100-200 terabits per second (Tbps) from one point to another. |
| Carbon Footprint | It is the measure of carbon dioxide generated during the regular operation of a data center. Since, coal, and oil & gas are the primary source of power generation, consumption of this power contributes to carbon emissions. Data center operators are incorporating renewable energy sources to curb the carbon footprint emerging in their facilities. |
Need More Details on Market Definition?
Ask a Question
Research Methodology
Mordor Intelligence follows a four-step methodology in all our reports.
- Step-1: Identify Key Variables: In order to build a robust forecasting methodology, the variables and factors identified in Step-1 are tested against available historical market numbers. Through an iterative process, the variables required for market forecast are set and the model is built on the basis of these variables.
- Step-2: Build a Market Model: Market-size estimations for the forecast years are in nominal terms. Inflation is not a part of the pricing, and the average selling price (ASP) is kept constant throughout the forecast period for each country.
- Step-3: Validate and Finalize: In this important step, all market numbers, variables and analyst calls are validated through an extensive network of primary research experts from the market studied. The respondents are selected across levels and functions to generate a holistic picture of the market studied.
- Step-4: Research Outputs: Syndicated Reports, Custom Consulting Assignments, Databases & Subscription Platforms

Get More Details On Research Methodology
Download PDF


