
Silver Market Size and Share
Market Overview
| Study Period | 2021 - 2031 |
|---|---|
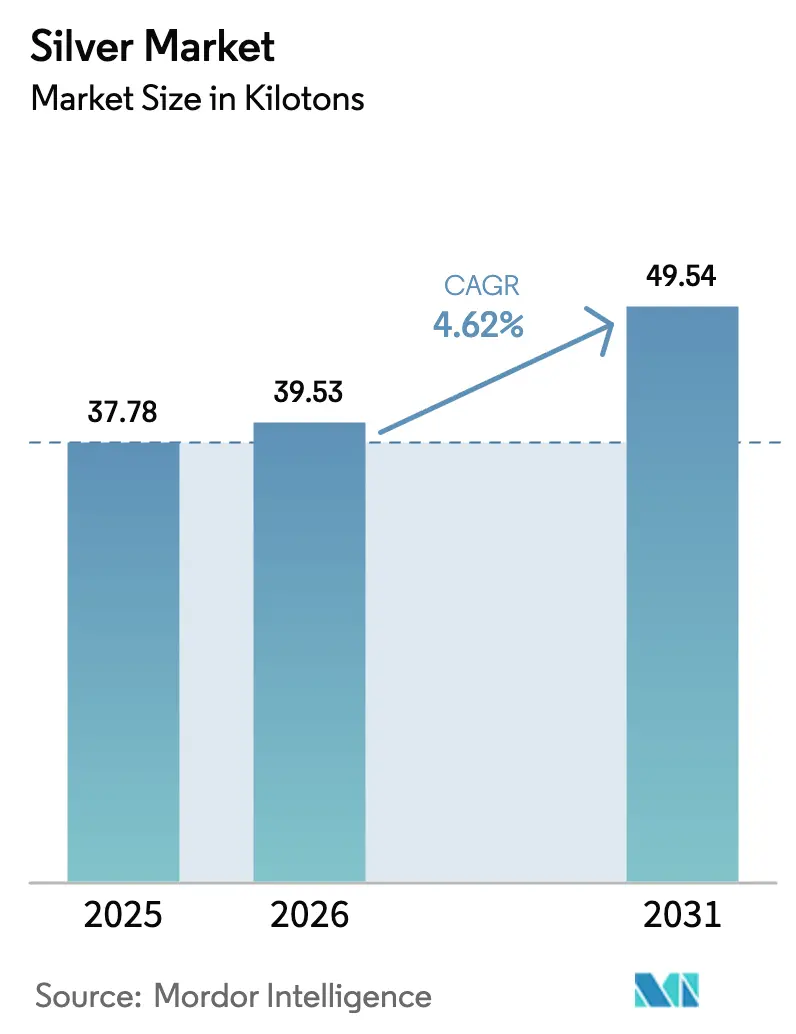
| Market Volume (2026) | 39.53 kilotons |
| Market Volume (2031) | 49.54 kilotons |
| Growth Rate (2026 - 2031) | 4.62 % |
| Fastest Growing Market | Asia Pacific |
| Largest Market | Asia Pacific |
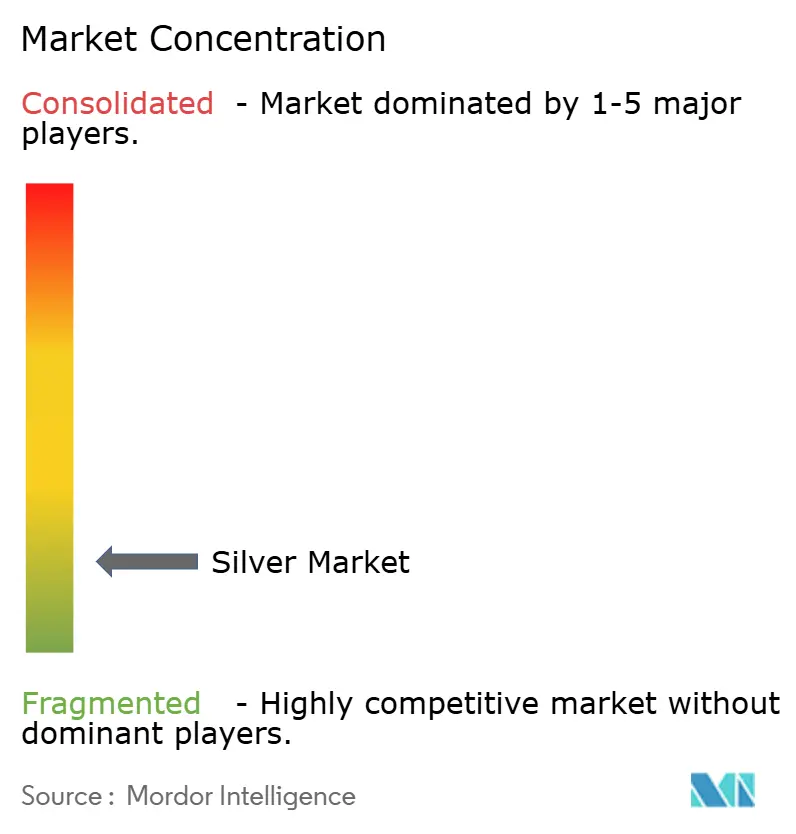
| Market Concentration | Low |
Major Players *Disclaimer: Major Players sorted in no particular order Image © Mordor Intelligence. Reuse requires attribution under CC BY 4.0. | |
Silver Market Analysis by Mordor Intelligence
The Silver Market size is expected to grow from 37.78 kilotons in 2025 to 39.53 kilotons in 2026 and is forecast to reach 49.54 kilotons by 2031 at a 4.62% CAGR over 2026-2031. Demand continues to tilt toward industrial fabrication, which already represents a significant portion of total consumption as photovoltaic cell metallization, 5G base-station roll-outs, and high-voltage direct-current (HV-DC) fast-charge connectors together absorbed a considerable amount in 2024. Mexico remained the largest mine producer in 2024, while Peru controls the world’s biggest reserves, equal to a notable share of identified resources. Electronics miniaturization, utility-scale solar additions, and the adoption of silver-based antimicrobial coatings are sustaining a healthy forward orderbook for refined bullion, even as manufacturers aggressively thrift silver loading per photovoltaic cell to protect margins during price spikes. Regulatory tightening on heavy-metal discharge, especially in Latin America, is pushing up compliance costs and extending lead times on new mine approvals, which could constrain fresh supply. At the same time, copper- and aluminum-based substitutes in wiring and PV ribbons are beginning to shave incremental demand, underscoring the delicate balance between technology, cost, and sustainability that will shape the silver market during the next decade.
Key Report Takeaways
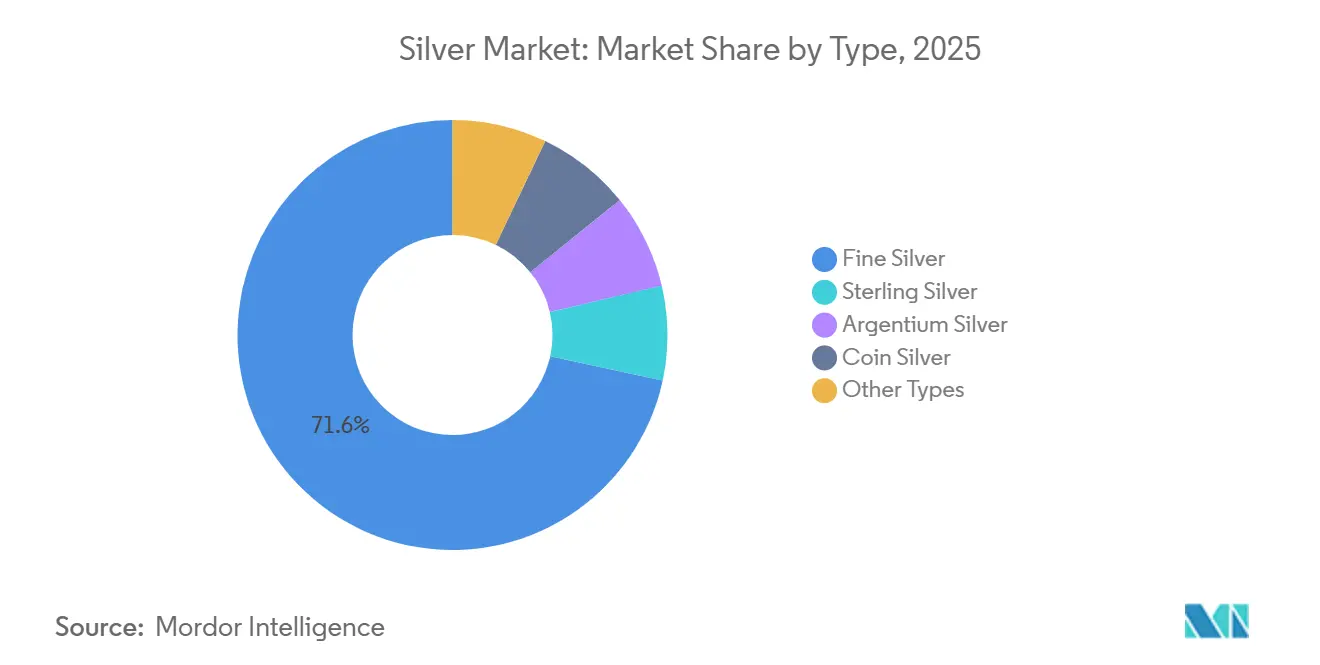
- By type, fine silver led with 71.62% of silver market share in 2025, while argentium silver is forecast to expand at 4.74% CAGR through 2031.
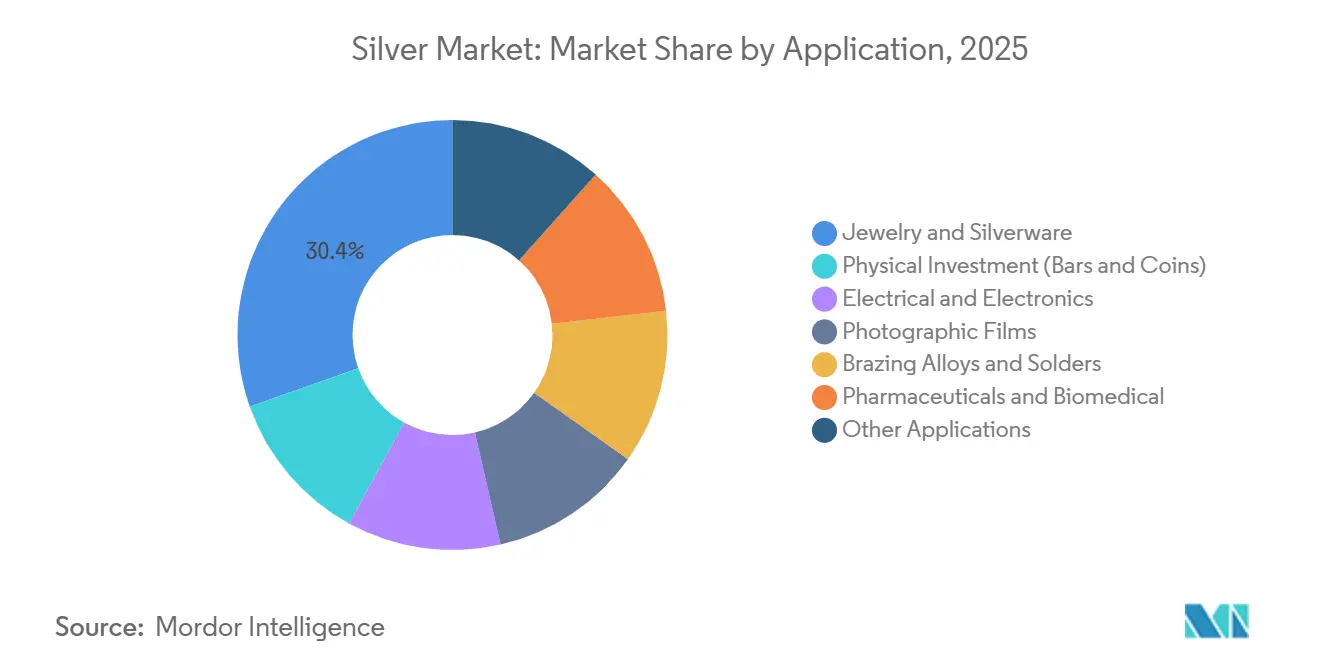
- By application, jewelry and silverware captured 30.41% of the silver market size in 2025, whereas electrical and electronics are projected to advance at a 4.65% CAGR between 2026 and 2031.
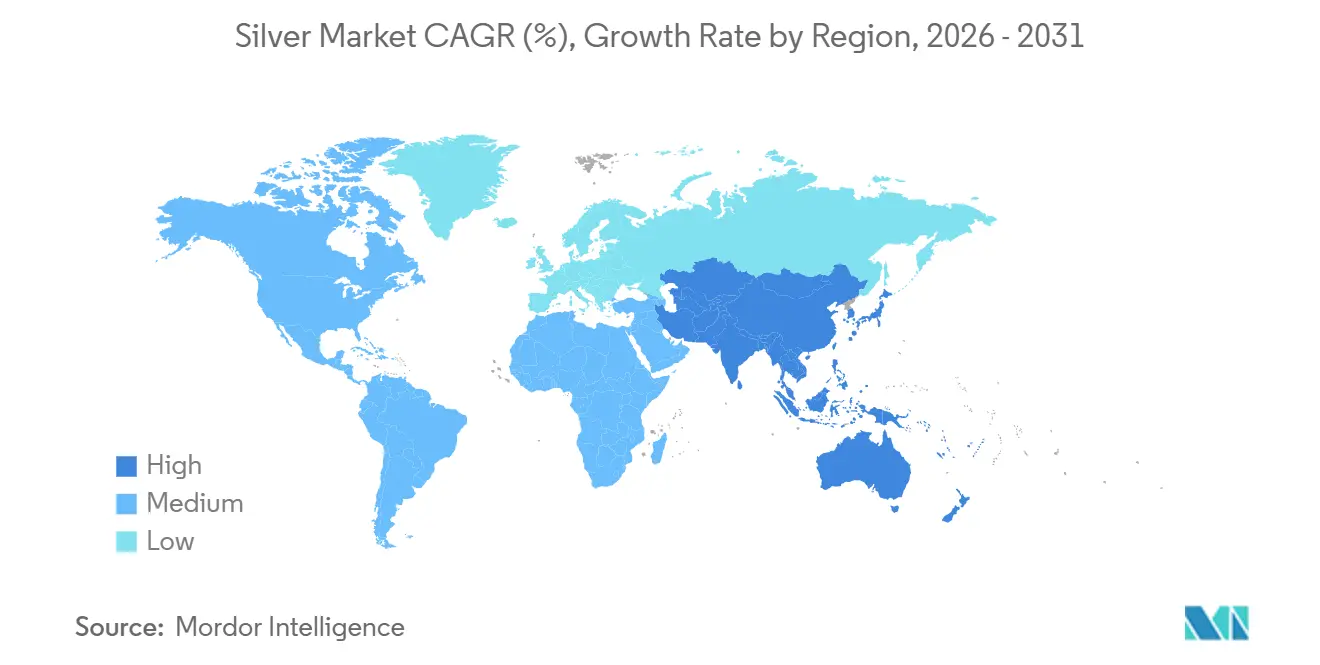
- By geography, Asia-Pacific commanded 57.44% of global consumption in 2025, and is expected to post the fastest growth at 4.91% CAGR during the outlook period.
Note: Market size and forecast figures in this report are generated using Mordor Intelligence’s proprietary estimation framework, updated with the latest available data and insights as of 2026.
Market Trends and Insights
Drivers Impact Analysis of Silver Market*
| Drivers | (~) % Impact on CAGR Forecast | Geographic Relevance | Impact Timeline |
|---|---|---|---|
| Electronics miniaturisation and 5G component demand | +1.2% | Global, concentrated in Asia-Pacific and North America | Medium term (2-4 years) |
| Utility-scale photovoltaic (PV) build-out | +1.8% | Global, led by China, India, United States, and Europe | Long term (≥ 4 years) |
| Recovery in medical X-ray / photographic film in EMs | +0.3% | Emerging markets in Asia-Pacific, Latin America, and Africa | Short term (≤ 2 years) |
| Silver-based antimicrobial coatings for food packaging | +0.5% | North America, Europe, with adoption spreading to Asia-Pacific | Medium term (2-4 years) |
| HV-DC fast-charging connectors in Electric Vehicle infrastructure | +0.7% | China, Europe, North America | Medium term (2-4 years) |
| Source: Mordor Intelligence | |||
Electronics Miniaturization and 5G Component Demand
The global expansion of 5G, both through macro and small-cell sites, is driving up the demand for ultra-high-conductivity paste. This paste is crucial for multilayer ceramic capacitors, thick-film conductors, and radio-frequency shielding. Silver, with an electrical conductivity of 63 × 10⁶ S/m at 20 °C, minimizes insertion loss at millimeter-wave frequencies above 24 GHz[1]. This property solidifies silver's role in antenna arrays and power amplifiers. In 2025, component manufacturers from Korea and Taiwan boosted their paste orders, gearing up for the dense urban deployments of 5G. However, profit margins face pressure, especially where copper-based inks are adequate for designs under 6 GHz. As research into 6G continues, silver's role is becoming more pronounced, especially for chiplet interconnects that demand a bulk resistivity below 1.6 µΩ·cm. This trend suggests a sustained demand for silver well into 2030.
Utility-Scale Photovoltaic Build-Out
In 2025, solar installations added new capacity, with a significant portion being utility-scale. This surge solidified photovoltaics as the leading consumer of silver slurry for front-side metallization. Historically, each time solar capacity doubles, silver usage per watt drops. However, the newer n-type TOPCon and heterojunction cells, which utilize dual-sided collectors, have momentarily increased silver requirements per cell. Manufacturers aim to reduce silver usage per cell by 2030, employing techniques like finer screen meshes and hybrid copper plating. Thanks to Beijing's subsidies for export-bound modules, the Asia-Pacific region remains the focal point for silver powder demand. Furthermore, the emerging panel-recycling ecosystem is projected to satisfy a substantial portion of silver needs driven by photovoltaics by the middle of the century.
Recovery in Medical X-Ray/Photographic Film in Emerging Markets
In rural areas of India, Bangladesh, and Nigeria, government-funded basic radiography suites continue to depend on analog film, hampered by unstable power and limited IT infrastructure. Thanks to the addition of new mobile clinics under India's National Health Mission in 2025, global consumption of photographic film remained steady. While this represents only a small fraction of total silver consumption, it has the potential to influence spot demand, especially during tight supply chain periods. Although a shift to digital is on the horizon, the affordability of film and its autonomy from network dependencies offer a crucial, albeit temporary, solution for these underserved regions.
Silver-Based Antimicrobial Coatings for Food Packaging
Retailers pursuing lower spoilage rates are piloting silver nanoparticle liners that cut microbial growth by up to 40% during chilled transport. North American grocery chains began commercial roll-outs in 2025, while the European Commission now requires cradle-to-grave life-cycle assessments for such coatings starting in 2027 to address nanoparticle discharge concerns. The application remains niche but shows a steep adoption curve in prepared-meal logistics and online grocery channels.
Restraints Impact Analysis of Silver Market*
| Restraints | (~) % Impact on CAGR Forecast | Geographic Relevance | Impact Timeline |
|---|---|---|---|
| Heavy-metal discharge caps in mining permits | -0.8% | Latin America (Peru, Chile, Mexico), North America, Poland | Long term (≥ 4 years) |
| Copper/aluminium substitution in wiring and PV ribbons | -1.1% | Global, most acute in Asia-Pacific solar manufacturing | Medium term (2-4 years) |
| High price volatility limiting long-term contracts | -0.6% | Global, affecting industrial fabricators and investment demand | Short term (≤ 2 years) |
| Source: Mordor Intelligence | |||
Heavy-Metal Discharge Caps in Mining Permits
In 2024, the U.S. Environmental Protection Agency slashed the dissolved-silver limits in tailings discharge[2]. This move has led to a doubling of water-treatment costs for several polymetallic mines in Nevada and Alaska. Following suit, Peru imposed even more stringent zero-liquid-discharge mandates in regions like Áncash. This has resulted in capital costs surging and has stalled the introduction of new annual capacity. By elevating the hurdle rate on marginal projects, these environmental regulations jeopardize the growth of primary-mine output. This could leave the silver market in a precarious position, especially when industrial demand sees an uptick.
Copper/Aluminum Substitution in Wiring and PV Ribbons
Engineers are increasingly opting for copper over silver in bus ribbons and mid-temperature solders, driven by the fact that a kilogram of copper costs less than two percent of its equivalent conductive mass in silver, provided the efficiency trade-off is acceptable. Chinese module maker LONGi unveiled a copper-silver hybrid metallization strategy, targeting a significant reduction in silver usage per cell. Concurrently, aluminum ribbons are capturing a larger share on the rear sides of bifacial panels. If these trajectories persist, silver's dominance in PV metallization could decline significantly by decade's end, leading to a notable decrease in annual demand.
*Our forecasts treat driver/restraint impacts as directional, not additive. The impact forecasts reflect baseline growth, mix effects, and variable interactions.
Silver Market Segment Analysis
By Type – Fine Silver Retains Dominance amid Purity Demand
Fine Silver secured a 71.62% share of the volume, solidifying its status as the primary feedstock for industrial powders, investment bars, and exchange-traded inventories. Ultra-high-purity grades are being utilized for RF filters and next-gen chip packaging, further bolstering Fine Silver’s prominence as electronics fabrication expands. Sterling Silver remains a staple in classic jewelry due to its hardness and hallmarked branding. However, Indian retail volumes faced a price-induced dip. Argentium Silver, known for its tarnish resistance in humid conditions, is increasingly favored for low-maintenance luxury goods and marine fittings, explaining its forecast 4.74% CAGR to 2031. While Coin Silver and niche alloys collectively account for a smaller share, they maintain relevance in numismatics, solders, and medical catalysts.
As photovoltaics continue to evolve, there's a heightened emphasis on purity thresholds for paste inputs. This trend ensures Fine Silver's sub-segment retains its dominant position in the silver market for the foreseeable future. Despite Argentium's relative growth rate outpacing the broader market, its expansion will be limited by the constrained supply of germanium, a vital component. Meanwhile, Coin Silver faces stagnation as central banks halt the bulk minting of 90%-silver coins, and investors shift their preference towards .999 fine rounds. Across the board, while recyclers are increasingly targeting jewelry scrap and electronic waste, their current contribution remains modest.

By Application – Electronics Outpace Jewelry While Investment Stays Cyclical
Jewelry and silverware represented 30.41% of the 2025 volume, but rising prices dampened discretionary spending among younger Asian buyers, particularly in India, resulting in a contraction. Meanwhile, the electrical and electronics sector, buoyed by multilayer ceramic capacitors, PV cell grids, and HV-DC connectors, is registering a 4.65% CAGR. These components elevated their share of the silver market. Physical investments surged during times of monetary-policy uncertainty, which heightened the demand for bullion hedges. While photographic film now constitutes a small portion of silver fabrication, it demonstrates resilience, particularly in emerging-market healthcare.
Brazing alloys and solders, though stable in tonnage as a mature end-use, are gradually ceding market share to lead-free copper-phosphorus alternatives, especially in HVAC and white-goods manufacturing. Pharmaceuticals and biomedical applications, such as antimicrobial wound dressings and coated catheters, may see increased demand due to the aging global population. Silver's pairing with zinc in battery chemistries finds niche adoption in aerospace, albeit with a reliance on defense budgets. Collectively, these non-jewelry industrial avenues bolster a demand floor, providing stability to the silver market during dips in investor interest.
Geography Analysis
APAC Silver Market
Asia-Pacific accounted for a commanding 57.44% of global consumption in 2025 and should sustain a 4.91% CAGR through 2031, bolstered by China's robust polysilicon value chain and India's growing import appetite. Despite significant mining activity in 2024, China turned to imports, seeking refined metal to satisfy its electronics and solar demands. This highlights the region's deficit stance. In 2025, India's Union Budget cut import duties, triggering a spike in refined-silver inflows. However, elevated local prices dampened jewelry sales. Meanwhile, Japan and South Korea, together accounting for a portion of the region's consumption, focus on semiconductor packaging, still predominantly using silver wire-bond interconnects, despite testing coated copper alternatives.
North America and Europe Silver Market
North America claimed a notable share of global consumption in 2025. The U.S., with its mining output, found itself consuming nearly threefold that amount across sectors like electronics, medical devices, and bullion investments, highlighting a structural shortfall. Mexico's production saw only a fraction consumed domestically, with the majority exported, mainly to the U.S. and India. Europe, holding a significant share, leans on Germany, Italy, and the U.K. for silverware and industrial needs. Notably, outside of Poland's output in 2024, regional mining contributions remain scant.
South America, MEA and APAC Silver Market
South America, accounting for a portion of global consumption, is driven by Brazil's electronics sector and Argentina's budding investment interest. The Middle-East and Africa, together consuming about a small share, are poised for modest growth. This is largely due to Saudi Arabia's push into utility-scale solar, which relies on silver-rich heterojunction modules. On the supply front, 2024 saw global mine production fall short of fabrication demand. Recycled scrap and withdrawals from above-ground stocks filled this gap. The pronounced geographical divide, with Latin American supply and Asian demand, not only sustains long-haul trade routes but also amplifies vulnerabilities to maritime disruptions and tariff fluctuations.
Mordor Intelligence provides coverage of the silver market across other key regional markets. Detailed country-level analysis extends to Indonesia incorporating local coverage and market participation, as required.
Regulatory Landscape
Silver market activity is shaped by mining-environment compliance, trade controls, and financial-market oversight, which together affect refined availability and inventory behavior. In 2024, the U.S. Environmental Protection Agency tightened dissolved-silver limits for tailings discharge, raising water-treatment requirements for polymetallic mines in states such as Nevada and Alaska. Peru has also applied more stringent discharge mandates in some regions, which has increased capex and extended permitting timelines for new capacity.
On the downstream and trading side, traceability and market-access requirements are tightening. The London Bullion Market Association (LBMA) updated its silver code of conduct in March 2026 to strengthen responsible sourcing expectations, including transaction-level traceability for institutional flows. The U.S. Commodity Futures Trading Commission (CFTC) proposed position-limit changes for silver futures in 2026, which can affect hedging and liquidity for industrial buyers and producers. Trade measures add further friction: China has operated export restrictions for silver through a limited set of authorized exporters from 2026, and India moved in May 2026 to tighten import handling for investment-grade silver bars via licensing requirements alongside higher effective duties, affecting the timing and form of bullion inflows into a key consumption market.
Value Chain Analysis
The silver value chain starts with mine supply, including primary silver mines and, predominantly, byproduct output from lead-zinc, copper, and gold operations. Concentration and smelting then feed into refining into bullion and high-purity feedstocks. Industry sources indicate that more than 70% of global supply is recovered as a byproduct, linking silver availability to base-metal operating rates and concentrate treatment logistics rather than the silver price alone. Refining and downstream conversion into powders, pastes, and fabricated products are also geographically concentrated, with throughput sensitive to energy pricing and environmental compliance requirements at processing hubs.
Downstream, silver is routed through bullion banks, exchanges, and physical distribution into industrial fabrication (PV metallization pastes, electronics interconnects, solders and brazing alloys) as well as consumer and investment channels (jewelry, silverware, bars and coins). Regulatory and input dependencies can create indirect bottlenecks. For example, disruptions in key chemical inputs used in hydrometallurgy and leaching circuits can constrain byproduct recovery at copper-linked operations. Separately, evolving reporting standards, including JORC 2012 and NI 43-101 practices that emphasize economically extractable resources, influence how reserves and project pipelines are disclosed and financed.
Competitive Landscape
The silver market exhibits a highly fragmented. Technology upgrades, including sensor-based ore sorting and bacterial oxidation, boosted recovery at Coeur Mining’s Rochester expansion, illustrating how incremental metallurgical gains can add millions of ounces with minimal new footprints. ESG pressures are reshaping capital access; companies certified under ISO 14001 and the Cyanide Code now command lower financing spreads and preferred offtake contracts, nudging laggards toward faster compliance. Looking ahead, the silver market could see gradual consolidation as mid-tier miners merge to pool ESG spending and counter volatile margins, yet the prevalence of by-product output will keep true oligopoly out of reach.
Silver Industry Leaders
-
Fresnillo plc
-
KGHM
-
Newmont Corporation
-
Hindustan Zinc
-
Pan American Silver Corp
- *Disclaimer: Major Players sorted in no particular order
Silver Market Companies Covered in this Report
- Americas Gold & Silver Corporation
- Avino Silver & Gold Mines Ltd.
- Coeur Mining, Inc.
- First Majestic Silver Corp.
- Fortuna Silver Mines Inc.
- Fresnillo plc
- Glencore
- Hecla Mining Company
- Hindustan Zinc
- Hochschild Mining PLC
- Honey Badger Silver Inc
- IMPACT Silver Corp.
- Industrias Peñoles
- KGHM
- MAG Silver Corp
- Newmont Corporation
- Orla Mining Ltd.
- Pan American Silver Corp
- Polymetal International plc
- Royal Gold Inc.
- Silvercorp Metals Inc.
- SSR Mining Inc.
- Wheaton Precious Metals Corp.
Market Opportunities and Future Outlook
Industrial end-use pull is opening space for higher-value, specification-driven silver products instead of undifferentiated bullion. The report context points to silver loading in photovoltaic metallization, 5G components, and HV-DC charging connectors, which favors suppliers that can consistently deliver fine silver and engineered powders or pastes with tight impurity control for electronics and PV manufacturing supply chains focused in Asia-Pacific. At the same time, antimicrobial coatings in food packaging moved beyond pilots in North America in 2025, and the European Commission has indicated tighter life-cycle assessment requirements for such coatings starting in 2027. That regulatory direction supports formulation and compliance services aimed at reducing nanoparticle discharge concerns.
On the supply side, opportunities center on projects and processing upgrades that increase recoverable ounces without a proportional expansion of footprint, along with improved payable metal through better concentrate quality and refining terms. Fresnillo provides a near-term signal through its published 2026 attributable silver production guidance of 42.0 to 46.5 million ounces, and Pan American Silver has advanced the La Colorada Skarn concept around a 15,000 tpd plant plan, reflecting how brownfield and skarn development can reshape future output profiles. Recycling continues to represent an under-penetrated lever within the current supply mix, and buyers' growing focus on traceability frameworks, including LBMA conduct updates in 2026, supports the business case for verified recycled-silver streams from electronics and industrial scrap.
Recent Industry Developments in Silver Market
- May 2026: KGHM Polska Miedz S.A. outlined targets in an investor presentation in May 2026, aiming for higher silver production in concentrate and higher payable silver sales. The plan strengthens near-term supply expectations and supports margin resilience through higher payable output.
- April 2026: Fresnillo plc reported Q1 2026 attributable silver production of 11.1 million ounces. The result provides an early 2026 production snapshot and reflects continued optimization and cost-control focus that influence the silver supply trajectory.
- February 2026: Newmont Corporation issued 2026 guidance for 32 million ounces of silver, with Peñasquito expected to increase silver production by more than 10 percent. The outlook signals stronger output at a key asset, shaping the global supply outlook and capital allocation.
Silver Market Report Scope and Research Methodology
Market Definition and Coverage
For this report, the silver market is sized as the global physical market for silver metal, covering mined and recycled supply that becomes available to end users, and the resulting consumption across industries, tracked in volume terms.
Scope exclusions: Paper trading and purely financial instruments linked to silver prices are excluded, since they do not represent physical metal flow.
Segments Covered in This Report
- By Type
- Fine Silver
- Sterling Silver
- Argentium Silver
- Coin Silver
- Other Types
- By Application
- Physical Investment (Bars and Coins)
- Electrical and Electronics
- Photographic Films
- Brazing Alloys and Solders
- Jewelry and Silverware
- Pharmaceuticals and Biomedical
- Other Applications
- By Geography
- Production Analysis
- United States
- Argentina
- Australia
- Bolivia
- Chile
- China
- India
- Mexico
- Peru
- Poland
- Russia
- Rest of the World
- Consumption Analysis
- Asia-Pacific
- China
- India
- Japan
- South Korea
- Rest of Asia-Pacific
- North America
- United States
- Canada
- Mexico
- Europe
- Germany
- United Kingdom
- Italy
- France
- Russia
- Rest of Europe
- South America
- Brazil
- Argentina
- Rest of South America
- Middle-East and Africa
- Saudi Arabia
- South Africa
- Rest of Middle-East and Africa
- Asia-Pacific
- Production Analysis
Data Sources, Market Sizing, and Validation
Desk Research
Desk research helped us build the base fact set around mine supply, recycling availability, and cross-border movement of silver. Public sources reviewed include, for example, USGS Mineral Commodity Summaries, UN Comtrade trade statistics, government mining and customs releases, and central bank or mint publications where physical coin programs affect demand.
We also used industry bodies and technical references, such as the Silver Institute demand and supply commentary, plus peer-reviewed papers that discuss PV silver loadings and electronics usage intensity. Company filings, annual reports, and investor presentations were used to understand capacity, utilization, and operational changes. Paid subscriptions supporting company financials, patent tracking, and shipment-level trade records were used for cross-checks against the public trade series. The sources listed here are not exhaustive, and several other public datasets and documents were used for collection, validation, and clarification.
Primary Interviews and Surveys
Primary interviews and surveys were used to test the reality of the volume flows and the assumptions that connect production, trade, refining, and end use demand. Interviews covered upstream, midstream, and downstream participants, and the inputs were used to confirm timing issues, recycling constraints, and demand shifts in electronics, PV, and jewelry across major regions.
Distribution of primary research fieldwork respondents
| Company type | Respondent position | Region |
|---|---|---|
| Top tier: 32% | CXOs: 13% | APAC: 46% |
| Mid tier: 52% | Functional/Unit leaders: 33% | EMEA: 30% |
| Smaller Players: 16% | Managers: 54% | Americas: 24% |
Market-Sizing & Forecasting
Sizing starts with a top-down build that uses mine production and refining availability, then adjusts for net trade movements to reconstruct the annual global physical silver pool in kilotons. To keep the output grounded, we corroborated results with selective bottom-up approximations, such as roll-ups from a sample of producer disclosures, recycler availability checks, and a few end use volume indicators multiplied by typical loadings.
Inputs used in the model include country-level mine output, estimated recycling contribution, net import and export directionality, industrial demand signals tied to electronics and PV activity, and shifts in coin and bar offtake that change physical withdrawal patterns. Forecasts were developed using scenario analysis around a base case, so changes in PV thrifting, electronics cycles, and byproduct-driven mine supply can be reflected without forcing a single straight trend. Where bottom-up signals were incomplete, gaps were handled through bounded ranges that were narrowed using primary feedback on utilization and shipment timing.
Data Validation & Update Cycle
Validation is completed through checks that compare modeled volumes against independent signals, including published supply-demand balances, mine production totals, and trade-series breaks. When an abnormal swing appears, it is reviewed against known items such as refinery disruptions, large inventory movements, or policy-driven trade changes, and assumptions are revisited if the variance still cannot be explained.
Before sign-off, the model and narrative go through multi-step analyst review so unit conversions, time-series continuity, and logic are consistent. Reports are refreshed annually, with interim updates when material events shift supply, demand, or pricing conditions. Before delivery, key inputs are rechecked so clients receive the latest updated view.
Mordor Intelligence's Silver Market Size Versus Other Published Estimates
Published market numbers for silver often do not line up because sources measure different things, including mine production, total physical demand, or broader physical supply availability, and they also convert between ounces and tons in different ways. Another reason is that some sources publish a point-in-time figure, while others align figures to a full-year average that includes revisions.
In a refresh-led market like silver, the timing of currency conversion, the use of average realized price versus spot snapshots, and how late trade and production updates are absorbed can shift the reported total. When the annual refresh also rechecks unit conversions and tests the updated price series against supply-demand balances, the total stays stable across years, which is how the modeling is maintained in Mordor Intelligence.
Benchmark comparison
| Source | Market Size | Gaps in Research Methodology |
|---|---|---|
| Mordor Intelligence | USD 0.04 B (2026) | |
| Industry Association A | USD 0.03 B (2024) | Often presented as total physical demand in ounces for a single year, which can mix investment-led swings with industrial offtake and does not always align to a consistent average-price and revision window. |
| Government Statistics B | USD 0.03 B (2025) | Typically focused on mined output, which can omit recycled supply and net trade effects, and it can lag in reflecting refined availability when mine grades or byproduct streams shift. |
Overall, the difference across publishers is mainly driven by what part of the physical flow is counted and how timing and unit conversions are handled. Using repeatable update steps, clear volume-to-value conversion assumptions, and cross-checks against independent supply-demand signals helps keep the final market size traceable to practical inputs.
Key Questions Answered in the Report
How big is the silver market in 2031?
Silver industry is forecasted to reach 49.54 kilotons by 2031, expanding at a 4.62% CAGR.
Which region will lead consumption growth through 2031?
Asia-Pacific, supported by Chinese photovoltaic manufacturing and Indian imports, is projected to grow at a 4.91% CAGR.
Which segment holds the largest silver market share?
Fine Silver commanded 71.62% of volume in 2025 because of its role in industrial and investment flows.
Why is silver critical for next-generation EV charging?
HV-DC fast chargers rely on silver-plated contacts to handle currents above 500 A without overheating, leveraging silver’s 429 W/m·K thermal conductivity.
How are environmental regulations affecting mine supply?
Tighter discharge standards in the U.S., Peru, and Chile are increasing capex and delaying projects, curbing primary-mine output.