
Silicon Carbide Fiber Market Size and Share
Market Overview
| Study Period | 2020 - 2031 |
|---|---|
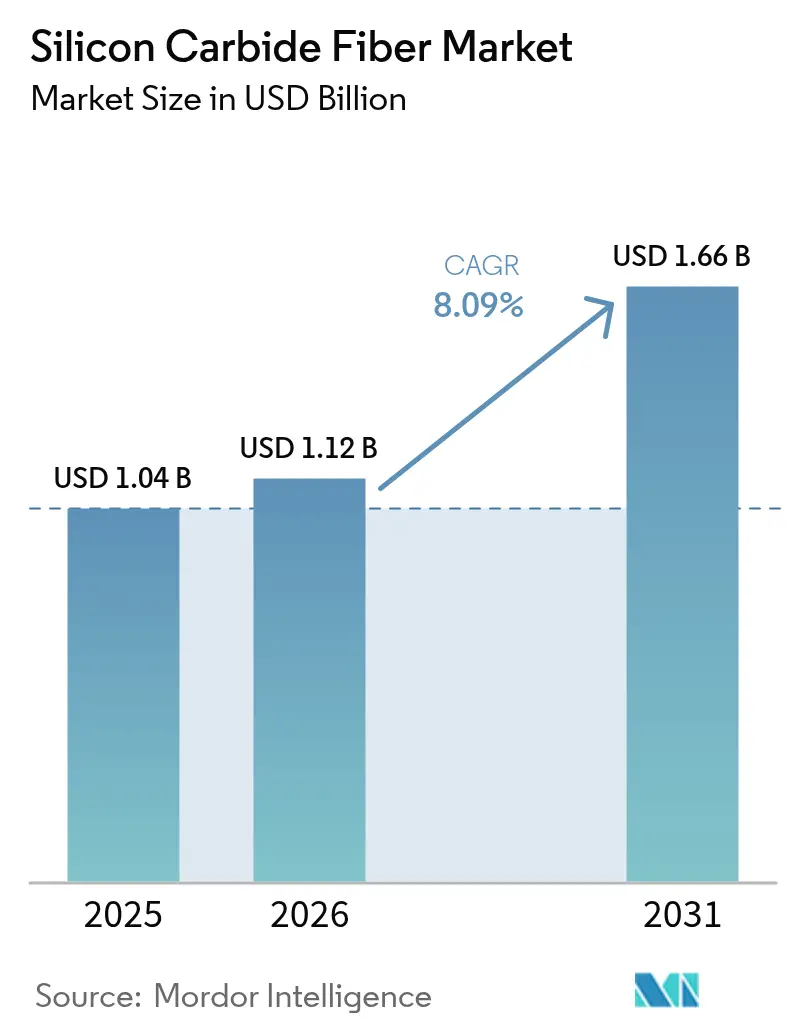
| Market Size (2026) | USD 1.12 Billion |
| Market Size (2031) | USD 1.66 Billion |
| Growth Rate (2026 - 2031) | 8.09 % |
| Fastest Growing Market | Asia Pacific |
| Largest Market | North America |
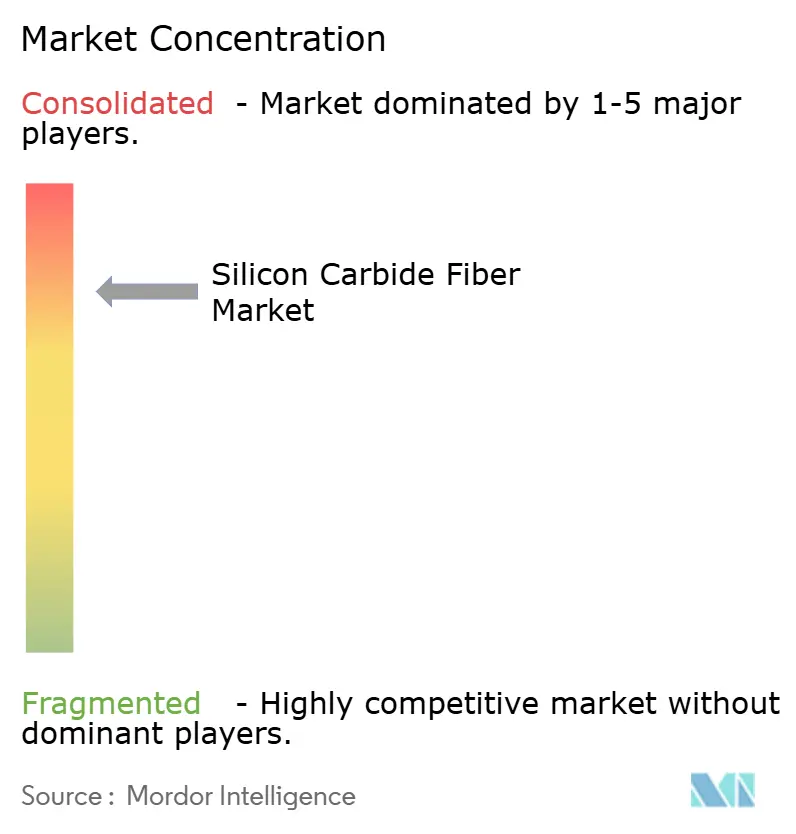
| Market Concentration | High |
Major Players *Disclaimer: Major Players sorted in no particular order Image © Mordor Intelligence. Reuse requires attribution under CC BY 4.0. | |
Silicon Carbide Fiber Market Analysis by Mordor Intelligence
The Silicon Carbide Fiber Market size was valued at USD 1.04 billion in 2025 and estimated to grow from USD 1.12 billion in 2026 to reach USD 1.66 billion by 2031, at a CAGR of 8.09% during the forecast period (2026-2031). Surging adoption of ceramic-matrix composites (CMCs) in next-generation gas-turbine engines, rising demand for high-temperature accident-tolerant nuclear fuel cladding, and rapid progress in electric-mobility thermal-protection systems collectively underpin growth. Continuous fibers dominate structural applications because they preserve tensile strength above 2.8 GPa at 1,600 °C, enabling aerospace engine components to run 250 °C hotter than legacy super-alloys without weight penalties. Woven cloth preforms further accelerate uptake by simplifying lay-up of 3-D reinforcement architectures. Regionally, North America benefits from the first commercial-scale fiber plants in Huntsville, while Asia-Pacific captures the fastest growth as Japanese, South Korean, and Chinese programs scale Polycarbosilane-derived technologies. Competitive intensity centers on proprietary processing know-how rather than volume capacity, causing price points to remain above cost-sensitive thresholds despite incremental cost-down initiatives.
Key Report Takeaways
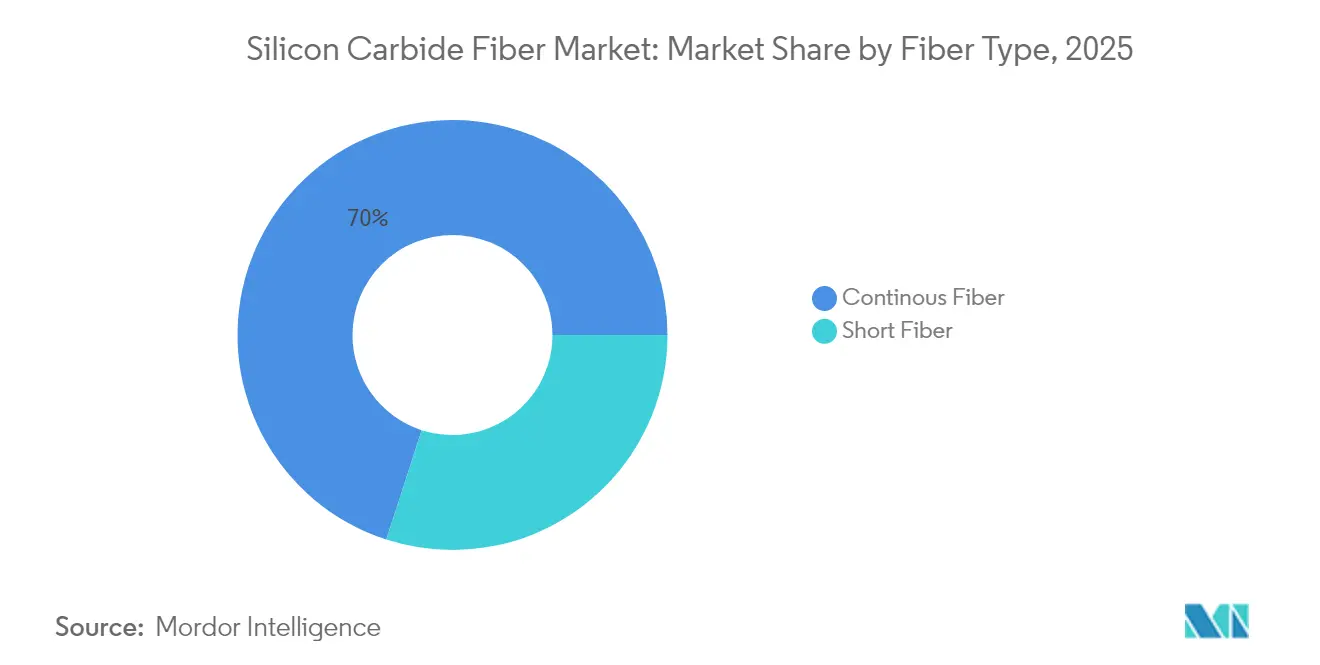
- By fiber type, continuous fiber held 70.02% of the silicon carbide fiber market share in 2025 and is projected to post an 8.63% CAGR through 2031.
- By form, woven cloth preforms accounted for 56.10% of the silicon carbide fiber market size in 2025, while the segment is forecast to expand at an 8.44% CAGR to 2031.
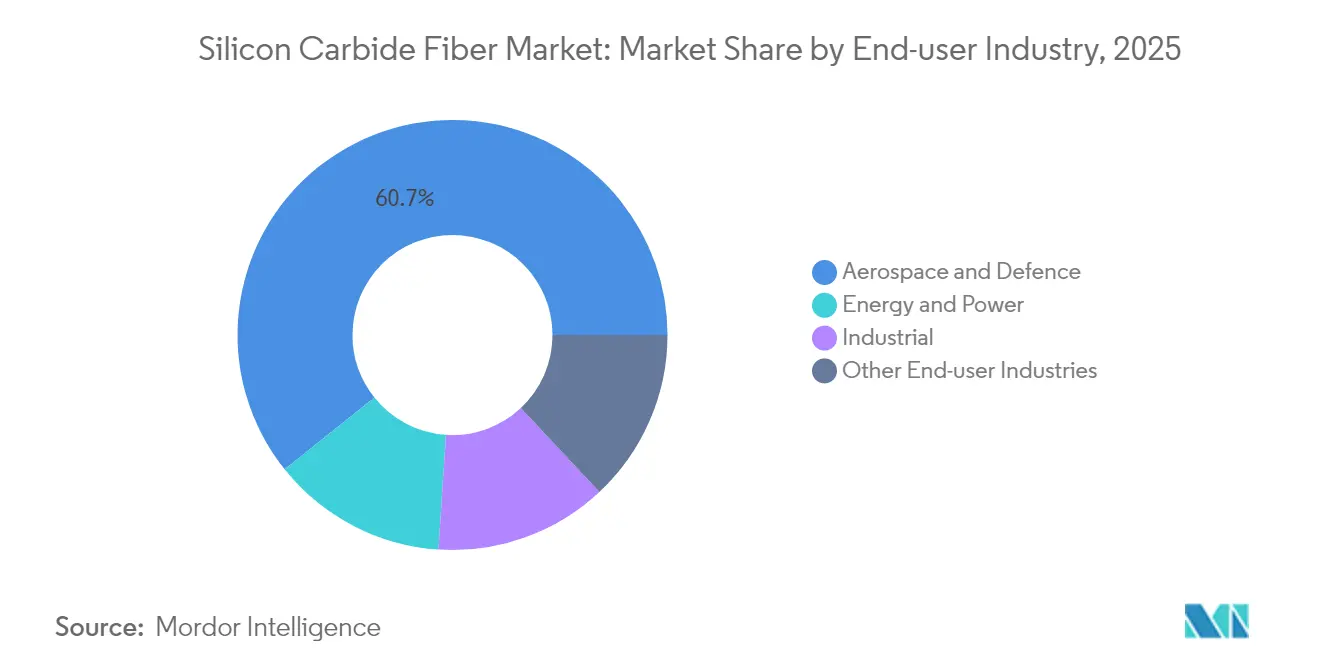
- By end-user industry, aerospace and defense represented 60.74% of the silicon carbide fiber market size in 2025 and is advancing at an 8.78% CAGR through 2031.
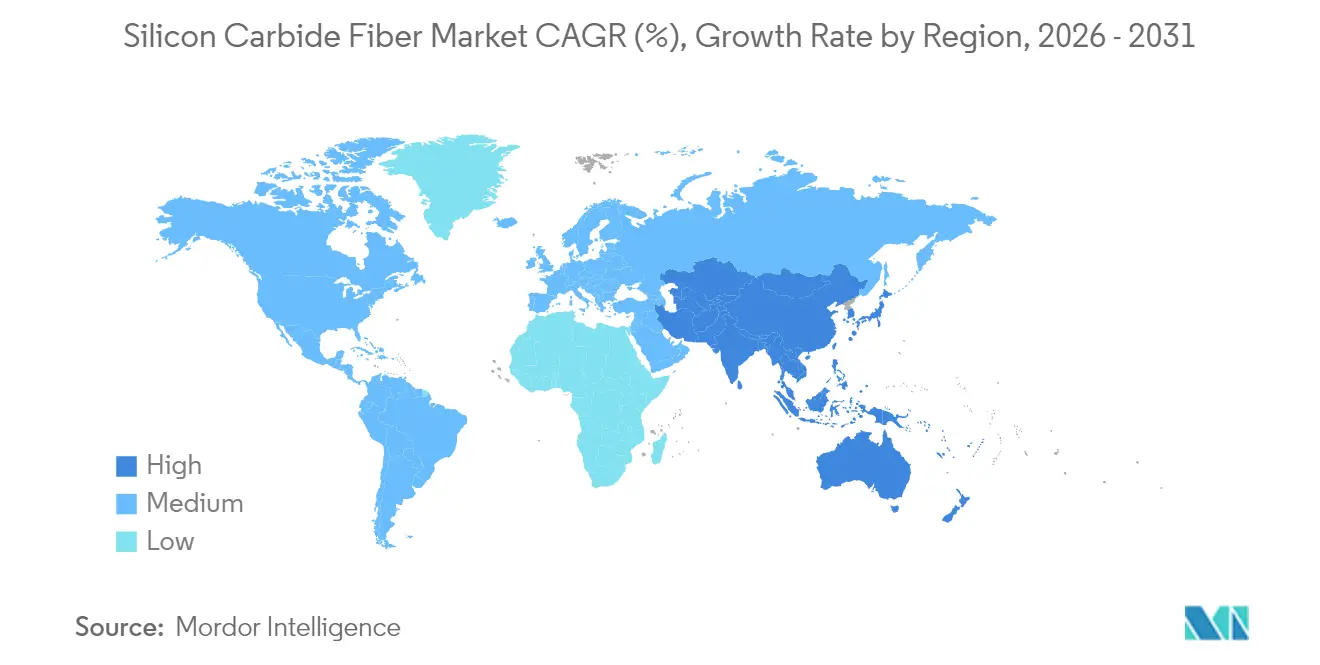
- By geography, North America represented 37.21% of the silicon carbide fiber market size in 2025, while Asia-Pacific is advancing at an 8.70% CAGR through 2031.
Note: Market size and forecast figures in this report are generated using Mordor Intelligence’s proprietary estimation framework, updated with the latest available data and insights as of 2026.
Market Trends and Insights
Drivers Impact Analysis of Silicon Carbide Fiber Market*
| Driver | (~) % Impact on CAGR Forecast | Geographic Relevance | Impact Timeline |
|---|---|---|---|
| Rapid Rise in Commercial and Military Aerospace Engine Production | +2.1% | Global, concentrated in North America and Europe | Medium term (2-4 years) |
| Surging Demand for SiC-Reinforced Ceramic Matrix Composites in Next-Gen Gas Turbines | +1.8% | Global, with APAC manufacturing growth | Long term (≥ 4 years) |
| Nuclear Small Modular Reactor Vendors Adopting SiC Fibers for Accident-Tolerant Fuel Cladding | +1.3% | North America and Europe, expanding to APAC | Long term (≥ 4 years) |
| Lightweighting Push in E-Mobility Thermal-Protection Systems | +0.9% | Global, led by China and Europe | Medium term (2-4 years) |
| Hypersonic-Flight Thermal-Shield Programs Adopting SiC Fibers | +0.7% | North America and China defense programs | Long term (≥ 4 years) |
| Source: Mordor Intelligence | |||
Rapid Rise in Commercial and Military Aerospace Engine Production
LEAP-series CMC shrouds have surpassed 10 million flight hours, validating silicon carbide fiber composites in commercial service. Parallel military adoption is notable; the T901 engine for the UH-60M Black Hawk delivers 1,000 extra shaft horsepower while retaining form factor because SiC CMCs reduce component mass by 50%. Pratt & Whitney has opened a 60,000 ft² CMC center in Carlsbad to accelerate qualification of SiC-reinforced vanes and combustors. Engine OEMs expect more than 1,200 annual LEAP shop visits by 2028, prompting Safran to commit over EUR 1 billion to global maintenance networks. As fleets mature, aftermarket demand secures long-term fiber volumes and justifies continued capacity expansion.
Surging Demand for SiC-Reinforced Ceramic Matrix Composites in Next-Gen Gas Turbines
Gas-turbine makers target firing temperatures above 1,300 °C to raise combined-cycle efficiency, and SiC fibers are pivotal because they retain tensile strength where nickel alloys creep[1]MDPI Editors, “Silicon Carbide Fiber Composites for High-Temp Gas Turbines,” mdpi.com. Steam oxidation once limited CMC lifetimes, but environmental-barrier coatings designed for SiC fibers now extend service beyond 25,000 hours. Hydrogen-fired turbines add further impetus because SiC exhibits superior resistance in high-temperature hydrogen compared with steel. Marine propulsion is another vector: 5 MW compact turbines equipped with SiC liners allow ferry operators to meet IMO Tier III emissions without costly SCR systems. Collectively, power and marine users diversify demand beyond aerospace, smoothing the silicon carbide fiber market growth curve.
Nuclear Small Modular Reactor Vendors Adopting SiC Fibers for Accident-Tolerant Fuel Cladding
General Atomics’ SiGA cladding endured 1,900 °C during 120-day irradiation at Idaho National Laboratory, a milestone for Gen-IV and SMR safety cases. The U.S. Nuclear Regulatory Commission is concurrently reviewing SiC cladding from Framatome and Westinghouse, signaling regulatory momentum toward mid-2030s deployment. Digital-twin modeling cuts qualification cost and time, giving utilities clearer economics for fuel reloads. Japan and South Korea have begun feasibility studies for SiC-based ATF in advanced boiling-water reactors, broadening potential offtake. As SMR vendors finalize designs, firm fiber contracts are expected to lock in base-load volumes, insulating the silicon carbide fiber market from cyclical aerospace swings.
Lightweighting Push in E-Mobility Thermal-Protection Systems
Battery packs exceeding 800 V raise thermal-runaway risk, and automakers now specify SiC fiber cloth barriers capable of 1,300 °C ablation resistance. Early field data show 40% weight reduction versus traditional mica shields without sacrificing flame arrest capability. Carbon-based heat-spreaders doped with SiC fibers improve through-thickness conductivity, lowering peak cell temperatures by 15 °C during fast charging. China’s GB 38031-2020 regulations and Euro NCAP’s 2026 battery-fire protocols intensify focus on robust thermal barriers, driving OEM requests for automotive-grade SiC fabrics. While volumes per vehicle are modest, unit value remains high, adding another profitable niche for suppliers.
Restraints Impact Analysis of Silicon Carbide Fiber Market*
| Restraint | (~) % Impact on CAGR Forecast | Geographic Relevance | Impact Timeline |
|---|---|---|---|
| Ultra-High Production Cost and Capital Intensity | -1.9% | Global, particularly affecting emerging markets | Short term (≤ 2 years) |
| Scale-Up Bottlenecks in Polycarbosilane Precursor Supply | -1.4% | Global, concentrated in Asia-Pacific production | Medium term (2-4 years) |
| Substitution Threat from Cost-Competitive Carbon and Alumina Fibers | -0.8% | Price-sensitive applications globally | Medium term (2-4 years) |
| Source: Mordor Intelligence | |||
Ultra-High Production Cost and Capital Intensity
Four-component polycarbosilane synthesis and 1,800 °C sintering create production costs well above carbon fiber benchmarks. GE Aerospace’s twin Huntsville plants together cost USD 200 million, underscoring steep entry barriers. Energy spending alone can exceed 20% of finished-fiber price because furnaces must maintain oxygen-controlled atmospheres. Research into photosensitive polycarbosilanes shows promise for ambient-pressure curing but remains at pilot scale. Until breakthrough processing or broader volumes dilute fixed costs, the silicon carbide fiber market will stay concentrated among capital-rich incumbents, limiting price elasticity in cost-sensitive sectors.
Scale-Up Bottlenecks in Polycarbosilane Precursor Supply
Less than a dozen facilities worldwide synthesize precursor at required purity, with Japanese suppliers dominating technology. Chemical-vapor curing routes could double throughput yet still face solvent-recovery and exhaust-scrubbing challenges at scale. Research on polyaluminocarbosilane opens diversification, but formulation stability issues have delayed commercialization. Alternating air-vacuum oxidation cycles lower energy intensity by 15% but require specialized furnaces that few producers possess. These constraints expose the silicon carbide fiber market to regional supply shocks and slow the pace at which new entrants can qualify material.
*Our forecasts treat driver/restraint impacts as directional, not additive. The impact forecasts reflect baseline growth, mix effects, and variable interactions.
Silicon Carbide Fiber Market Segment Analysis
By Fiber Type:
Continuous Dominance Drives PerformanceContinuous fibers captured 70.02% of the silicon carbide fiber market share in 2025 and are forecast to grow at an 8.63% CAGR through 2031. Third-generation grades such as Hi-Nicalon S deliver 2.8 GPa tensile strength at 1,600 °C, satisfying aerospace load paths where creep resistance is critical. Manufacturing refinements that suppress abnormal grain growth have raised room-temperature strength toward 4 GPa, widening the design envelope. Continuous filaments also enable winding of nuclear fuel cladding tubes, where hoop stress alignment enhances burst tolerance during loss-of-coolant scenarios. Short fibers remain relevant for polymer infiltration and pyrolysis (PIP) routes that mold complex geometries, especially industrial burner nozzles, but their mechanical ceiling restrains broader structural uptake.
Advances in defect-controlled spinning coupled with surface-oxygen management produce smoother filaments that bond uniformly within SiC matrices. This microstructural harmony boosts interfacial shear by 25%, improving cyclic fatigue life in engine hot-sections. Automated winder upgrades now maintain ±1% roving tension, ensuring repeatable composite thickness in aero-engine flanges. As learning curves flatten, production scrap rates have dropped below 5%, reducing effective cost per kilogram. Continuous fibers consequently underpin most high-value aerospace orders, securing the silicon carbide fiber market a stable revenue core while allowing producers to experiment with lower-grade products for emerging sectors.


By Form:
Woven Architectures Enable Complex ApplicationsWoven cloth preforms represented 56.10% of the silicon carbide fiber market size in 2025 and are tracking an 8.44% CAGR through 2031. Plane, satin, and twill weaves permit 3-D lay-ups that conform to turbine shroud curvature, thereby limiting machining waste. Near-net-shape weaving reduces buy-to-fly ratios to 1.2:1 in some nozzle guide vane programs, translating directly into cost savings at USD 1,000 per kg material rates. Aerospace primes prefer woven cloth because fiber crimp is predictable, yielding uniform porosity for slurry infiltration. Continuous unidirectional tapes still excel where loads are quasi-axial, such as pressure vessels and hypersonic leading edges, yet adoption is curbed by line investment exceeding USD 15 million per head.
Three-dimensional braids now achieve 660 MPa flexural strength after repeated infiltration cycles, enabling stiffened panels that replace metallic honeycomb. Robotic looms support variable-angle fibers, giving designers freedom to tailor stiffness gradients across complex ducting. Hybrid preforms mixing SiC with carbon rovings tackle cost-sensitive exhaust-duct projects by concentrating SiC only in hot spots. Collectively, woven formats sustain the silicon carbide fiber market growth momentum because they slash assembly steps, shorten autoclave cycles, and simplify certification documentation by achieving more homogeneous microstructures.
By End-user Industry:
Aerospace Leadership Drives InnovationAerospace and defense commanded 60.74% of the silicon carbide fiber market share in 2025 and is projected to expand at an 8.78% CAGR through 2031. The segment pays price premiums for SiC CMCs that cut engine weight by 45 kg per LEAP-1A set, improving thrust-to-weight and fuel burn. Military programs amplify demand because thermal margins directly translate into range extension for stealth platforms whose inlets restrict cooling airflow. Energy and power emerges as the fastest-growing secondary sector because industrial gas-turbine OEMs require higher firing temperatures to achieve 65% combined-cycle efficiency targets. Marine applications follow suit as navies retrofit ships with CMC-lined turbines to comply with sulphur emissions limits.
Industrial heaters, chemical reaction tubes, and molten-salt pumps adopt SiC fibers for corrosion-resistant liners that withstand 1,400 °C while resisting fluorine attack. The silicon carbide fiber industry also penetrates automotive battery-pack enclosures and filtration candles for hot gas streams above 900 °C. Nonetheless, aerospace remains the anchor customer segment for the silicon carbide fiber market, underwriting capital investments in spinning lines and precursor facilities that spin off cost reductions benefiting secondary segments.
Geography Analysis
North America Silicon Carbide Fiber Market
North America retained 37.21% of 2025 revenue due to its entrenched aerospace supply chain and government funding for high-temperature materials. The U.S. Department of Energy earmarked USD 150 million for harsh-environment SiC fiber programs, accelerating qualification for power and SMR reactors. Huntsville hosts the first western commercial fiber line, positioning the region as a self-sufficient hub, while Canada’s MDA and Mexico’s Queretaro aero-clusters integrate composites into nacelle structures. The geographic concentration supports early adopter pricing and tight customer feedback loops that advance material iterations.
APAC Silicon Carbide Fiber Market
Asia-Pacific, growing at 8.70% CAGR, benefits from Japanese leadership in polycarbosilane chemistry and expanding Korean aero-engine overhaul networks. UBE Corporation plans to multiply precursor output tenfold this decade to meet domestic and export demand. China scales its aero-engine institute’s SiC CMC test bed for hypersonic glide vehicles, signaling future high-volume consumption once technology transfer hurdles ease. Semiconductor fabrication in South Korea spurs SiC heat-spreader development, anchoring non-aero demand. India and ASEAN nations are yet nascent but show potential as local composites clusters mature.
Europe Silicon Carbide Fiber Market
Europe leverages a robust gas-turbine and automotive footprint to sustain steady demand. STMicroelectronics’ silicon-carbide power-device roadmap necessitates advanced heat spreaders, indirectly boosting fiber uptake. Germany’s engine programs seek 40% efficient microturbines for district heat, requiring SiC liners. The UK funds CMC demonstrators under its Aerospace Technology Institute, widening qualification data sets. Nordic utilities exploring hydrogen co-firing in combined-cycle plants also specify SiC liners. Although current macroeconomic headwinds affect capital spending, Europe’s regulatory focus on emission reduction preserves long-term fiber demand.

Value Chain Analysis
The silicon carbide (SiC) fiber value chain is concentrated and capital intensive, running from specialty chemical inputs (polycarbosilane and other high-purity organosilicon precursors, process gases, and controlled-atmosphere furnace consumables) into fiber spinning, cross-linking, and pyrolysis or thermal conversion. Downstream, the material is converted into textile formats (tows to woven cloth and 3-D preforms) for CMC part fabrication (CVI/PIP/MI routes), followed by finishing and coating, including environmental barrier coating stacks in many hot-section uses. Delivery is then shaped by qualification cycles into turbine engines, defense thermal structures, and nuclear fuel or cladding concepts. The market remains supply constrained for nuclear-grade, high-crystallinity fibers, with Japanese precursor and fiber technology leadership (notably UBE Corporation and NGS Advanced Fibers) shaping global availability, while North American supply security efforts continue to build local capability for aerospace and nuclear programs.
Key bottlenecks sit at the fiber and composite-processing steps, where long fiber production lead times (commonly cited at 8 to 12 months), limited global precursor purity capacity, and dependence on specialized equipment such as oxygen-controlled high-temperature furnaces, autoclaves, and aerospace-qualified CVI reactors can slow throughput. A notable process inflection is the move away from high-cost electron-beam irradiation cross-linking toward alternatives, including air-oxidation cross-linking approaches highlighted by newer third-generation fiber announcements (for example, Hunan Zerui New Materials products presented in June 2025) and pilot work on continuous thermal conversion systems (demonstrated by GA-EMS with The Nonwovens Institute and Harper International in January 2026). Export controls and security restrictions (for example, ITAR in the United States and similar regimes in Europe and Japan) further shape sourcing by encouraging regionalization of supply, particularly for defense and nuclear applications.
Competitive Landscape
The silicon carbide fiber market remains technologically consolidated; knowledge of precursor synthesis and controlled atmospheres outweighs simple scale in conferring advantage. Japanese firms NGS Advanced Fibers and UBE Corporation dominate polycarbosilane IP while maintaining reputations for sub-1% defect rates, securing long-term supply contracts with aero primes. GE Aerospace’s USD 200 million vertically integrated campus links fiber spinning with prepreg lay-up, enabling closed-loop quality control that accelerates engine certification. General Atomics focuses on nuclear applications; its SiGA cladding captures premium pricing on the basis of 1,900 °C survivability.
Process innovation shapes rivalry. MATECH’s field-assisted sintering densifies CMC panels in minutes, delivering 20× ablation resistance relative to silica-phenolic baselines. Safran integrates braiding robotics to cut lay-up labor by 30%, while Specialty Materials introduces oxygen-gradient fibers that dampen matrix micro-cracks. White-space opportunities center on hypersonic vehicle nose tips and e-mobility fire-barrier panels, niches that reward agile R&D pipelines. Patent filings reveal that top five producers control more than 70% of high-temperature coated-fiber claims, deterring commoditization.
Collaborative programs bridge regional gaps. U.S.–Japan research under the Monosozukuri partnership explores faster precursor curing, and EU’s Clean Aviation initiative funds endurance testing of SiC vane inserts. Yet entrants still face steep capital outlays and decade-long qualification timelines, preserving high entry barriers. Consequently, suppliers with vertically integrated capabilities and end-market diversification hold pricing power even as volumes climb, cementing their positions through 2030.
Silicon Carbide Fiber Industry Leaders
GE Aerospace
NGS Advanced Fibers Co., Ltd
Specialty Materials Inc.
COI Ceramics
Safran Ceramics
- *Disclaimer: Major Players sorted in no particular order
Silicon Carbide Fiber Market Companies Covered in this Report
- BJS Ceramics GmbH
- COI Ceramics
- GE Aerospace
- General Atomics Electromagnetic Systems
- Haydale Graphene Industries plc
- MATECH
- NGS Advanced Fibers Co., Ltd.
- Nippon Carbon Co Ltd.
- Safran Ceramics
- SGL Carbon
- Specialty Materials Inc.
- Suzhou Saifei Group Ltd.
- TISICS Ltd.
- TOSHIBA ELECTRONIC DEVICES and STORAGE CORPORATION
- UBE Corporation

Market Opportunities and Future Outlook
Aerospace hot-section CMC platforms remain the anchor for value capture, but funded programs and qualification activity are sharpening several opportunity areas. In the United States, the U.S. Air Force Research Laboratory awarding COI Ceramics a USD 78 million SiC/SiC CMC development contract (January 2026) reinforces near-term pull for higher-temperature-capable fiber and preform supply tied to nozzle and combustor liner work, where fiber performance and coating compatibility drive selection. This program cadence favors suppliers that can provide tightly controlled fiber chemistry, consistent weaving and preform conversion, and documentation packages aligned to engine certification requirements.
Energy applications are widening the addressable space where premium pricing is supported by safety cases and high-temperature endurance, with particular relevance to accident-tolerant nuclear fuel or cladding and fusion materials. GA-EMS has positioned SiGA-focused fiber variants around domestic supply shortages and continues to advance manufacturing approaches that reduce cost and energy intensity, including continuous thermal conversion validated at pilot scale through U.S. DOE-linked technical work. That provides whitespace for producers able to supply nuclear-grade, high-purity fibers beyond the limited pool of established high-crystallinity suppliers. On the supply side, shifting from batch to continuous processing and adopting non-e-beam cross-linking approaches can support additional qualified capacity and shorter cycle times, while downstream opportunities continue to concentrate in weaving and 3-D preforms and in CMC component processing where equipment constraints (CVI reactors and qualified furnaces) can limit throughput even if fiber supply improves.
Recent Industry Developments in Silicon Carbide Fiber Market
- January 2026: General Atomics Electromagnetic Systems (GA-EMS), The Nonwovens Institute, and Harper International demonstrated a pilot-scale continuous thermal conversion system for silicon carbide fiber production. The milestone targets a core industry constraint, namely long lead times and high energy intensity in fiber conversion, and supports cost-down pathways that can expand qualified supply into aerospace and nuclear programs. The collaboration also signals continued U.S. focus on domestic processing capability rather than reliance on a small set of offshore precursor and fiber suppliers.
- September 2025: A patent filing (US20250296886A1) described continuous methods for producing stoichiometric crystalline silicon carbide fibers and referenced COI Ceramics commercially available Sylramic fibers for comparison. The disclosure highlights process and microstructure differentiation as active competitive levers, with attention on crystalline, high-purity fibers suited to extreme turbine and nuclear environments. It also underscores industry interest in scalable continuous production routes as a means to improve throughput and consistency.
- January 2024: General Atomics Electromagnetic Systems received a U.S. Department of Energy contract to develop silicon carbide materials for fusion power plants. The award elevated fusion as a named demand vector for SiC-based materials and reinforced the need for high-temperature, irradiation-tolerant fiber and composite architectures. Program funding at this stage supports early supplier positioning for future qualification work across both fusion and advanced fission supply chains.


Silicon Carbide Fiber Market Report Scope and Research Methodology
Market Definition and Coverage
For this study, the silicon carbide fiber market covers revenue earned from selling SiC fibers used as reinforcement in high-temperature, high-strength composite parts across industrial and defense-linked applications, tracked at the point of manufacturer sales in USD.
Scope exclusions: We exclude downstream fabricated composite components and finished parts pricing, and we also exclude unrelated ceramic fibers that are not SiC.
Segments Covered in This Report
- By Fiber Type
- Continuous Fiber
- Short Fiber
- By Form
- Continuous
- Woven
- By End-user Industry
- Aerospace and Defence
- Energy and Power
- Industrial
- Other End-user Industries
- By Geography
- Asia-Pacific
- China
- Japan
- India
- South Korea
- ASEAN Countries
- Rest of Asia-Pacific
- North America
- United States
- Canada
- Mexico
- Europe
- Germany
- United Kingdom
- France
- Italy
- Spain
- Russia
- NORDIC Countries
- Rest of Europe
- South America
- Brazil
- Argentina
- Rest of South America
- Middle-East and Africa
- Saudi Arabia
- South Africa
- Rest of Middle-East and Africa
- Asia-Pacific
Data Sources, Market Sizing, and Validation
Desk Research
Desk research was used to set the boundaries of what counts as SiC fiber revenue, and then to build the first demand map by application and region. We relied on public sources such as U.S. Geological Survey materials coverage, U.S. Department of Commerce trade and export data, Eurostat trade statistics, World Bank macro indicators, and International Energy Agency energy equipment outlooks to anchor the external environment and end-use momentum.
To keep assumptions practical, we also reviewed company annual reports, investor presentations, patent databases, peer-reviewed materials journals, and releases from relevant aerospace and composites associations where available. A paid subscription for company financials and intelligence helped confirm manufacturer footprints, capacity announcements, and consolidation events, and then news and financials screening was used to time-check those moves. These examples are not exhaustive, and many other public sources were referred to for data collection, validation, and research clarification.
Primary Interviews and Surveys
Primary work focused on validating which end uses are actually consuming SiC fiber today, the purchasing units used (fiber tows, woven forms, and preform inputs), and how pricing changes with grade, order size, and qualification status. We spoke with a mix of manufacturers, composite processors, distributors, and technical experts across APAC, EMEA, and the Americas so gaps from desk research could be closed and key assumptions could be checked before finalizing the model.
Distribution of primary research fieldwork respondents
| Company type | Respondent position | Region |
|---|---|---|
| Top tier: 25% | CXOs: 15% | APAC: 45% |
| Mid tier: 60% | Functional/Unit leaders: 31% | EMEA: 29% |
| Smaller Players: 15% | Managers: 54% | Americas: 26% |
Market-Sizing & Forecasting
Sizing started with a top-down build where end-use demand pools were reconstructed from aerospace and defense production signals and high-temperature industrial adoption indicators, and then translated into implied SiC fiber consumption and value. To keep the totals realistic, we corroborated the output with selective bottom-up checks, including sample supplier revenue roll-ups, channel discussions on typical shipment lots, and ASP times volume sanity checks for key forms.
Several inputs were tracked because they move the market in a visible way, such as composite penetration in hot-section and structural parts, qualification cycle timing for new programs, relative pull from aerospace and defense versus energy and industrial uses, capacity utilization changes at fiber plants, and the typical ASP spread between continuous fiber and woven or preform-related products. Where bottom-up data was missing for smaller suppliers or emerging end uses, gaps were handled through conservative share allocation based on manufacturing presence and confirmed application activity.
For forecasting, scenario analysis was used, with growth paths tied to program build rates, new material qualification milestones, and expected pricing progression by grade. Assumptions were then adjusted using expert consensus so the final curve reflects what can be produced and absorbed, not only what is theoretically possible.
Data Validation & Update Cycle
Validation was done by comparing model outputs against independent signals, such as end-use build indicators, capacity additions, and observed pricing direction, and then checking for variances outside a reasonable range. If a number looked off, the input chain was re-checked, and follow-up outreach was triggered to confirm whether the issue was volume, scope, or pricing.
A multi-step internal review is followed so the assumptions, calculations, and year-to-year movements are consistent before sign-off. The report is refreshed annually, and interim updates are made when material events occur, such as major capacity changes, sharp currency moves, or step-changes in aerospace and defense ordering. Before delivery, a final pass is completed so clients receive the most current view available at that time.
Mordor Intelligence's Silicon Carbide Fiber Market Size Compared Against Other Published Estimates
Published market sizes for silicon carbide fiber do not always match, even when they appear to cover the same product set. Differences usually come from how revenue is counted across fiber forms, how quickly ASPs are stepped down or up, and whether the latest capacity and program updates are included in the base year.
When the model is refreshed close to the reporting year, currency timing and price normalization choices tend to matter more than people expect, especially for smaller, high-value materials that can swing on a few contracts. In this study, the ASP curve is re-checked with fresh interview inputs and cross-validated against capacity and end-use activity before the final conversion to USD, which helps explain part of the spread versus other figures. This cadence-driven choice is applied by Mordor Intelligence.
Benchmark comparison
| Source | Market Size | Gaps in Research Methodology |
|---|---|---|
| Mordor Intelligence | USD 1.04 B (2025) | |
| Global Consultancy A | USD 1.08 B (2025) | Uses a broader revenue capture that can blend fiber value with adjacent processed forms in some cases, and applies faster near-term ASP escalation assumptions, which lifts the 2025 total slightly. |
| Industry Research House B | USD 1.31 B (2025) | Appears to assume more aggressive adoption and pricing progression across multiple end uses over the same base year, and the cross-checking against capacity and qualification timing is not clearly stated, which can inflate the starting value. |
Looking at the three values together, most of the gap is not about whether demand exists, it is about how pricing and scope boundaries are handled in the base year. By keeping the revenue point consistent and using repeatable checks tied to capacity, qualification status, and end-use momentum, we keep the estimate traceable to clear inputs that can be revisited on the next refresh.


Key Questions Answered in the Report
What is the current value of the silicon carbide fiber market?
The silicon carbide fiber market size reached USD 1.12 billion in 2026.
Which segment holds the largest share of the silicon carbide fiber market?
Continuous fiber leads with 70.02% share in 2025.
What CAGR is forecast for the silicon carbide fiber market from 2026 to 2031?
The market is projected to expand at an 8.09% CAGR over the period.
Why are silicon carbide fibers important for aerospace engines?
They allow gas-turbine components to run 250 °C hotter while cutting weight by up to 50%, improving fuel efficiency and thrust margins.
Which region is growing fastest in the silicon carbide fiber market?
Asia-Pacific is advancing at an 8.70% CAGR, driven by Japanese precursor capacity expansions and rising aerospace manufacturing in South Korea and China.
Page last updated on:


 Your data is secure and never sold or shared.


