
Silica Market Size and Share
Market Overview
| Study Period | 2025 - 2031 |
|---|---|
| Market Volume (2026) | 584.79 Million tons |
| Market Volume (2031) | 794.03 Million tons |
| Growth Rate (2026 - 2031) | 6.31 % |
| Fastest Growing Market | Asia Pacific |
| Largest Market | Asia Pacific |
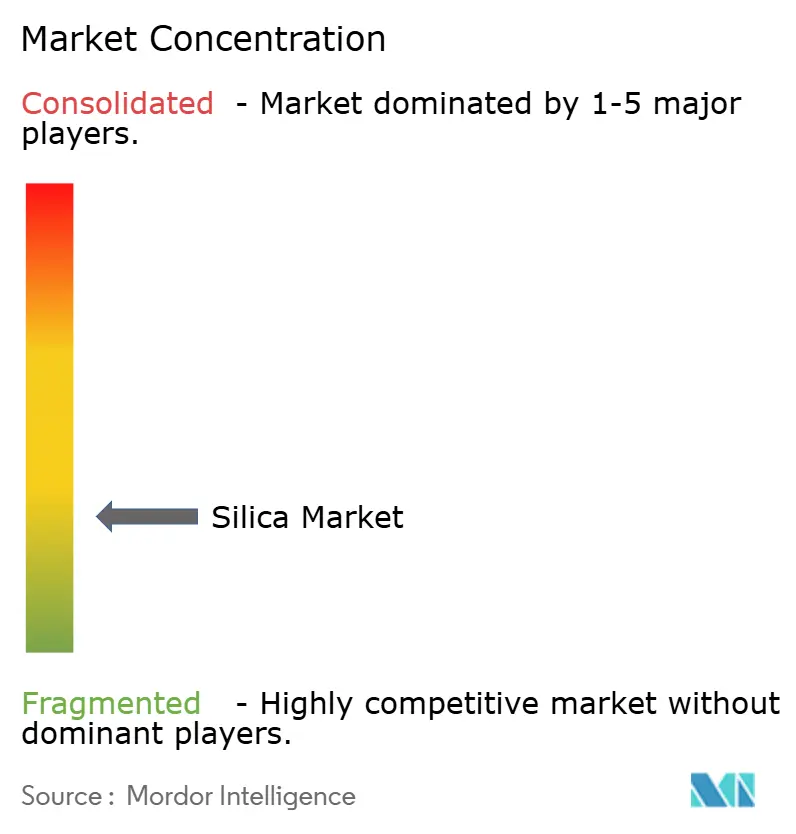
| Market Concentration | Low |
Major Players *Disclaimer: Major Players sorted in no particular order Image © Mordor Intelligence. Reuse requires attribution under CC BY 4.0. | |
Silica Market Analysis by Mordor Intelligence
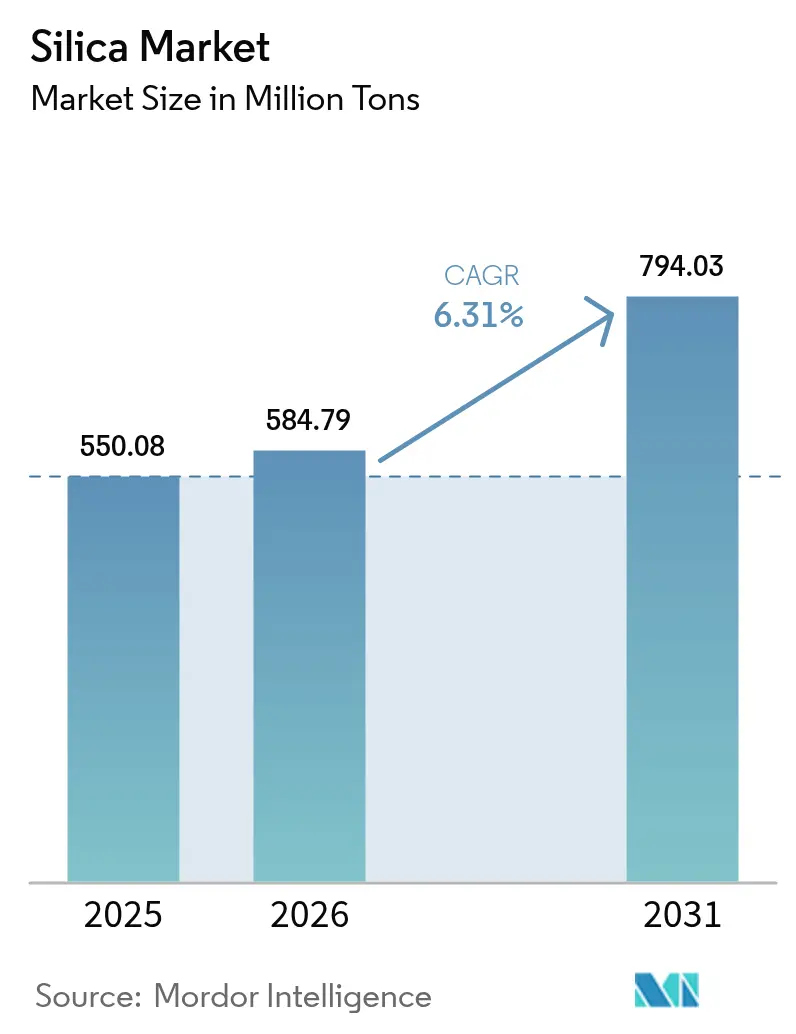
The Silica market size is expected to grow from 550.08 Million tons in 2025 to 584.79 Million tons in 2026 and is forecast to reach 794.03 Million tons by 2031 at 6.31% CAGR over 2026-2031. This robust expansion mirrors the mineral’s central role in construction materials, energy-efficient tires, solar glass, and semiconductor substrates. Rising infrastructure spending in Asia-Pacific, the global push for low-rolling-resistance tires, and accelerating photovoltaic build-outs are amplifying demand, while specialty-grade suppliers secure pricing premiums through high-purity and surface-modified offerings. Freight-cost volatility and occupational-health regulations temper growth, yet investment in bio-based processing and regional beneficiation reinforce a resilient long-term outlook for the silica market.
Key Report Takeaways
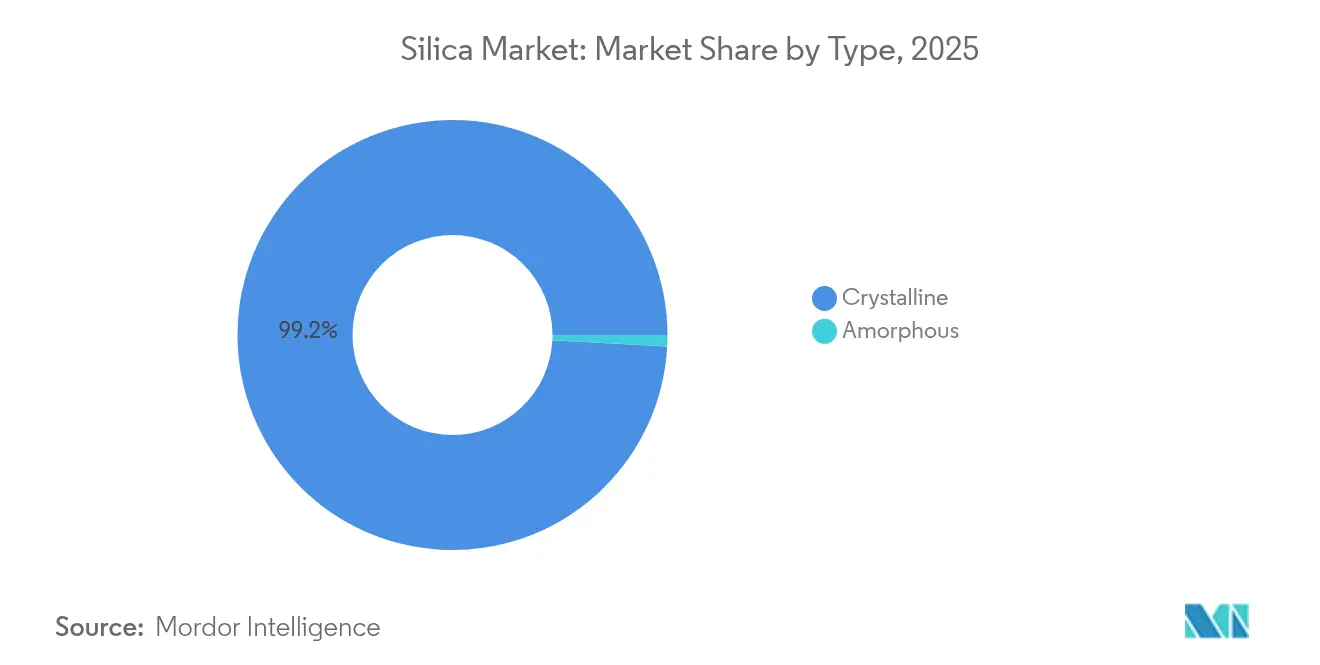
- By type, crystalline silica held 99.15% of silica market share in 2025 and is advancing at a 6.22% CAGR through 2031.
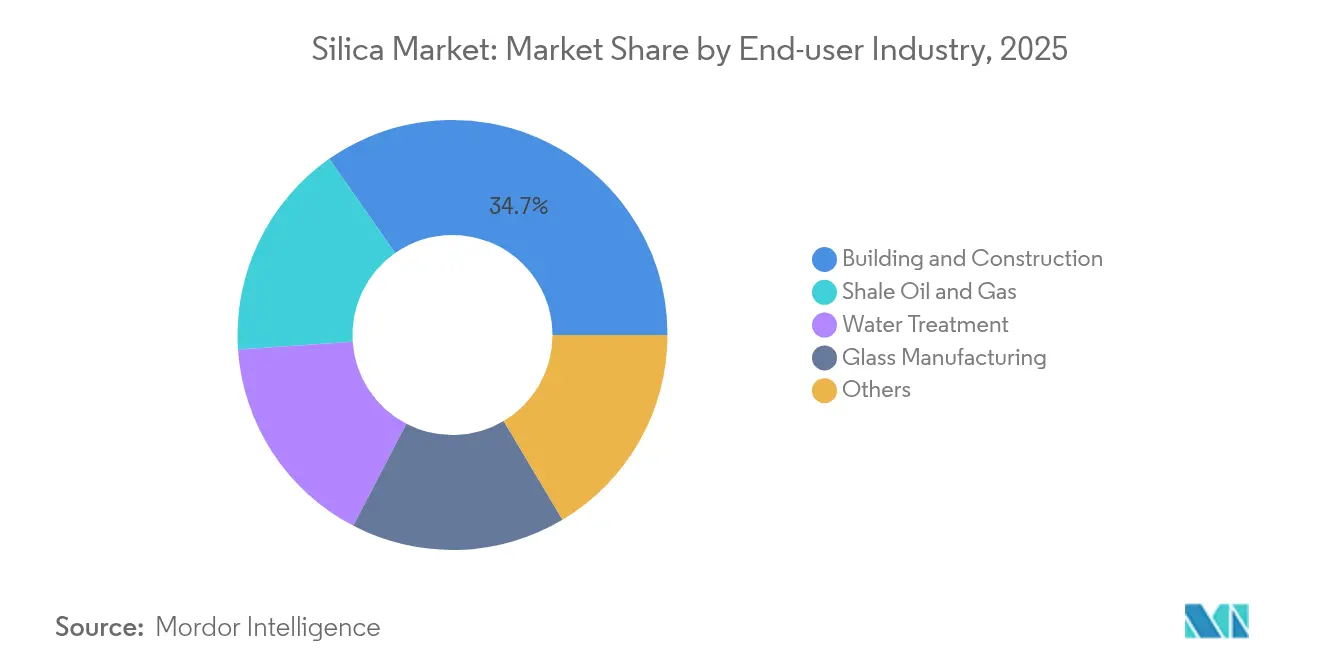
- By end-user industry, building and construction accounted for 34.72% of the silica market size in 2025, while shale oil and gas is projected to expand at a 7.62% CAGR between 2026 and 2031.
- By geography, Asia-Pacific commanded 41.00% of the silica market share in 2025 and is growing at an 8.10% CAGR to 2031.
Note: Market size and forecast figures in this report are generated using Mordor Intelligence’s proprietary estimation framework, updated with the latest available data and insights as of 2026.
Market Trends and Insights
Drivers Impact Analysis of Silica Market*
| Drivers | (~) % Impact on CAGR Forecast | Geographic Relevance | Impact Timeline |
|---|---|---|---|
| Green-tire demand for precipitated silica | +1.5% | Europe, North America, China | Medium term (2-4 years) |
| Photovoltaic glass capacity expansion | +0.8% | China, India, Southeast Asia | Long term (≥4 years) |
| High-purity silica for advanced semiconductors | +1.2% | Asia-Pacific, North America, Europe | Short term (≤2 years) |
| Rice-husk silica to cut carbon footprint | +0.9% | India, Thailand, Vietnam | Medium term (2-4 years) |
| Fumed silica for high-solids battery slurries | +1.1% | China, South Korea, Germany | Short term (≤2 years) |
| Source: Mordor Intelligence | |||
Robust Demand for Precipitated Silica in Energy-Efficient Green Tires
Low-rolling-resistance tires improve fuel economy by 3-7%, and European regulations that mandate tire-efficiency labeling spur higher silica loadings in tread compounds. Premium passenger-car tires now contain up to 90 phr of precipitated silica, double typical 2020 levels. Commercial fleets adopt similar formulations to lower diesel costs, while electric-vehicle makers intensify the trend to extend driving range.
Ongoing Build-Out of Photovoltaic Glass Manufacturing Capacity
Each gigawatt of solar deployment requires 15,000-20,000 tons of ultra-clear silica-based glass with iron content below 120 ppm. China commands over 85% of global PV-glass capacity and is pairing new float-glass lines with captive silica-beneficiation plants to guarantee feedstock quality. Thinner bifacial-panel glass further tightens purity specifications, driving investment in advanced beneficiation[1].
Rising Adoption of High-Purity Silica in Advanced Semiconductor Nodes
Sub-3 nm logic chips need metallic-impurity levels below 1 ppb in CMP slurries, photomasks, and underfill materials. Evonik’s USD 220 million Michigan expansion targets this niche, where electronics-grade material secures 3-5 times commodity pricing. U.S. and European fabs seek local supply to de-risk Asian dependence[2].
Shift Toward Bio-Based Rice-Husk Silica in Asia to Cut Carbon Footprint
India alone generates more than 45 million tons of rice husk a year. Controlled combustion yields amorphous silica with 150-300 m²/g surface area, suitable for tire and rubber applications while lowering process emissions by 60%. Government incentives and carbon credits promote commercial adoption.
Restraints Impact Analysis of Silica Market*
| Restraints | (~) % Impact on CAGR Forecast | Geographic Relevance | Impact Timeline |
|---|---|---|---|
| Competitive threat from aluminosilicate and calcium-silicate fillers | -0.7% | Global, with higher impact in cost-sensitive applications | Medium term (2-4 years) |
| Volatility in freight cost for bulk silica sand | -0.4% | Global, particularly affecting long-distance trade routes | Short term (≤ 2 years) |
| Tightening respirable-crystalline-silica exposure limits (OSHA, EU) | -0.3% | North America and Europe primarily | Long term (≥ 4 years) |
| Source: Mordor Intelligence | |||
Competitive Threat from Aluminosilicate and Calcium-Silicate Fillers
Calcined-clay and metakaolin products undercut commodity-grade silica by up to 25% while offering comparable reinforcement in concrete and polymer composites. Suppliers invest in particle-surface treatments that narrow historical performance gaps, with micronized aluminosilicates gaining share in cost-sensitive construction mixes.
Volatility in Freight Cost for Bulk Silica Sand
Dry-bulk rates on trans-Pacific routes swing by 40-60% within quarters, raising delivered costs for glassmakers and construction users. Freight can represent 30% of landed silica value on long hauls, incentivizing regional processing hubs and take-or-pay shipping contracts that sacrifice flexibility for cost stability.
*Our forecasts treat driver/restraint impacts as directional, not additive. The impact forecasts reflect baseline growth, mix effects, and variable interactions.
Silica Market Segment Analysis
By Type:
Crystalline Dominance Drives Volume GrowthCrystalline grades account for 99.15% of the silica market in 2025 and are expanding at a 6.22% CAGR through 2031. Quartz remains indispensable in concrete, glass, and foundry molds thanks to thermal stability and a well-established supply chain. Tridymite and cristobalite fill smaller high-temperature ceramics niches, but their complex phase-conversion processing limits scale. Amorphous grades, while minor by tonnage, command premium pricing in green-tire compounds, high-solids battery slurries, and semiconductor CMP slurries. Specialty suppliers leverage hydrophilic and hydrophobic surface treatments that capture value beyond bulk tonnage.
Elevated environmental scrutiny encourages migration from mined crystalline inputs toward engineered amorphous forms with lower respirable-dust risk. Bio-based rice-husk silica meets this requirement while offering life-cycle carbon savings and proximity to Asian tire-manufacturing centers. Investment in vacuum flash reactors and low-alkali purification lines underscores the strategy of targeting smaller, higher-margin parcels rather than chasing commodity volume. As a result, the silica market continues bifurcating into high-purity, application-specific grades and bulk construction sand, with pricing divergence expected to widen through 2030.

By End-user Industry:
Construction Leadership Meets Energy TransitionBuilding and construction retained 34.72% of the silica market share in 2025 and posts steady tonnage gains aligned with global infrastructure spending. Urbanization in China, India, and Indonesia fuels concrete and flat-glass demand, while European renovation codes elevate high-silica fiber-reinforced mortars that enhance structural durability. In North America, green-building certifications spur uptake of recycled and bio-based silica additives in low-carbon cement blends as architects pursue net-zero targets.
Shale oil and gas stands out with a 7.62% CAGR, reflecting sustained North American fracturing intensity and rising proppant loads per lateral well. Premium-grade Northern White sand, prized for crush strength and sphericity, competes with in-basin sands that reduce haul distances by 500 miles or more. Glass manufacturing maintains mid-single-digit growth as container-light-weighting partly offsets rising beverage and pharmaceutical consumption.
Geography Analysis
APAC Silica Market
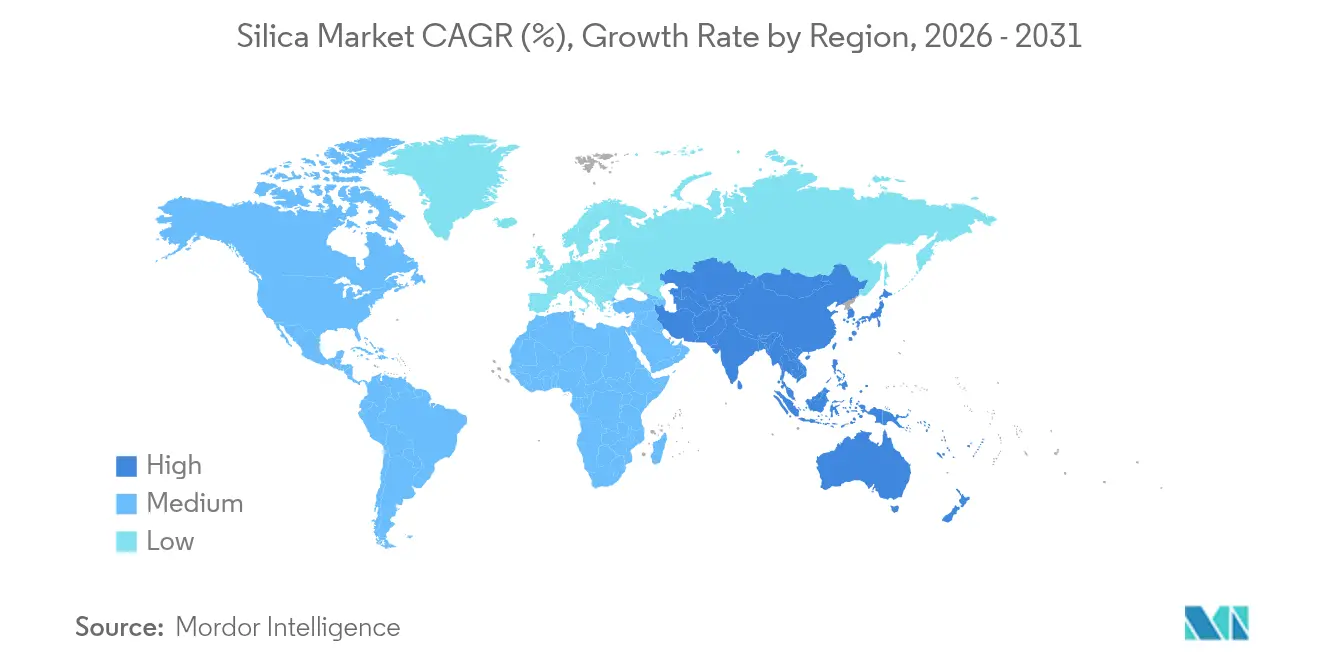
Asia-Pacific dominates the silica market with 41.00% share in 2025 and an 8.10% CAGR to 2031. China consumes over 200 million tons annually across construction, photovoltaic glass, and chemical derivatives, underpinned by strategic reserves and integrated beneficiation hubs. India’s highway expansion and smart-city programs lift domestic demand, while government subsidies accelerate rice-husk silica ventures that feed both local tire plants and export outlets.
North America Silica Market
North America holds a pivotal position in shale proppant supply, with Wisconsin, Texas, and Alberta deposits meeting stringent crush-strength specifications. Regional processing plants shorten supply chains for Gulf Coast glass furnaces, while Canadian producers capture demand from LNG construction and green-hydrogen infrastructure. Regulatory drivers, notably OSHA respirable-silica limits, push miners toward wet-processing and enclosed-handling systems that boost capex but lower insurance liabilities.
Europe Silica Market
Europe presents stable, value-added demand centered on Germany, France, and the United Kingdom. Automotive and chemical users specify high-purity grades, and EU circular-economy directives promote recycled and bio-based inputs. Eastern European suppliers, led by Qemetica’s expanded Polish site, benefit from proximity to both Western OEMs and growing Turkish and North African construction markets. Investments in energy-efficient kiln technology and on-site solar arrays align with EU decarbonization rules, anchoring long-term regional competitiveness.
Value Chain Analysis
The silica value chain starts with resource access and extraction of quartz-rich sand or hard rock deposits, followed by beneficiation (washing, screening, classification, and, for higher-value streams, magnetic separation, flotation, and acid leaching) to meet end-use purity and particle-size specifications. Bulk crystalline silica typically moves through a logistics-intensive pathway via barge, rail, and short-sea/coaster shipping to regional terminals, blending plants, and large consumers such as concrete producers, glassmakers, and foundries. Delivered-cost structure remains sensitive to port and rail availability, as well as weather disruptions.
Downstream conversion steps include production of precipitated, colloidal, and fumed silica through chemical routes, notably sodium silicate and acid precipitation. Input costs, such as sulfuric acid and soda ash, along with utilities, shape margins and pricing. Specialty chains for photovoltaics, semiconductors, and advanced coatings bring tighter QA/QC, traceability, and technical service, and they increasingly benefit from co-location with end-user clusters to reduce lead times and contamination risk. Responsible sourcing and governance are gaining visibility in the upstream portion of the chain, with frameworks such as the OECD due-diligence guidance for responsible sand and silicate supply chains increasing pressure for documentation, controls around informal extraction risks, and stronger supplier qualification across geographies.
Competitive Landscape
The silica market is highly fragmented. Global leaders such as Cabot, Evonik, Wacker Chemie, and PPG’s divested precipitated-silica unit emphasize technology leadership and downstream integration. Regional specialists exploit geological advantages or niche purification know-how, while bio-based entrants pursue low-carbon positioning. Vertical integration gains momentum; glassmakers co-locate beneficiation plants, and tire companies ink long-term offtake deals to lock in precipitated-silica supply. Sustainability differentiates competitive positioning. Companies invest in closed-loop water circuits, low-NOx burners, and rice-husk ash valorization to meet investor ESG metrics.
Silica Industry Leaders
-
Sibelco
-
Covia Holdings LLC
-
Evonik Industries AG
-
QEMETICA
-
U.S. Silica (Apollo Funds)
- *Disclaimer: Major Players sorted in no particular order
Silica Market Companies Covered in this Report
- AGSCO Corp
- AMS Applied Material Solutions
- Cabot Corporation
- China-Henan Huamei Chemical Co. Ltd
- Covia Holdings LLC
- Denka Company Limited
- Evonik Industries AG
- Heraeus Holding
- Kemitura Group
- Madhu Silica Pvt. Ltd
- Merck KGaA
- Mitsubishi Chemical Group Corporation
- Nouryon
- OCI Company Ltd
- QEMETICA
- Sibelco
- Tokuyama Corporation
- U.S. Silica (Apollo Funds)
- W.R. Grace and Co.
- Wacker Chemie AG
Market Opportunities and Future Outlook
The clearest whitespace is in application-specific silica grades where buyers need consistent purity, tailored surface chemistry, and documented sustainability attributes, rather than bulk tonnage. In 2026, corporate capacity moves point to this direction: Nouryon expanded premium Levasil colloidal silica capacity in Guangzhou, China for catalysts and performance coatings, while Evonik brought additional precipitated silica output online at its Charleston, United States site, supported by a 50% capacity uplift, aimed at tire and rubber applications. These actions line up with demand pull from low-rolling-resistance tire formulations, tighter purity requirements in advanced manufacturing, and higher-performance coating and catalyst systems.
A second opportunity pocket is in regionalization and feedstock qualification for high-purity and electronics-adjacent uses, where contamination control and local supply security matter alongside cost per ton. Fusso Chemical Industries disclosed a large capital program (40 billion yen) to build ultra-high purity colloidal silica facilities at its Kyoto plant with a multi-year timeline, indicating sustained investment to meet demanding specifications for CMP and related processes. At the same time, India and Southeast Asia provide scope for bio-based rice-husk silica projects that lower process emissions and shorten supply chains to tire and industrial rubber hubs, while continued photovoltaic glass build-outs sustain demand for ultra-clear silica inputs with controlled iron levels and consistent particle distributions.
Recent Industry Developments in Silica Market
- June 2026: Evonik Industries AG launched commercial production of ULTRASIL eCO after achieving ISCC Plus certification for circular, mass-balance compliant silica at its Adapazari, Turkey site. The expansion increases availability of certified circular silica for tire and rubber customers that are tightening scope 3 and product-footprint requirements.
- May 2026: Covia Holdings LLC announced a price increase of up to 20% for industrial products, effective June 1, 2026, for non-contract customers, citing rising costs. The action underscores ongoing delivered-cost volatility for industrial silica buyers and reinforces the value of contracting, logistics planning, and regional sourcing strategies.
- October 2024: Evonik Industries AG broke ground on a major expansion of precipitated silica capacity at its Charleston, South Carolina site, targeting a 50% capacity increase oriented to the U.S. tire industry. This investment supports localized supply of performance silica used in energy-efficient tire compounds and reduces dependence on longer-distance supply lanes.
Silica Market Report Scope and Research Methodology
Market Definition and Coverage
For this study, the silica market covers the supply and consumption of silicon dioxide materials, counted in volume terms, across industrial uses where silica is a direct input into manufacturing or processing.
Scope exclusions: We exclude downstream finished goods where silica is only a minor additive and not purchased or tracked as a stand-alone silica input.
Segments Covered in This Report
- By Type
- Amorphous
- Fumed/Pyrogenic
- Hydrated
- Crystalline
- Quartz
- Tridymite
- Cristobalite
- Amorphous
- By End-user Industry
- Building and Construction
- Shale Oil and Gas
- Glass Manufacturing
- Water Treatment
- Others
- By Geography
- Asia-Pacific
- China
- India
- Japan
- South Korea
- Malaysia
- Thailand
- Indonesia
- Vietnam
- Rest of Asia-Pacific
- North America
- United States
- Canada
- Mexico
- Europe
- Germany
- United Kingdom
- France
- Italy
- Spain
- Russia
- Nordic Countries
- Turkey
- Rest of Europe
- South America
- Brazil
- Argentina
- Colombia
- Rest of South America
- Middle-East and Africa
- Saudi Arabia
- South Africa
- Nigeria
- Qatar
- United Arab Emirates
- Egypt
- Rest of Middle-East and Africa
- Asia-Pacific
Data Sources, Market Sizing, and Validation
Desk Research
Desk research was used to build the starting structure for the model and to align definitions across regions before the numbers were finalized. Public sources helped us identify demand anchors such as construction activity, glass production, and oil and gas completion intensity, then map those demand anchors back to silica consumption patterns.
We referred to sources such as the USGS minerals statistics, UN Comtrade trade data, World Bank and IMF macro indicators, and energy statistics from agencies such as the EIA and IEA. We also reviewed technical papers from peer-reviewed journals that discuss silica use and processing. In parallel, we reviewed company annual reports, investor presentations, and credible industry press to cross-check capacity additions, plant utilization themes, and any major supply disruptions. Where needed, we used paid subscriptions for company financials and intelligence, shipment-level import and export data, and patent databases to fill gaps around supplier footprints and technology shifts. These examples are not exhaustive, and many other public and paid sources were reviewed for data collection, validation, and clarification.
Primary Interviews and Surveys
Primary work focused on validating how silica moves through the value chain, including producer-side capacity and utilization behavior, distributor channel dynamics, and buying patterns from large end users such as glass, construction materials, and oil and gas services. Expert inputs were also used to confirm regional differences across APAC, EMEA, and the Americas, since trade flows and local supply availability can change the apparent consumption picture.
Distribution of primary research fieldwork respondents
| Company type | Respondent position | Region |
|---|---|---|
| Top tier: 30% | CXOs: 12% | APAC: 44% |
| Mid tier: 52% | Functional/Unit leaders: 38% | EMEA: 30% |
| Smaller Players: 18% | Managers: 50% | Americas: 26% |
Market-Sizing & Forecasting
Sizing is built primarily from a top-down demand pool, where production, trade, and end-use activity indicators are used to reconstruct apparent consumption by region, then converted into silica volumes for the defined scope. To keep the totals realistic, we corroborate the outcome using selective bottom-up checks such as sampled supplier capacity roll-ups, channel checks on regional supply tightness, and sanity tests using typical consumption coefficients.
Key inputs that feed the model include glass and container production indicators, construction output and cement activity signals, shale drilling and completion counts linked to frac sand usage, water treatment and filtration adoption signals, and import and export movements that show when demand is met through trade instead of local production. When a variable is not available uniformly for a smaller country, proxy indicators are used (for example, sector output and trade patterns), and the assumption is then re-tested during interviews before it is applied.
For forecasting, we typically use scenario analysis supported by short trend models, so the outlook reflects how end-use cycles change over time rather than extending one straight-line growth rate. Assumptions around utilization, trade friction, and product mix are reviewed with industry participants, then the scenario weights are adjusted to align with the most widely supported view.
Data Validation & Update Cycle
Validation happens in layers, starting with basic variance checks that compare modeled consumption against production, net trade, and known capacity constraints. When a region shows an unusual jump, we re-check conversion factors, trade timing, and whether a one-off event is being double counted, then the series is reviewed again before sign-off.
Outputs are also compared with independent signals like construction cycles, glass output trends, and drilling activity, since these indicators should move in the same direction as silica demand over time. Reports are refreshed annually, and interim updates are made when material events occur, such as new capacity starts, major shutdowns, or sharp shifts in trade patterns. Before delivery, an analyst performs a fresh pass on the latest data releases so clients receive an updated view.
Mordor Intelligence's Silica Market Size Compared Against Other Published Estimates
Published silica market sizes can look far apart because some studies report the market in USD value while others report it in tons, and that choice alone changes the story. Differences also show up when authors mix silica types or add downstream value that sits outside silica itself, which can inflate the reported number.
Another common driver is how price is treated over time, since average selling prices move with energy costs, logistics, and product mix, and currency conversion timing can shift a USD figure even if volumes are stable. In our work, the refresh cycle is aligned to the latest trade and end-use indicators, and the price deck is re-checked for currency timing and mix shifts before it is locked, which is also where Mordor Intelligence tends to diverge from faster, headline style updates.
Benchmark comparison
| Source | Market Size | Gaps in Research Methodology |
|---|---|---|
| Mordor Intelligence | USD 584.79 M (2026) | |
| Global Research Group A | USD 48.51 B (2024) | Reported as a value market in USD and appears to combine multiple silica forms and end uses into one revenue pool, so the figure is not directly comparable to a volume-first definition and can also reflect pricing assumptions more than consumption changes. |
| Industry Publisher B | USD 40.85 B (2024) | Uses a broad USD valuation and long-horizon projection, which can amplify differences when ASP escalation, currency conversion timing, and downstream inclusion boundaries are not clearly separated from core silica demand. |
The table mainly shows a unit and scope mismatch rather than a simple disagreement on demand. Once the boundaries are lined up and the same unit is used, the remaining spread usually comes from how ASP and currency are updated, plus how tightly volumes are tied back to production, trade, and end-use activity checks.
Key Questions Answered in the Report
What will global silica demand be in 2031?
The silica market size is projected to reach 794.03 million tons by 2031, reflecting a 6.31% CAGR.
Which region is growing fastest?
Asia-Pacific leads with an 8.10% CAGR, supported by construction, electronics, and downstream beneficiation policies.
Why are green tires important for silica suppliers?
Low-rolling-resistance tires use higher precipitated-silica loadings to cut vehicle energy loss, driving incremental specialty-silica volume.
How do occupational regulations affect producers?
OSHA and EU exposure limits require wet-processing, dust-suppression, and monitoring systems that raise operating costs but improve worker safety.
What is the outlook for bio-based rice-husk silica?
Commercial rice-husk ash projects in India and Southeast Asia lower carbon footprints by up to 60% and satisfy regional specialty-grade demand.