
Silanes Market Size and Share
Market Overview
| Study Period | 2020 - 2031 |
|---|---|
| Market Size (2026) | USD 3.46 Billion |
| Market Size (2031) | USD 4.46 Billion |
| Growth Rate (2026 - 2031) | 5.21 % |
| Fastest Growing Market | Asia Pacific |
| Largest Market | Asia Pacific |
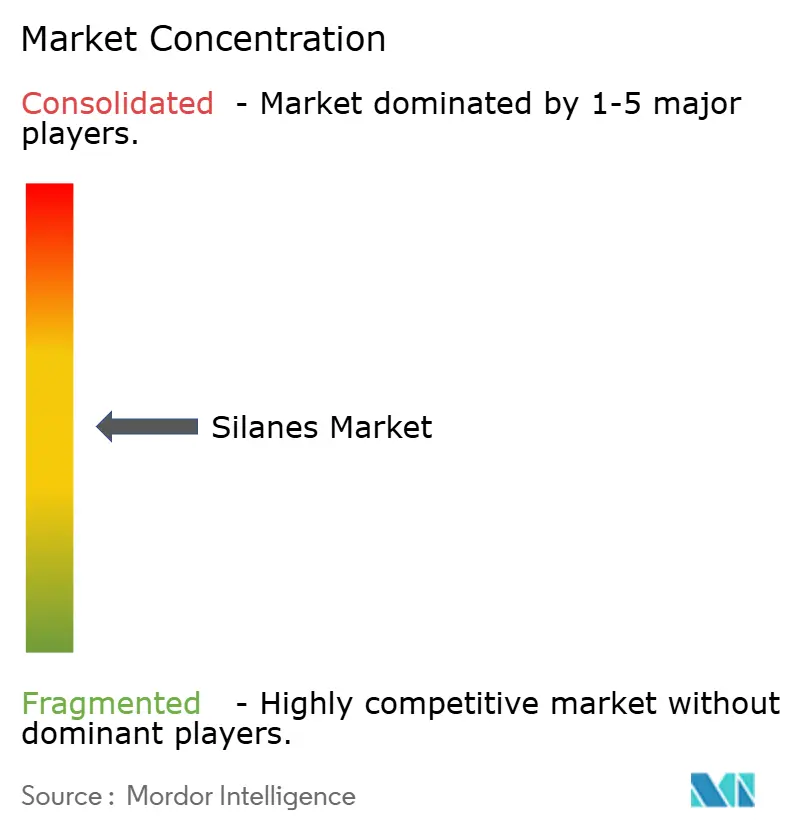
| Market Concentration | Medium |
Major Players *Disclaimer: Major Players sorted in no particular order Image © Mordor Intelligence. Reuse requires attribution under CC BY 4.0. | |
Silanes Market Analysis by Mordor Intelligence
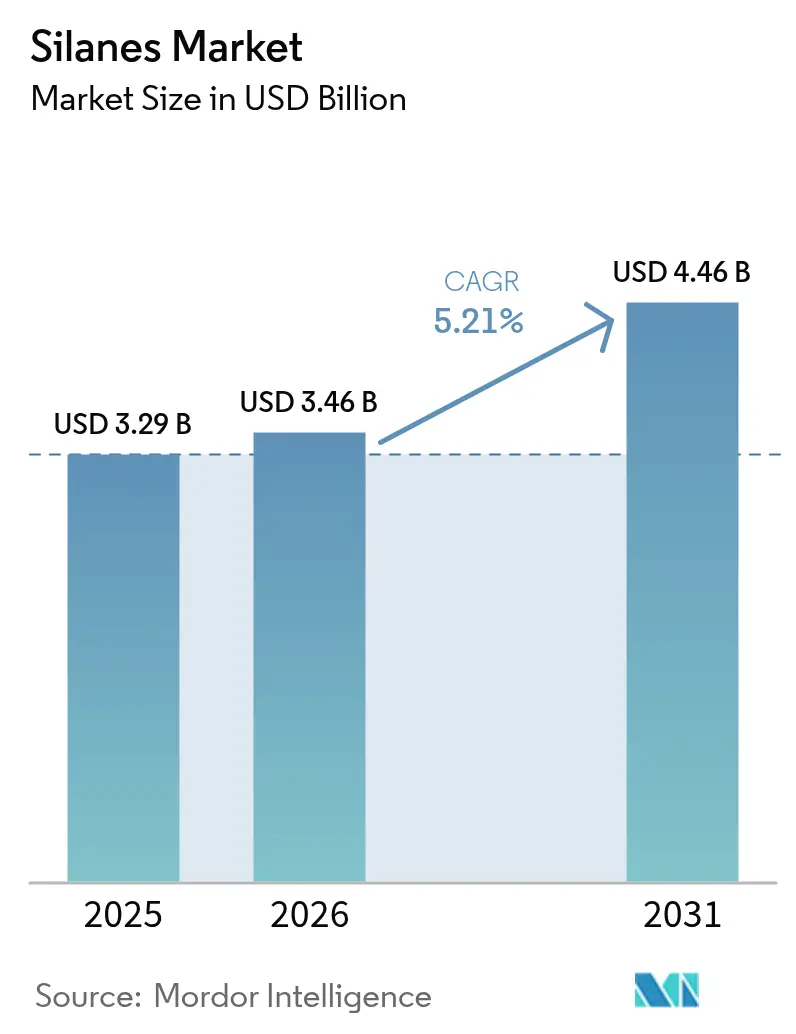
The Silanes Market size was valued at USD 3.29 billion in 2025 and estimated to grow from USD 3.46 billion in 2026 to reach USD 4.46 billion by 2031, at a CAGR of 5.21% during the forecast period (2026-2031). Rising penetration of silane-modified solutions in semiconductor packaging, green tire manufacturing, and waterborne coatings underscores the steady growth trajectory. The material’s ability to chemically bridge organic polymers with inorganic substrates continues to unlock design flexibility in electronics, mobility, and construction. Asia-Pacific’s advanced manufacturing base, sustained infrastructure activity, and supportive policy framework collectively anchor the region’s demand. Parallel R&D programs led by integrated producers such as Dow, Wacker, Evonik, and Shin-Etsu augment application breadth while buffering supply-side risks through backward integration.
Key Report Takeaways
- By functional group, vinyl silanes led with 38.72% revenue share in 2025, whereas mercapto types are projected to expand at a 6.65% CAGR to 2031.
- By application, coupling agents captured 34.62% of the silanes market share in 2025; anti-corrosion treatments are poised for the highest 6.41% CAGR through 2031.
- By end-user industry, paints and coatings accounted for 29.95% share of the silanes market size in 2025, while the “Others” segment—covering energy storage and agrochemicals—advances at a 6.78% CAGR.
- By geography, Asia-Pacific commanded 46.10% of global demand in 2025 and is on track for a 6.48% CAGR to 2031.
Note: Market size and forecast figures in this report are generated using Mordor Intelligence’s proprietary estimation framework, updated with the latest available data and insights as of 2026.
Global Silanes Market Trends and Insights
Drivers Impact Analysis*
| Driver | (~) % Impact on CAGR Forecast | Geographic Relevance | Impact Timeline |
|---|---|---|---|
| Surging paints and industrial coatings demand | +1.20% | Global, with APAC leading growth | Medium term (2-4 years) |
| Electronics miniaturisation and 5G semiconductor packaging | +0.90% | APAC core, spill-over to North America | Short term (≤ 2 years) |
| Light-weighting in electric vehicles tyres and green tires | +0.80% | Global, with early gains in China, Europe, North America | Medium term (2-4 years) |
| Water-borne adhesive adoption in construction | +0.60% | Europe & North America regulatory driven, APAC volume growth | Long term (≥ 4 years) |
| Organofunctional silanes in green hydrogen electrolyser seals | +0.40% | Europe & North America leading, APAC manufacturing | Long term (≥ 4 years) |
| Source: Mordor Intelligence | |||
Surging Paints and Industrial Coatings Demand
Paints and coatings represented 30.22% of the silanes market demand in 2024, a share that reflects infrastructure projects across emerging economies and stricter rules on volatile organic compounds. Water-borne formulations increasingly rely on silane coupling agents for strong adhesion between organic binders and inorganic substrates, a need magnified in marine and heavy-duty environments. California’s architectural-coatings proposal to tighten VOC limits has accelerated reformulation cycles, prompting coating formulators worldwide to adopt low-methanol silane grades[1]. Advanced silane chemistries thus preserve coating durability while helping producers comply with evolving regulations. The resulting pull-through effect fortifies long-range demand visibility for the silanes market.
Electronics Miniaturisation and 5G Semiconductor Packaging
Logic and memory nodes below 7 nm have shifted chip-package interaction stresses, raising the bar for ultra-thin diffusion barriers. Organosilane adhesion promoters safeguard copper interconnects and passivation layers, enabling higher I/O density in fan-out wafer-level packaging. Semiconductor-grade material volumes are climbing in tandem with Asia-Pacific’s foundry expansions, while North American device makers increase local sourcing to mitigate geopolitical risk. This technical dependence embeds electronics as a durable growth locomotive for the silanes market.
Light-weighting in Electric-Vehicle Tires and Green Tires
Global electric-vehicle penetration has stimulated silica–silane coupling systems that lower rolling resistance and curb energy consumption. Bis(triethoxysilylpropyl)-tetrasulfide dominated formulations in 2024, yet new mercapto-sulfur hybrid grades are gaining traction for faster cure cycles and reduced VOC output. Green-tire programs by leading OEMs in China and Europe underpin a tangible mid-term consumption surge, reinforcing automotive as a high-value channel for the silanes market.
Water-borne Adhesive Adoption in Construction
Builders across Europe and North America continue switching from solvent-borne to water-borne sealants to satisfy stringent indoor-air-quality mandates. Silanes bridge polarity gaps between disparate substrates and elevate moisture resistance, traits that translate into longer service life for structural joints. Field trials on concrete surfaces show over 90% reduction in chloride ingress once silane treatments are applied, underscoring their protective credentials. As retrofits and resilient-building standards spread, construction adhesives remain an expanding revenue stream within the silanes market.
Restraints Impact Analysis*
| Restraint | (~) % Impact on CAGR Forecast | Geographic Relevance | Impact Timeline |
|---|---|---|---|
| Stringent REACH limits on VOC and methanol content | -0.70% | Europe primary, global secondary impact | Short term (≤ 2 years) |
| Tetrachlorosilane handling hazards and logistics costs | -0.50% | Global, with higher impact in developed markets | Medium term (2-4 years) |
| Semiconductor-grade silane price volatility | -0.30% | APAC manufacturing hubs, global supply chain | Short term (≤ 2 years) |
| Source: Mordor Intelligence | |||
Stringent REACH Limits on VOC and Methanol Content
The European Chemicals Agency has classified cyclic siloxanes D4, D5, and D6 as persistent and bioaccumulative, compelling suppliers to overhaul product lines ahead of the June 2026 enforcement date[2]. Manufacturers must invest in analytical validation, updated safety-data-sheet management, and plant upgrades, elevating compliance costs across the value chain. Although larger incumbents can absorb these expenses, smaller formulators may curtail operations, thereby moderating short-term capacity additions to the silanes market.
Tetrachlorosilane Handling Hazards and Logistics Costs
Tetrachlorosilane reacts violently with moisture to emit hydrogen chloride, necessitating double-walled tankers and nitrogen-blanketed storage. Insurance premiums and carrier surcharges inflate landed costs, particularly in regions with limited hazardous-material infrastructure. Integrated producers with captive chlorosilane loops retain a cost advantage, while merchant buyers face margin compression. These operational realities weigh on the silanes market’s expansion pace in certain geographies.
*Our forecasts treat driver/restraint impacts as directional, not additive. The impact forecasts reflect baseline growth, mix effects, and variable interactions.
Segment Analysis
By Functional Group: Vinyl Dominance Faces Mercapto Disruption
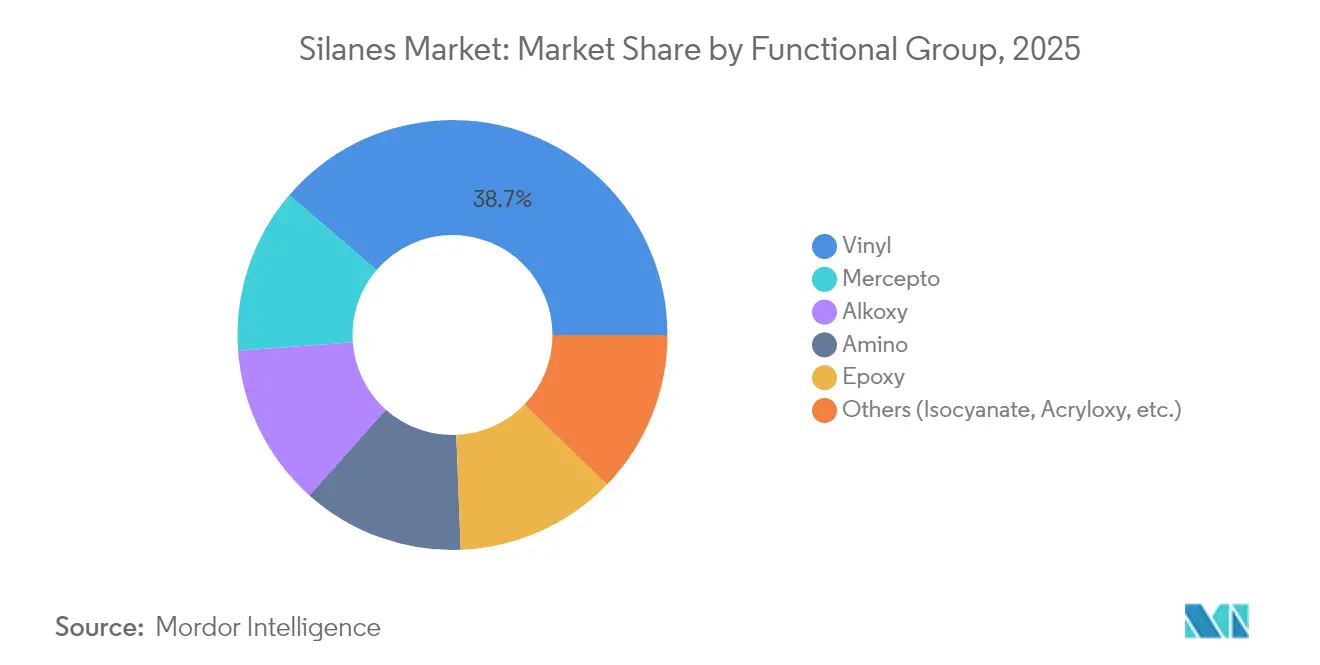
Vinyl silanes captured 38.72% of global demand in 2025, owing to their pivotal role in silica-reinforced tires and glass-fibre composites. Their ability to graft onto filler surfaces while polymerising with rubber matrices ensures low rolling resistance and high wet-grip performance. The silanes market size attributed to vinyl chemistry is projected to advance steadily as mainstream tire producers uphold silica-based tread formulations. In parallel, mercapto silanes are forecast to post the highest 6.65% CAGR through 2031 as electronics and anti-corrosion sectors seek elevated reactivity under mild conditions. Research on dual-silane pre-modified fillers reveals superior crosslink density, indicating that hybrid chemistries could reshape future demand. Amino, epoxy, and alkoxy families continue to secure niche volumes across composites and adhesion-promotion uses, underpinning functional diversity in the silanes market.
Growing environmental focus is driving R&D into low-VOC and methanol-free grades across all functional groups. Vinyl technology benefits from incremental catalyst refinements that cut residual chlorine, while mercapto routes explore sulfur optimization for cleaner curing by-products. Suppliers also advance pre-hydrolysed concentrates that shorten mixing cycles and minimise solvent exposure. Such process innovations elevate customer productivity and tighten performance spreads, ensuring that each functional family retains relevance as the silanes market matures.

By Application: Anti-corrosion Gains Momentum Against Coupling Agents
Coupling agents represented 34.62% of overall revenue in 2025, cementing their status as the backbone of composite and adhesive interfaces. The silanes market share linked to coupling use remains sizeable, given the ubiquity of hybrid materials across automotive, construction, and electronics. However, demand for silane-based anti-corrosion systems is accelerating at a 6.41% CAGR, benefiting from regulatory bans on hexavalent-chromium pre-treatments. Multilayer metal-protection stacks now incorporate silane primers for enhanced barrier properties and paint adhesion, a trend that will amplify volume pull-through. Adhesion-promotion, moisture-scavenging, dispersant, and hydrophobing functions together extend the breadth of silane consumption, reinforcing the silanes industry value proposition across disparate end uses.
Strategic product launches, such as Evonik’s modular Dynasylan SIVO portfolio, underscore a pivot toward customisable anti-corrosion blends that accommodate wide metal substrates while respecting VOC caps. Coatings formulators adopting these systems report shorter process times and lower bake temperatures, attributes that translate into energy savings for manufacturing facilities. These operational advantages resonate strongly in sustainability-driven sectors, maintaining robust growth prospects for anti-corrosion applications within the silanes market.
By End-user Industry: Diversification Beyond Paints and Coatings
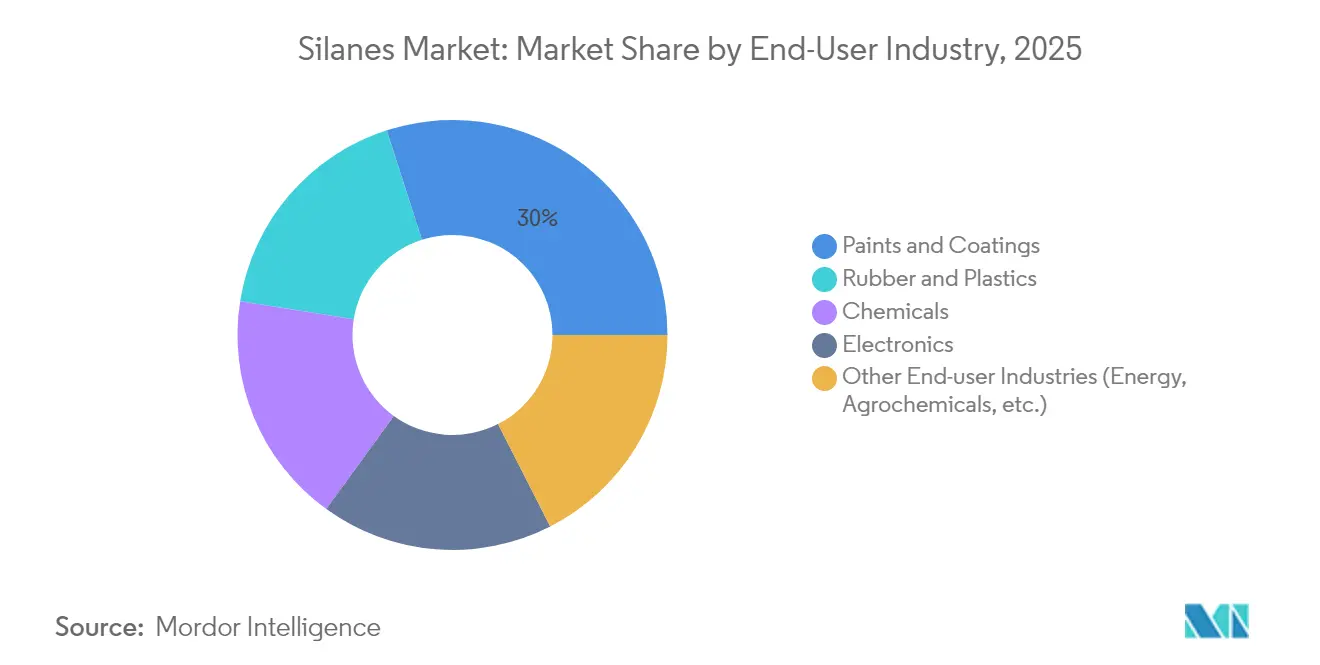
In 2025, paints and coatings commanded 29.95% of global volume, driven by infrastructure upgrades and the rapid shift to water-borne systems. The silanes market size accrued from this industry will continue expanding as protective-coatings specifications become stricter in marine, offshore, and industrial segments. Conversely, the “Others” category—spanning energy storage, agrochemicals, and hydrogen technology—is projected to grow fastest at a 6.78% CAGR. Silicon-rich anodes for lithium-ion batteries rely on tailored silane binders to mitigate volume-expansion stress, an emerging value stream poised to influence future consumption.
Rubber and plastics follow closely, underpinned by green-tire and lightweight-composite adoption in mobility applications. The electronics sector leverages ultra-pure silanes for barrier and dielectric layers, while chemical intermediates supply niche synthesis routes in pharmaceuticals and performance fluids. As each end-use explores decarbonisation and circularity, formulators increasingly prefer multi-functional silanes that deliver performance and regulatory compliance simultaneously, broadening the silanes market footprint across industries.
Geography Analysis
Asia-Pacific held 46.10% of global demand in 2025, reflecting China’s extensive electronics, automotive, and construction value chains. The silanes market size in the region is projected to compound at 6.48% CAGR through 2031 as capacity additions align with regional policy incentives for advanced manufacturing. Wacker’s multi-site footprint in Nanjing, Zhangjiagang, and Shanghai underscores the need for local production, logistics, and application-development support. India’s building-materials expansion and renewable-energy targets add further upside, while Japan and South Korea sustain premium-grade uptake for semiconductor and EV battery components.
North America remains a mature yet strategically important hub. Federal funding of USD 200 million to Group14 for a 7,200 metric-ton silane plant in Washington illustrates government efforts to strengthen domestic supply chains. Automotive electrification, aerospace composites, and resilient-infrastructure mandates collectively nurture specialized silane demand. The region’s regulatory rigor regarding VOC and toxic-substance control also rewards suppliers of low-emission formulations, fostering product differentiation in the silanes market.
Europe exhibits moderate growth as REACH compliance reshapes product portfolios and spurs adoption of chrome-free and methanol-reduced grades. Producers with integrated R&D and manufacturing, such as Evonik and Momentive, leverage site upgrades to secure market access under stricter rules. South America and the Middle East & Africa present nascent opportunities as infrastructure and industrialisation advance. Sika’s 2024 network of new plants and technology centers in India and China provide a roadmap for regional platforms that can mirror local performance norms while leveraging global process know-how. Import dependence and logistics complexity could nevertheless temper adoption rates until local manufacturing matures, creating segmented expansion profiles within the silanes market.

Value Chain Analysis
The silanes value chain starts upstream with silica sand reduction to silicon metal, paired with chlorine and hydrogen to produce key chlorosilane intermediates (such as methylchlorosilanes and trichlorosilane) and alkoxy inputs (methanol/ethanol) used for organofunctional conversion. Because tetrachlorosilane and related chlorosilanes need moisture-controlled handling and hazardous logistics, producers with integrated chlorosilane loops and captive feedstock access can sustain cost and supply advantages versus merchant buyers.
Midstream production typically includes synthesis, purification, and functionalization into organofunctional silanes (vinyl, amino, epoxy, mercapto, and alkoxy grades), then blending into application-ready packages for coupling agents, adhesion promoters, and surface treatments. Downstream demand concentrates in tire and rubber compounders, coatings and sealants formulators, electronics and semiconductor materials users, and surface-treatment applicators. Qualification cycles, particularly in automotive and high-reliability industrial uses, extend time-to-revenue and act as a gate for new grades. The chain is also being reshaped by localization moves and partnerships, including Momentive Performance Materials forming a joint venture with Jiangxi Hungpai New Material in February 2025 to manufacture and sell silanes in Asia-Pacific, along with long-term battery-supply contracting, illustrated by REC Silicon finalizing a multi-year high-purity silane supply agreement with Sila Nanotechnologies through 2031.
Competitive Landscape
The silanes market is moderately fragmented. Five leading companies—Dow, Wacker, Evonik, Momentive, and Shin-Etsu—control a sizeable share through vertically integrated silicon value chains, proprietary process technologies, and global technical-service networks. Product breadth lets these incumbents address coupling, adhesion, barrier, and surface-modification needs with tailored grades. Technical support remains a key purchasing criterion as customers prioritise application performance over pure commodity cost.
Strategic consolidation has reshaped competitive dynamics. Evonik’s January 2025 merger of its Silica and Silanes businesses into the Smart Effects platform combines filler and coupling expertise to accelerate compound-specific solutions. KCC Corporation’s 2024 acquisition of Momentive added specialty silane assets, broadening reach across electronics and industrial-coatings customers. Meanwhile, energy-storage entrants such as Group14 and Sila Nanotechnologies command investor attention for high-capacity silicon-anode innovations, signalling adjacent-industry convergence with the silanes market.
Supply-chain resilience has become a strategic imperative following pandemic-era disruptions and geopolitical tensions. Dow’s Gulf Coast chlorosilane expansion fortifies feedstock integration, while Wacker’s Charleston, Tennessee, debottleneck supports regional redundancy. Producers also intensify ESG commitments by lowering carbon footprints and phasing out high-hazard solvents, a trend expected to influence competitive positioning in forthcoming tenders.
Silanes Industry Leaders
-
Dow
-
Evonik Industries AG
-
Momentive
-
Shin-Etsu Chemical Co., Ltd.
-
Wacker Chemie AG
- *Disclaimer: Major Players sorted in no particular order
Market Opportunities and Future Outlook
Opportunities are concentrated where silanes support compliance-driven reformulation and performance upgrades in high-volume end uses. The shift away from chromate-based conversion coatings is widening the addressable space for silane-based anti-corrosion and surface-treatment stacks across metal finishing and industrial coatings. At the same time, waterborne coatings and adhesives continue to pull demand for low-VOC, low-methanol organofunctional silanes that improve adhesion between organic binders and inorganic substrates. This direction is reinforced by product and portfolio actions, including Evonik consolidating silica and silanes capabilities under Smart Effects (announced January 2025), supporting integrated silica-silane solution selling into tires, coatings, and adjacent energy applications.
Electronics packaging and energy storage also create white space for higher-purity and application-specific silanes, spanning adhesion promotion, barrier/dielectric interfaces, and specialty uses linked to silicon-anode battery materials. Supply chain localization and reliability are another lever. Evonik initiated capacity expansion for silane-functionalized polybutadiene at its Shanghai site in June 2025 to support regional supply security in Asian markets, while REC Silicon has highlighted ongoing monosilane production at its Butte, Montana facility (reported February 2026), with a strategic focus on silicon-anode battery supply chains. These steps reflect active investment in performance-led specialties and in-region production footprints, which can enable differentiated grades, technical service, and qualification support close to major manufacturing hubs.
Recent Industry Developments
- May 2026: Dow launched DOWSIL TC-3120 Thermal Gel for heat transfer in optical modules and high-speed data applications, featuring 12 W/m K thermal conductivity. The introduction expands Dow's offering in electronics thermal management, an area where silane and silicone chemistries support advanced packaging and data infrastructure.
- March 2026: Evonik launched Protectosil ECO-TRETE ANTIGRAFFITI, a PFAS-free, silane-based facade protection solution. The launch strengthens Evonik's building-protection portfolio around lower-hazard surface-treatment requirements and supports adoption of silane technologies in construction maintenance and refurbishment.
- February 2025: Momentive Performance Materials announced a joint venture with Jiangxi Hungpai New Material to manufacture and sell silanes in the Asia Pacific region. The partnership supports a more localized supply chain and customer service model for a region that accounts for the largest share of global silanes demand.
Research Methodology Framework and Report Scope
Market Definition and Coverage
For this methodology, the silanes market covers the sale of silane chemicals used as coupling, crosslinking, adhesion, and surface treatment agents across industrial manufacturing, captured as market value in USD at the point of commercial transaction.
Scope exclusions: We exclude downstream formulated products where silanes are only an additive (for example, finished sealants, paints, tires, or composites) to avoid double counting.
Segmentation Overview
- By Functional Group
- Vinyl
- Amino
- Epoxy
- Mercepto
- Alkoxy
- Others (Isocyanate, Acryloxy, etc.)
- By Application
- Coupling Agents
- Adhesion Promoters
- Moisture Scavengers
- Hydrophobing and Dispersing Agents
- Silicate Stabilizers
- Anti-corrosion and Surface Treatments
- By End-user Industry
- Paints and Coatings
- Rubber and Plastics
- Electronics
- Chemicals
- Other End-user Industries (Energy, Agrochemicals, etc.)
- By Geography
- Asia-Pacific
- China
- India
- Japan
- South Korea
- Thailand
- Indonesia
- Vietnam
- Malaysia
- Philippines
- Rest of Asia-Pacific
- North America
- United States
- Canada
- Mexico
- Europe
- Germany
- United Kingdom
- France
- Italy
- Spain
- Russia
- NORDIC Countries
- Turkey
- Rest of Europe
- South America
- Brazil
- Argentina
- Colombia
- Rest of South America
- Middle East and Africa
- Saudi Arabia
- United Arab Emirates
- Qatar
- South Africa
- Nigeria
- Egypt
- Rest of Middle East and Africa
- Asia-Pacific
Data Sources, Market Sizing, and Validation
Desk Research
Desk work starts with mapping where silanes are produced, traded, and consumed, then aligning that with end-use activity indicators. Public sources such as USGS minerals and materials data, United States International Trade Commission trade statistics, UN Comtrade, Eurostat, and OECD industry indicators are reviewed to understand chemical output, cross-border movement, and broader manufacturing trends.
We also read company annual reports, investor presentations, regulatory and safety documentation (SDS and product technical datasheets), plus updates from industry bodies and technical journals covering silane chemistry and applications. Where helpful, paid database subscriptions for company financials and intelligence, patent databases, and shipment-level import-export data are used to confirm ownership structures, plant footprint detail, and trade patterns. These examples are not exhaustive, and many other public sources were used for data collection, validation, and clarification.
Primary Interviews and Surveys
Primary discussions are done with participants across the value chain, including raw material suppliers, silane producers, distributors, and buyers in rubber, plastics, adhesives, coatings, and electronics. Since this is a global market, responses are balanced across APAC, EMEA, and the Americas so regional demand signals (including green tire penetration and construction activity) can be compared consistently. Inputs from these calls are used to confirm pricing ranges, typical purity and grade splits, and how demand is affected by substitution and qualification cycles.
Distribution of primary research fieldwork respondents
| Company type | Respondent position | Region |
|---|---|---|
| Top tier: 38% | CXOs: 13% | APAC: 52% |
| Mid tier: 44% | Functional/Unit leaders: 38% | EMEA: 30% |
| Smaller Players: 18% | Managers: 49% | Americas: 18% |
Market-Sizing & Forecasting
Sizing is built using a top-down approach where chemical production indicators and trade flows are used to reconstruct regional consumption, which is then mapped to key end uses of silanes. In practice, we anchor the demand pool using signals like rubber compounding and tire output, construction and coatings activity, plastics and composites production, and electronics packaging trends, and then adjust for application suitability and adoption rates shared by interviewees.
After that, we run selective bottom-up checks to keep totals realistic, such as rolling up a sample of supplier revenues, sanity checking capacity announcements and utilization ranges, and using typical price per kilogram ranges multiplied by estimated volumes for major applications. When direct visibility is weak in smaller countries, we handle gaps by using proxy indicators like industrial output indices and import dependence patterns, followed by a review with regional experts.
For forecasting, scenario analysis is used so growth can be flexed based on variables that practitioners track, such as construction cycles, tire replacement demand, semiconductor packaging output, and raw material cost pressure affecting pricing. Assumptions are stress tested in calls, and then the final curve is smoothed to reflect practical qualification and adoption timing rather than jumping year to year.
Data Validation & Update Cycle
Model outputs are cross checked against independent signals, like regional trade balances, capacity change news, and end-use production trends, and then variances are investigated before numbers are finalized. If a region shows a sudden shift that is not supported by demand indicators, we revisit conversion factors, pricing assumptions, and import-export splits, and then re-contact sources when needed.
A second analyst review is completed to confirm math, definitions, and consistency across regions and time series. The report is refreshed annually, and interim updates are triggered when material events occur, such as large plant start-ups, extended shutdowns, or major policy changes affecting construction or automotive output. Before delivery, we do a fresh final pass to ensure the latest public information has been reflected.
Mordor Intelligence's Silanes Market Size Versus Other Published Estimates
Published market sizes for silanes often differ, even when everyone is working from the same broad chemical space, because each publisher makes its own choices on scope, timing, and pricing logic. Differences also come from whether figures are built from demand signals (end-use activity and penetration) or from supplier side roll-ups, which can behave very differently in years with sharp price movement.
The main gap comes from whether downstream formulated products are counted along with silane intermediates. Mordor Intelligence counts only silanes sold as chemical products and excludes finished adhesives, sealants, and coatings to reduce double counting.
Benchmark comparison
| Source | Market Size | Gaps in Research Methodology |
|---|---|---|
| Mordor Intelligence | USD 3.46 B (2026) | |
| Industry Research Publisher A | USD 3.36 B (2024) | Uses an earlier base year and a different price timing, so value can shift when silane pricing resets quickly across regions. The scope also appears to be broader in some application reporting, which can pull in adjacent chemical demand. |
| Industry Research Publisher B | USD 3.25 B (2025) | Centers the estimate on a single estimated year and may apply global average pricing to a mixed grade basket, which can understate value where high purity and specialty functional grades are more common. It also relies more on long cycle assumptions for end use growth, which smooths short term demand changes. |
Overall, the spread is explained by differences in what gets included, which year is treated as the anchor, and how prices are translated into USD across regions. Our approach stays traceable because the totals are tied back to clear demand drivers, checked with supplier side reality tests, and updated when market events change the practical run rate.
Key Questions Answered in the Report
What is the current valuation of the silanes market?
The silanes market size is USD 3.46 billion in 2026 and is projected to reach USD 4.46 billion by 2031.
Which region dominates global demand for silanes?
Asia-Pacific leads with 46.10% share in 2025 and is forecast for the fastest 6.48% CAGR through 2031 due to its strong manufacturing base.
Which functional group holds the largest revenue share?
Vinyl silanes account for 38.72% of demand in 2025, driven by their use in tire and composite applications.
What is the highest-growth application area?
Anti-corrosion treatments are expanding at a 6.41% CAGR as industries replace chromium-based systems with silane alternatives.
How are regulations influencing silane formulations in Europe?
REACH restrictions on VOCs and cyclosiloxanes are steering suppliers toward methanol-reduced and chrome-free grades, reshaping product portfolios in the region.
What recent strategic move signals consolidation in the industry?
Evonik merged its Silica and Silanes businesses into the Smart Effects platform in 2025 to deliver integrated performance solutions.