
Signal Generator Market Size and Share
Market Overview
| Study Period | 2020 - 2031 |
|---|---|
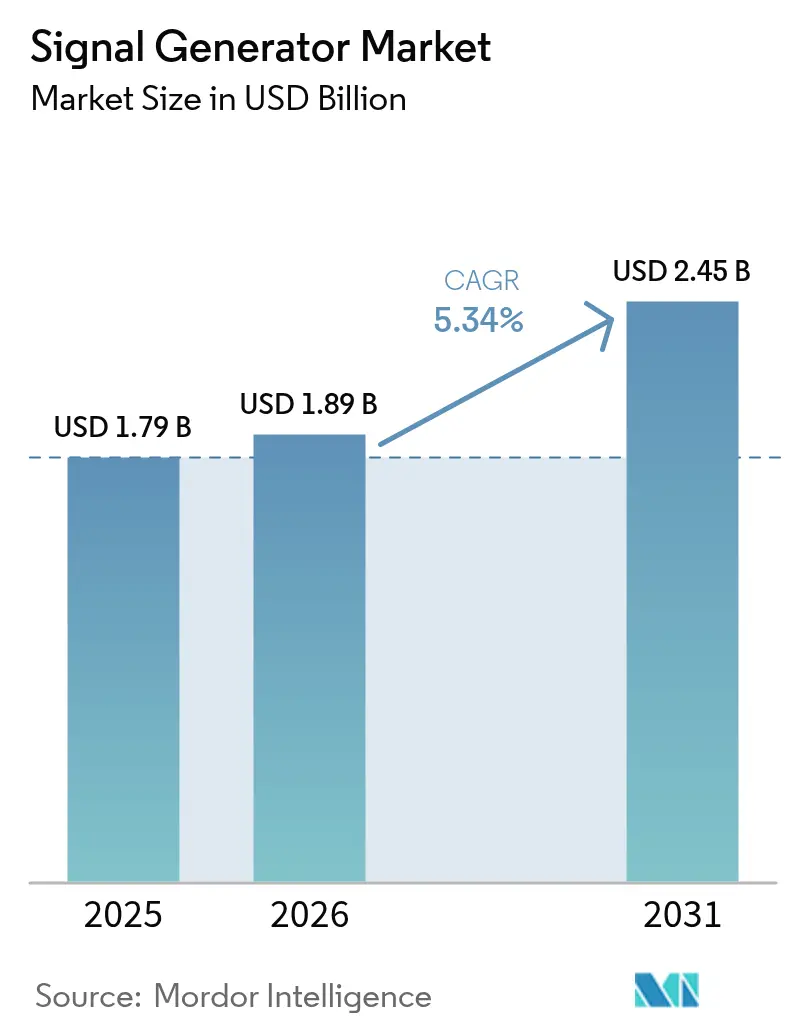
| Market Size (2026) | USD 1.89 Billion |
| Market Size (2031) | USD 2.45 Billion |
| Growth Rate (2026 - 2031) | 5.34 % |
| Fastest Growing Market | Asia Pacific |
| Largest Market | North America |
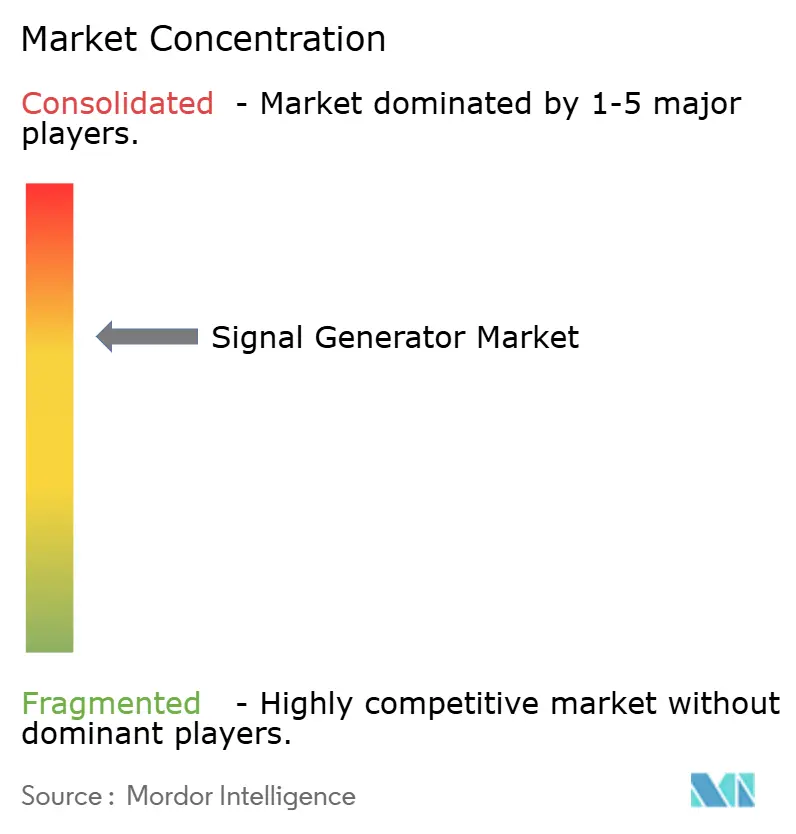
| Market Concentration | Medium |
Major Players *Disclaimer: Major Players sorted in no particular order Image © Mordor Intelligence. Reuse requires attribution under CC BY 4.0. | |
Signal Generator Market Analysis by Mordor Intelligence
signal generator market size in 2026 is estimated at USD 1.89 billion, growing from 2025 value of USD 1.79 billion with 2031 projections showing USD 2.45 billion, growing at 5.34% CAGR over 2026-2031. This trajectory mirrors the sector’s pivot from traditional RF testing toward demanding 5G infrastructure validation, mmWave automotive radar prototyping, and early quantum-computing research, all of which impose tighter phase-noise, bandwidth, and frequency‐settability requirements on next-generation instruments. Spiraling wafer-fab equipment sales of USD 113 billion in 2024 elevated precision test-gear spend, while China’s plan to surpass 4.5 million 5G base stations in 2025 amplified sub-6 GHz and mmWave generator demand across Asia. North America retained leadership through aerospace-and-defense (A&D) radar modernizations, yet Asia-Pacific delivered the fastest growth as Taiwan and South Korea expanded semiconductor test capacity.
Key Report Takeaways
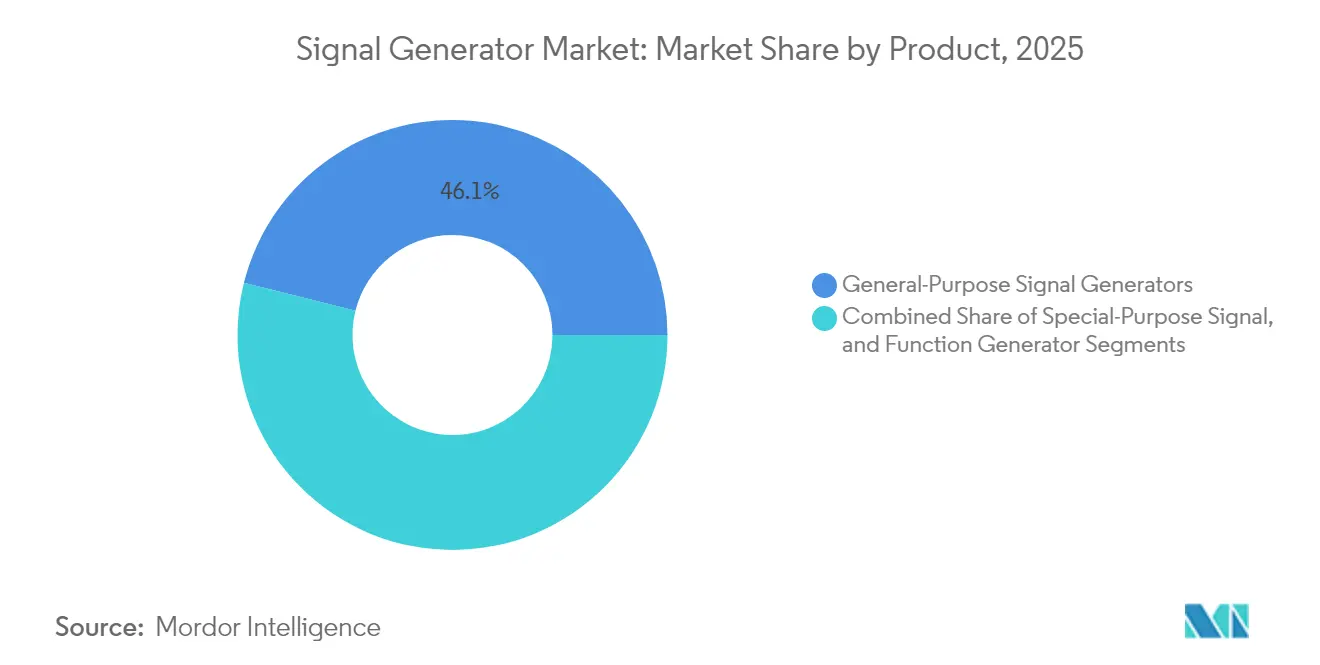
- By product type, general-purpose instruments led with 46.10% of signal generator market share in 2025, whereas vector/arbitrary-waveform units are projected to climb at a 6.85% CAGR to 2031.
- By frequency range, the 3–6 GHz band accounted for 33.70% of the signal generator market size in 2025; the above-12 GHz segment is on track for a 9.12% CAGR through 2031.
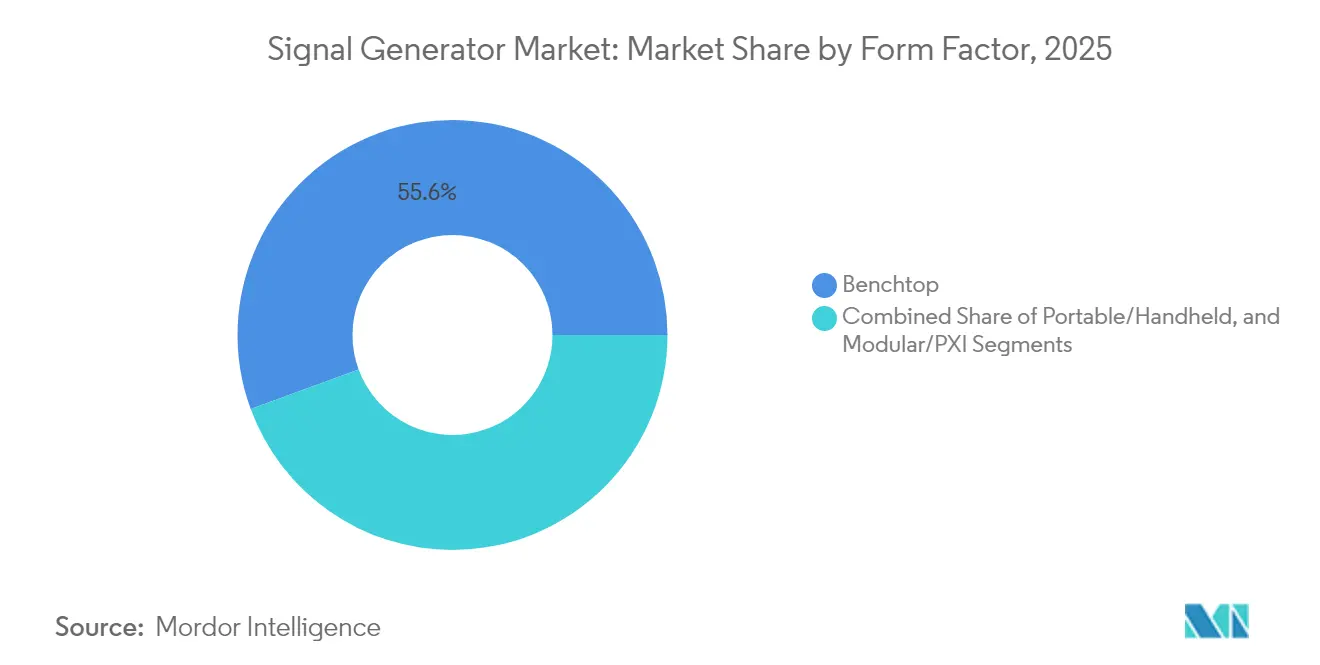
- By form factor, benchtop equipment held 55.60% share of the signal generator market size in 2025, while PXI/modular solutions show the strongest 7.76% CAGR outlook.
- By technology, 4G LTE commanded 36.60% of signal generator market share in 2025; 5G NR is advancing at a 10.05% CAGR through 2031.
- By application, design workflows captured 32.80% of the signal generator market size in 2025, yet the testing segment is pacing for an 8.34% CAGR.
- By end user, telecommunications led with 41.00% share in 2025; automotive is the fastest-growing vertical at 5.61% CAGR to 2031.
- By geography, North America represented 32.10% revenue in 2025, whereas Asia-Pacific is expanding at a 6.18% CAGR to 2031.
Note: Market size and forecast figures in this report are generated using Mordor Intelligence’s proprietary estimation framework, updated with the latest available data and insights as of 2026.
Market Trends and Insights
Drivers Impact Analysis of Signal Generator Market*
| Driver | (~) % Impact on CAGR Forecast | Geographic Relevance | Impact Timeline |
|---|---|---|---|
| Accelerated 5G base-station roll-outs | +1.2% | Asia-Pacific core, spill-over to North America and EU | Medium term (2-4 years) |
| Radar upgrade programs in A&D | +0.8% | North America, secondary EU | Long term (≥ 4 years) |
| mmWave automotive radar prototyping | +0.7% | Europe core, global auto hubs | Medium term (2-4 years) |
| Semiconductor test expansions | +0.9% | Asia-Pacific, exports worldwide | Short term (≤ 2 years) |
| Quantum-computing research hubs | +0.3% | North America and EU | Long term (≥ 4 years) |
| Middle-East small-sat manufacturing | +0.4% | Middle East, satellite export | Medium term (2-4 years) |
| Source: Mordor Intelligence | |||
Accelerated 5G Base-Station Roll-outs in Asia Requiring High-Frequency Vector Signal Generators
China expects more than 4.5 million live 5G base stations in 2025, up from 4.19 million in 2024, obligating operators to purchase multi-channel vector units that validate sub-6 GHz and mmWave waveforms with tight phase coherence. Each site needs several generators for RF conformance, and the domino effect now extends to India and Southeast Asia, which are fast-tracking open-RAN trials. MIMO and beamforming checks call for wider modulation bandwidths, propelling premium models that cover 3.5–28 GHz. Microwave backhaul, used by 60% of cell sites, pushes additional procurement of high-frequency sources. Consequently, Asia-Pacific is shaping the demand curve for the signal generator market well into the medium term.
Radar Upgrade Programs in North-American A&D Boosting Demand for Above 18 GHz Generators
The U.S. Department of Defense funds GaN-based AESA retrofits, prompting contractors to secure generators capable of 8–54 GHz threat-scenario emulation.[1] Keysight’s VXG series, which streams coherent multichannel waveforms up to 54 GHz, typifies the new benchmark. Compounded by electronic-warfare red-team exercises and domestic sourcing mandates, demand for ultra-low phase-noise sources will persist into the next decade, incrementally lifting the signal generator market growth.
mmWave Automotive Radar Prototyping by European Tier-1s Fuels Multi-Channel AWG Sales
European suppliers shifting from 24 GHz to 77-81 GHz ADAS radars need arbitrary-waveform generators with nanosecond-level timing alignment for HIL simulation. Each luxury vehicle can house up to 12 radar sensors, magnifying test-bench requirements. European compliance for interference mitigation further necessitates clean-spectrum outputs, accentuating the uptake of multi-channel 79 GHz platforms. As fleet electrification scales, radar sensor volumes rise, cementing medium-term momentum for the signal generator market.
Semiconductor Test Capacity Expansions in Taiwan and South Korea Driving PXI Modular Units
Taiwanese and Korean fabs plan USD 54.3 billion combined 300 mm-equipment outlays by 2027. Test houses, therefore, install PXI signal sources that synchronize across hundreds of DUT sites for high-throughput characterizations. MPI Corporation already reports three-year order visibility fed by AI workload silicon. The short-term spike in modular platform demand filters globally via equipment exports, providing an immediate tailwind to the signal generator market.
Restraints Impact Analysis of Signal Generator Market*
| Restraint | (~) % Impact on CAGR Forecast | Geographic Relevance | Impact Timeline |
|---|---|---|---|
| Entry-level Chinese benchtop units eroding prices | −0.6% | South America core, global effect | Short term (≤ 2 years) |
| GaAs/MMIC shortages delaying deliveries | −0.8% | Europe primary, global spill | Medium term (2-4 years) |
| EU electromagnetic emission norms | −0.4% | Europe, export impact | Long term (≥ 4 years) |
| RF-test talent shortage | −0.3% | Africa and Oceania | Long term (≥ 4 years) |
| Source: Mordor Intelligence | |||
Entry-Level Chinese Benchtop Units Eroding Prices in LATAM
Chinese vendors leverage post-COVID supply normalization to ship 6 GHz generators at prices 30–40% under Western brands, especially in price-sensitive South America.[2] Component availability gives them cost levers, pressuring incumbents to defend margins or migrate upmarket. The resulting discounting pulls average selling prices down, trimming near-term revenue growth for the signal generator market.
GaAs/MMIC Shortages Delaying European Deliveries
Beijing’s gallium export curbs hit 98% of global supply, extending MMIC lead times from 16 to 30 weeks for European makers. MACOM’s acquisition of OMMIC seeks to localize wafer supply, yet ramp-up needs 18–24 months. Prolonged shortages risk order deferrals and, by extension, dent the signal generator market over the medium horizon.
*Our forecasts treat driver/restraint impacts as directional, not additive. The impact forecasts reflect baseline growth, mix effects, and variable interactions.
Signal Generator Market Segment Analysis
By Product:
General-Purpose Dominance Amid Vector InnovationGeneral-purpose instruments accounted for 46.10% of 2025 revenue, underscoring their versatility across RF education, troubleshooting, and legacy wireless protocols. However, vector and arbitrary-waveform units, buoyed by 5G NR’s complex numerologies, will post a 6.85% CAGR and steadily shrink the gap. The signal generator market size for vector products is set to outpace conventional gear as two-box architectures give way to integrated I/Q modulators. Segment leaders now embed digital up-conversion and wide-bandwidth RF chains to span sub-GHz through 40 GHz, allowing one chassis to replace several legacy models.
Software-defined moves, such as Rohde & Schwarz’s SMW200A, which adds mmWave amplifiers via plug-in heads, grant path-to-terahertz upgrades without full capital refresh. Function generators keep a niche in academia, though shrinking price gaps encourage labs to purchase entry-level AWGs instead. Across OEM R&D, twin drivers - time-to-market and reduced rack footprints - sustain demand for hybrid generation-and-analysis benches, reaffirming a premium for accuracy and spectral purity in the signal generator market.

By Frequency Range:
mmWave Acceleration Beyond Traditional BandsThe 3–6 GHz block delivered 33.70% of 2025 turnover through sub-6 GHz 5G, Wi-Fi 6E, and industrial IoT use cases. Yet, automotive radar, 5G mmWave backhaul, and satellite uplinks propel frequencies above 12 GHz at a 9.12% CAGR. Dual-path architectures covering DC-to-44 GHz compress multiple instruments into one, simplifying calibration chains.
Photonic techniques - demonstrated by Rohde & Schwarz’s ultra-stable tunable THz sources - extend internal references well past 100 GHz, a prerequisite for 6G trials. GaN front-ends mitigate output-power roll-off, though gallium constraints loom. As instruments flex wider instantaneous bandwidths, traditional band-based segmentation fades, yet procurement budgets still reference historic cutoff points, preserving clarity when allocating spend across the signal generator market.
By Form Factor:
Benchtop Resilience Despite Modular GrowthBenchtop systems retained 55.60% share in 2025 thanks to intuitive GUIs, local knobs and rapid bench-top reconfiguration. Teaching labs and early-stage startups continue to favor standalone units over system-embedded modules. Even so, PXI cards will expand at an 7.76% CAGR as fab lines, RF front-end assembly, and board-level production test seek synchronized multichannel sources. The signal generator market size for PXI slots is, therefore, tied closely to semiconductor capex cycles.
Vendors now supply remote web-based control and cloud licensing for benchtop models, blurring boundaries with rack automation. In contrast, handheld demand stays niche - field techs for satellite gateways or small-sat factories require portability but accept narrower specs. For global OEMs, mixed fleets of benchtop for R&D and PXI for production strike the optimal CAPEX/throughput balance.
By Technology:
5G NR Acceleration Amid 4G Persistence4G LTE accounted for 36.60% of 2025 revenue because many emerging markets still extend LTE coverage and IoT Cat-M deployments. Nonetheless, 5G NR will grow 10.05% annually as operators light up standalone cores, mid-band carrier aggregation, and mmWave fixed-wireless. Instruments must replicate 400 MHz instantaneous bandwidths, 1024-QAM, and FR1/FR2 coexistence in a unified platform, reshaping customer specifications.
Research alliances between Rohde & Schwarz and Qualcomm, validating 13 GHz FR3 links, mark a step toward 6G, prompting vendors to pre-install ultra-wideband D/A paths. Legacy 2G/3G calling for simple GMSK modulation remains profitable only in after-sales spares. Over the decade, tech convergence with Wi-Fi 7 and radar-sensing profiles - hallmarks of 6G ISAC concepts - will further complicate roadmaps, yet they anchor upside for the broader signal generator market.
By Application:
Testing Surge Drives Market EvolutionDesign benches captured 32.80% of 2025 spend, but regulatory, safety, and interoperability checks now make the testing phase the fastest-growing application at an 8.34% CAGR. Instruments must juggle compliance scripts, automated limit masks, and high-throughput switching, particularly for 77–81 GHz ADAS production lines.
Wafer-level probing uses PXI sources for vector-network sweeps within thermal chambers, linking yield losses directly to signal fidelity gaps. Meanwhile, on-site troubleshooting moves toward cloud-connected handhelds streaming IQ data for remote diagnostics. Each node expands recurring software revenues, improving the value proposition of premium SKUs in the signal generator market.

By End-User Industry:
Telecommunications Leadership Amid Automotive AccelerationTelecommunications retained a 41.00% revenue share in 2025, driven by densification, spectrum refarming, and the adoption of open-RAN conformance labs. Yet automotive electronics will chart a 5.61% CAGR, fuelled by high-resolution radar, V2X, and EV powertrain EMC. ADAS tier-ones require synchronized multi-gigahertz chirps with micro-radian phase repeatability, forcing them to spec premium arbitrary-waveform generators.
A&D customers seek coherent multi-emitters above 40 GHz for EW scenarios, while quantum-computing labs chase sub-100 fs jitter references at microwave carriers of 4-12 GHz. Education and healthcare hold niche demand; medical-imaging device OEMs validate ultrasound or MRI preamps. Universities mirror emerging 6G sub-THz curricula. Broadly, each vertical’s test depth and cadence dictate its proportional pull on the signal generator market.
Geography Analysis
North America Signal Generator Market
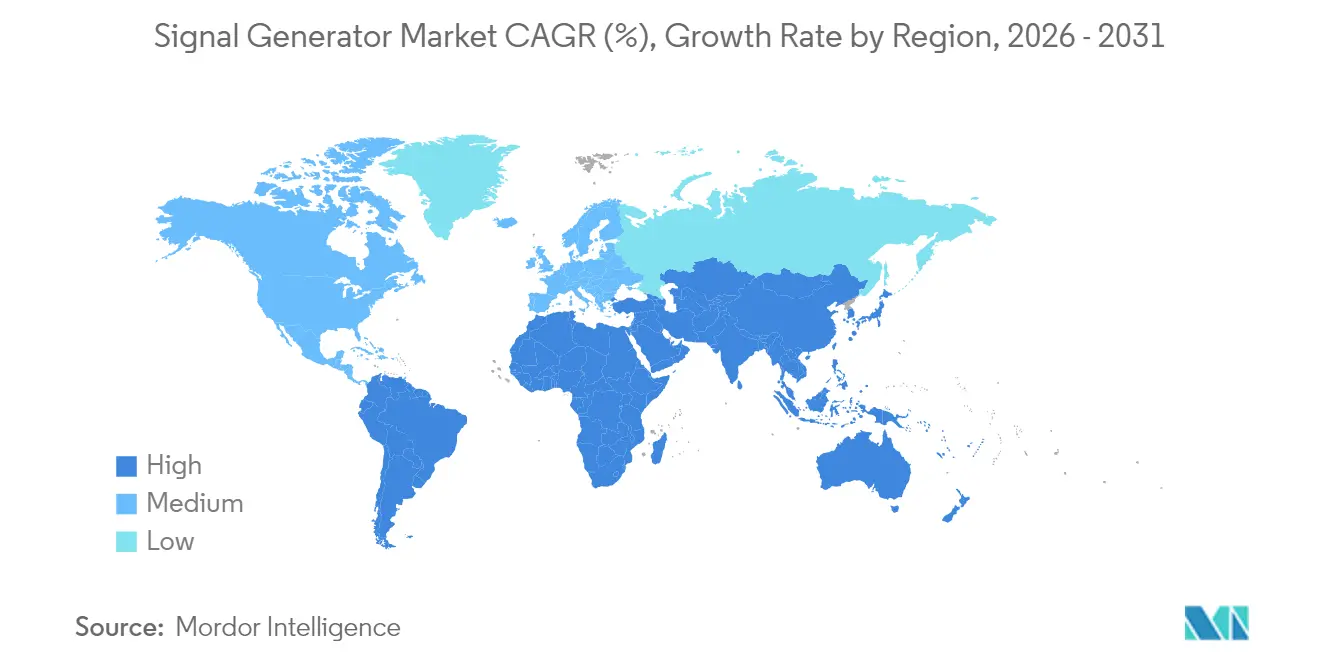
North America held 32.10% of 2025 revenue, buoyed by persistent A&D funding and early 5G roll-outs. U.S. federal budgets back radar upgrades, while Canadian quantum clusters purchase ultra-low-phase-noise gear for superconducting-qubit experiments. Domestic sourcing preferences following tariff regimes favor local vendors, preserving premium pricing.
APAC Signal Generator Market
Asia-Pacific is the fastest-growing region at 6.18% CAGR through 2031. China’s announcement of 4.5 million live 5G macro sites in 2025 guarantees sustained sub-6 GHz vector-generator volume. Taiwan and South Korea will collectively pour more than USD 54 billion into 300 mm fabs by 2027, which will continuously expand PXI slot installations. Government tax credits catalyze local supply-chain clusters, reinforcing a virtuous cycle for the signal generator market.
EMEA Signal Generator Market
Europe records steady but slower growth. Automotive radar R&D around Stuttgart, Munich, and Gothenburg anchors high-frequency demand, whereas stricter electromagnetic-emission norms raise test complexity for >20 dBm outputs. Gallium shortages, however, risk delivery delays for 40+ GHz models until on-shore wafer lines come online, marginally damping the regional signal generator market size. The Middle East and Africa, though currently small, invest in sovereign small-sat factories; portable RF sources accompany assembly and launch-site testing, offering upside once launch cadence accelerates.
Regulatory Landscape
Signal generators are primarily shaped by electromagnetic compatibility and other radio-related compliance regimes rather than sector-specific licensing. In the United States, market access commonly maps to FCC requirements under 47 CFR Part 15 for unintentional radiators and, where applicable, Part 18 for industrial, scientific, and medical equipment, using Supplier Declaration of Conformity or certification pathways depending on the device configuration.
In the European Union, manufacturers generally align products to Directive 2014/30/EU (EMC Directive) and, for radio-capable units, Directive 2014/53/EU (Radio Equipment Directive), documented through CE marking and harmonized standards such as EN 61326-1. References to harmonized standards under the Radio Equipment Directive are refreshed periodically via European Commission implementing decisions, with updates continuing through December 2025, increasing the value of keeping technical files current for exports and multi-region product variants. Trade policy also affects delivered costs: a US presidential proclamation issued April 2, 2026 (effective April 6, 2026) shifted Section 232 tariffs to a classification-based full entered-value approach for metals and derivatives used in enclosures and submodules, while Section 301 tariffs on Chinese-origin semiconductors remained elevated in mid-2026, influencing sourcing and bill-of-materials strategy for high-frequency platforms.
Value Chain Analysis
The signal generator value chain starts with specialized electronic components that set achievable phase noise, bandwidth, and spurious performance, including high-speed DACs, low-noise LDOs and power management ICs, precision timing oscillators/references, LOs, RF mixers, and mmWave front-end devices (often GaAs/GaN/MMIC-based), alongside FPGAs and embedded controllers for waveform sequencing and modulation. These inputs feed instrument OEM design and integration, where RF upconversion chains, calibration routines, and firmware-defined features are built into benchtop and modular/PXI form factors for R&D, production test, and certification workflows.
Manufacturing and assembly models run from vertically integrated to outsourced approaches. Rohde & Schwarz points to high vertical integration, including in-house microelectronics/ASIC capabilities in Germany, with secondary assembly and shipping footprints in Singapore and Malaysia to support regional demand and service logistics. Downstream, distribution covers direct enterprise sales to telecom, aerospace and defense, automotive, and semiconductor customers, along with channel partners for education and general-purpose labs; recurring value is reinforced through software licenses, application options, calibration services, and field upgrades that extend frequency coverage and standards support over an instrument lifecycle.
Competitive Landscape
Industry consolidation escalated in 2024-25: Keysight’s USD 1.46 billion acquisition of Spirent and Emerson’s USD 8.2 billion purchase of National Instruments broadened portfolios from pure-play generation to complete design-verify-optimize stacks. Such a platform embeds common software layers that orchestrate signal source, analyzer, switch, and power-supply functions across benchtop and PXI, locking in customers and elevating switching costs.
Technology differentiation concentrates on phase noise, output flatness, and instantaneous bandwidth. Rohde & Schwarz pushes photonics-based terahertz vectors, while Anritsu’s 70 GHz analog Rubidium focuses on ultra-clean spur levels. Meanwhile, low-cost Chinese entrants capture first-time buyers in emerging markets with 6 GHz benchtops under USD 3,000, fragmenting the low-end. Established brands counter through service passports, calibration hubs, and subscription-based firmware that unlocks future bands, enabling lifecycle monetization.
White-space opportunities surface in quantum-computing readout chains, where -135 dBc/Hz at 10 kHz offset is mandatory, and in O-RAN conformance rigs needing phase-aligned multi-port sources above 7 GHz. Vendors investing in modular phase-noise cancellation and digital-predistortion (DPD) test algorithms are best placed to monetize these growth nodes. Overall, scale, software and spectral purity define competitive advantage in the evolving signal generator market.
Signal Generator Industry Leaders
-
Keysight Technologies Inc.
-
Rohde & Schwarz Gmbh & Co Kg
-
National Instruments Corporation
-
Teledyne Technologies Incorporated
-
Anritsu Corporation
- *Disclaimer: Major Players sorted in no particular order
Signal Generator Market Companies Covered in this Report
- Keysight Technologies Inc.
- Rohde and Schwarz GmbH and Co KG
- Tektronix Inc. (Keithley Instruments)
- Anritsu Corporation
- National Instruments Corp.
- Teledyne Technologies Inc.
- BandK Precision Corp.
- Fluke Corporation
- Yokogawa Electric Corporation
- Good Will Instrument Co. Ltd.
- AnaPico AG
- Spirent Communications plc
- Mini-Circuits
- Tabor Electronics Ltd.
- Aim-TTi (Thurlby than dar)
- Siglent Technologies Co. Ltd.
- Rigol Technologies Co. Ltd.
- Stanford Research Systems
- Fortive Corp. (Fluke/Tektronix)
- Pico Technology
Market Opportunities and Future Outlook
Product and workflow changes are creating whitespace in software-defined and upgradeable signal generation that compresses multiple test roles into fewer hardware platforms. Liquid Instruments is moving in that direction: in April 2026 it closed a USD 50 million Series C round co-led by Keysight Technologies and Australias National Reconstruction Fund Corporation to advance AI-driven instrumentation, and in July 2026 it launched GenInst Studio to build custom test instruments, including signal generators, on reconfigurable Moku hardware using natural-language prompts. Together, these steps point to continued demand for configurable signal generation that can be retargeted across design, troubleshooting, and automated test without a full hardware refresh.
Competitive intensity at the mid-range is also rising as more vendors add integrated RF features, including I/Q modulation and higher sampling AWGs, aimed at RF, high-speed digital, and component characterization. In June to July 2026, Siglent introduced the SDG8000A AWG platform with integrated IQ modulation and launched the SSG3000X Plus RF signal generator line, while UNI-T showcased USG series models reaching up to 22 GHz at IMS 2026. These product moves reinforce differentiation around clean-spectrum performance, modular frequency extension, and application-specific software (for 5G NR coexistence, radar simulation, and lab automation), especially where buyers want a path from sub-6 GHz work into higher-frequency validation without replacing entire test benches.
Recent Industry Developments in Signal Generator Market
- April 2026: Rohde & Schwarz added Pulsar navigation signal simulation as a software option for its R&S SMBV100B and R&S SMW200A vector signal generators. The update broadens satellite and navigation test coverage without new hardware, supporting labs that need scenario generation across evolving GNSS and resilient-PNT use cases.
- June 2025: Anritsu introduced the EcoSyn Lite MG36021A microwave synthesizer module covering 10 MHz to 20 GHz for space-constrained ATE use. The module format targets high-throughput production environments where compact integration and synthesized source stability matter for test-cell density and uptime.
- May 2024: Keysight introduced a pulse generator option for its handheld analyzers to add stimulus capability alongside field measurement. Bringing generation closer to portable workflows reduces dependence on bench instruments for certain troubleshooting and validation tasks, tightening the link between lab-grade feature sets and in-situ maintenance needs.
Signal Generator Market Report Scope and Research Methodology
Market Definition and Coverage
This market covers revenue earned from signal generators used to create controlled electrical signals for design, test, manufacturing support, troubleshooting, and repair of electronic systems across end users like telecom, electronics manufacturing, automotive, aerospace and defense, and healthcare.
Scope exclusions: We exclude pure software-only signal simulation tools and general electronic components that do not perform signal generation as a test instrument.
Segments Covered in This Report
- By Product
- General-Purpose Signal Generator
- RF Signal Generator
- Microwave Signal Generator
- Arbitrary Waveform Generator
- Special-Purpose Signal Generator
- Video Signal Generator
- Audio Signal Generator
- Pitch Generator
- Function Generator
- Analog Function Generator
- Digital Function Generator
- Sweep Function Generator
- General-Purpose Signal Generator
- By Frequency Range
- Less than 3 GHz
- 3-6 GHz
- 6-12 GHz
- Above 12 GHz (mmWave)
- By Form Factor
- Benchtop
- Portable/Handheld
- Modular/PXI
- By Technology
- 2G (GSM, CDMA)
- 3G (W-CDMA, CDMA2000)
- 4G (LTE, WiMAX)
- 5G NR
- By Application
- Designing
- Testing
- Manufacturing
- Certification
- Troubleshooting
- Repairing
- By End-User Industry
- Telecommunications
- Aerospace and Defense
- Automotive
- Electronics Manufacturing and Semiconductors
- Healthcare/Medical Devices
- Education and Research
- By Geography
- North America
- United States
- Canada
- Mexico
- Europe
- Germany
- United Kingdom
- France
- Italy
- Spain
- Nordics (Denmark, Sweden, Norway, Finland)
- Rest of Europe
- Asia-Pacific
- China
- Japan
- South Korea
- India
- Southeast Asia
- Australia
- Rest of Asia-Pacific
- South America
- Brazil
- Argentina
- Rest of South America
- Middle East and Africa
- Middle East
- United Arab Emirates
- Saudi Arabia
- Rest of Middle East
- Africa
- South Africa
- Nigeria
- Rest of Africa
- Middle East
- North America
Data Sources, Market Sizing, and Validation
Desk Research
Desk research is used to set the market context and anchor the model to observable activity. We review public sources such as ITU releases on telecom infrastructure, FCC equipment authorization and related filings, US Census Bureau and Eurostat electronics output indicators, and WTO and national customs statistics for trade flows tied to test and measurement equipment.
To make the inputs practical, we also use manufacturer annual reports, investor decks, product catalogs, and reliable press coverage to understand pricing bands and product mix shifts (for example, more demand for higher frequency and vector-capable instruments). Where needed, paid subscriptions for company financials and news intelligence, patent databases, and shipment-level import and export data are used to cross-check assumptions that cannot be read from one public dataset. This list is illustrative only, and we rely on other references for data collection, validation, and clarification.
Primary Interviews and Surveys
Primary work is used to pressure-test the desk assumptions and fill the gaps that published statistics do not address. We speak with a mix of instrument manufacturers, component suppliers, distributors, calibration and service providers, and end-user lab teams across APAC, EMEA, and the Americas, so pricing, demand cycles, and technology transitions are validated in a consistent way.
Distribution of primary research fieldwork respondents
| Company type | Respondent position | Region |
|---|---|---|
| Top tier: 29% | CXOs: 15% | APAC: 46% |
| Mid tier: 56% | Functional/Unit leaders: 34% | EMEA: 30% |
| Smaller Players: 15% | Managers: 51% | Americas: 24% |
Market-Sizing & Forecasting
Sizing starts from a top-down demand pool build that links signal generator spending to measurable test intensity in key end uses, and then the total is checked using selective bottom-up approximations from sampled vendor revenue splits and channel discussions. In practice, we first map where instruments are consumed, and only then do we apportion spend across product classes like general-purpose, special-purpose, and function generators.
Inputs used in the model include 5G and RF lab rollout activity, electronics manufacturing output trends, aerospace and defense test spending signals, mix shift toward higher frequency and vector use cases, and typical replacement and calibration cycles that drive repeat purchases. Average selling price movement is treated carefully by separating entry instruments from premium configurations, and by validating the pricing direction through interview feedback rather than assuming a flat inflation uplift.
For forecasting, scenario analysis is applied around technology adoption and capex cycles, and the path is further smoothed using short historical series checks so sharp jumps are questioned. Where bottom-up checks are incomplete for smaller geographies, gaps are handled through proxy indicators such as trade flows and installed lab density, followed by normalization back to the global total.
Data Validation & Update Cycle
Validation is done through multiple passes, where model outputs are compared against independent signals like trade movement, public spending indicators, and the revenue trajectory implied by supplier disclosures. If a region shows an unusual swing, assumptions are revisited and the team re-contacts selected respondents to confirm whether a real demand shift occurred or if it is a modeling artifact.
Before sign-off, variance checks are run across regions and applications so no single driver over-explains the total, and then the full file is reviewed by another analyst for logic and consistency. The report is refreshed annually, and interim updates are added when a material event impacts demand, pricing, or availability, with a final pre-delivery check to ensure clients receive the latest view.
Mordor Intelligence's Signal Generator Market Size Compared With Other Published Estimates
Published numbers for signal generators often do not match, even when the topic name is the same, because firms draw the product boundary differently and do not always align on the base year, currency timing, or what counts as an instrument sale versus adjacent test spending.
The gaps usually come from scope choices such as whether function generators and specialized variants are included, how 4G and 5G driven demand is treated, and whether the model leans on aggressive price expansion for premium configurations. Another common reason is refresh cadence, since a model that does not revisit trade, output, and pricing signals can stay anchored to older demand conditions.
Benchmark comparison
| Source | Market Size | Gaps in Research Methodology |
|---|---|---|
| Mordor Intelligence | USD 1.89 B (2026) | |
| Industry Publisher A | USD 1.87 B (2024) | Uses an earlier base year and applies a higher growth profile, and the scope description is broad enough that adjacent generator categories and application-driven uplifts may be blended without a clear separation by instrument class. |
| Research Publisher B | USD 1.59 B (2024) | Anchors the series to a 2024 base and a different forecast window, and does not clearly state how product mix and ASP progression are treated across general-purpose versus specialized signal generators. |
The table shows that the spread is mainly explained by base-year alignment and what is counted as signal generator revenue versus nearby test equipment, and in Mordor Intelligence's model the 2026 value is built by explicitly grouping general-purpose, special-purpose, and function generators and then checking the totals against use-case demand signals like 5G test activity. When these scope and pricing assumptions are made visible, the final number becomes easier to trace and repeat, even if another publisher chooses a different year or a broader bundle.
Key Questions Answered in the Report
What is the current size of the signal generator market?
In 2026, the signal generator market size is USD 1.89 billion.
How fast will the market grow over the next five years?
Revenue is projected to rise at a 5.34% CAGR, reaching USD 2.45 billion by 2031.
Which region will expand the fastest?
Asia-Pacific shows the highest 6.18% CAGR, fueled by large-scale 5G deployments and semiconductor fab investments.
What product category is gaining momentum?
Vector and arbitrary-waveform generators will post a 6.85% CAGR as 5G, radar and quantum applications demand complex modulation.