
Sickle Cell Treatment Market Size and Share
Market Overview
| Study Period | 2020 - 2031 |
|---|---|
| Market Size (2026) | USD 4.23 Billion |
| Market Size (2031) | USD 8.41 Billion |
| Growth Rate (2026 - 2031) | 14.72 % |
| Fastest Growing Market | Asia-Pacific |
| Largest Market | North America |
| Market Concentration | Medium |
Major Players *Disclaimer: Major Players sorted in no particular order Image © Mordor Intelligence. Reuse requires attribution under CC BY 4.0. | |
Sickle Cell Treatment Market Analysis by Mordor Intelligence
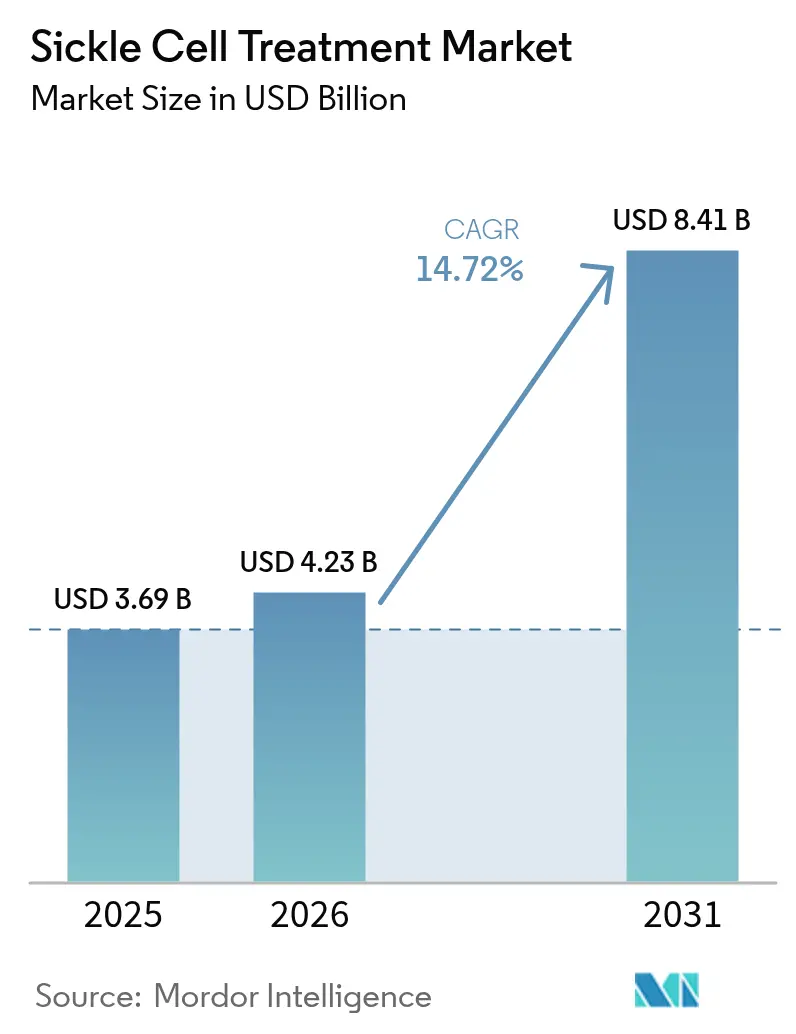
The global sickle cell treatment market size was valued at USD 3.69 billion in 2025 and estimated to grow from USD 4.23 billion in 2026 to reach USD 8.41 billion by 2031, at a CAGR of 14.72% during the forecast period (2026-2031). Accelerated growth reflects headline drivers such as gene-editing approvals, wider newborn screening, and evolving value-based payment models. Pharmacotherapy maintains the largest revenue pool, while curative gene therapies create a premium-priced, high-growth niche that redefines long-term disease management. Reimbursement experiments in North America, infrastructure rollouts in Asia-Pacific, and orphan-drug incentives across major agencies collectively reinforce demand signals. Headwinds persist in low-income regions where supply chain gaps, limited insurance coverage, and workforce shortages slow adoption of advanced therapies.
Key Report Takeaways
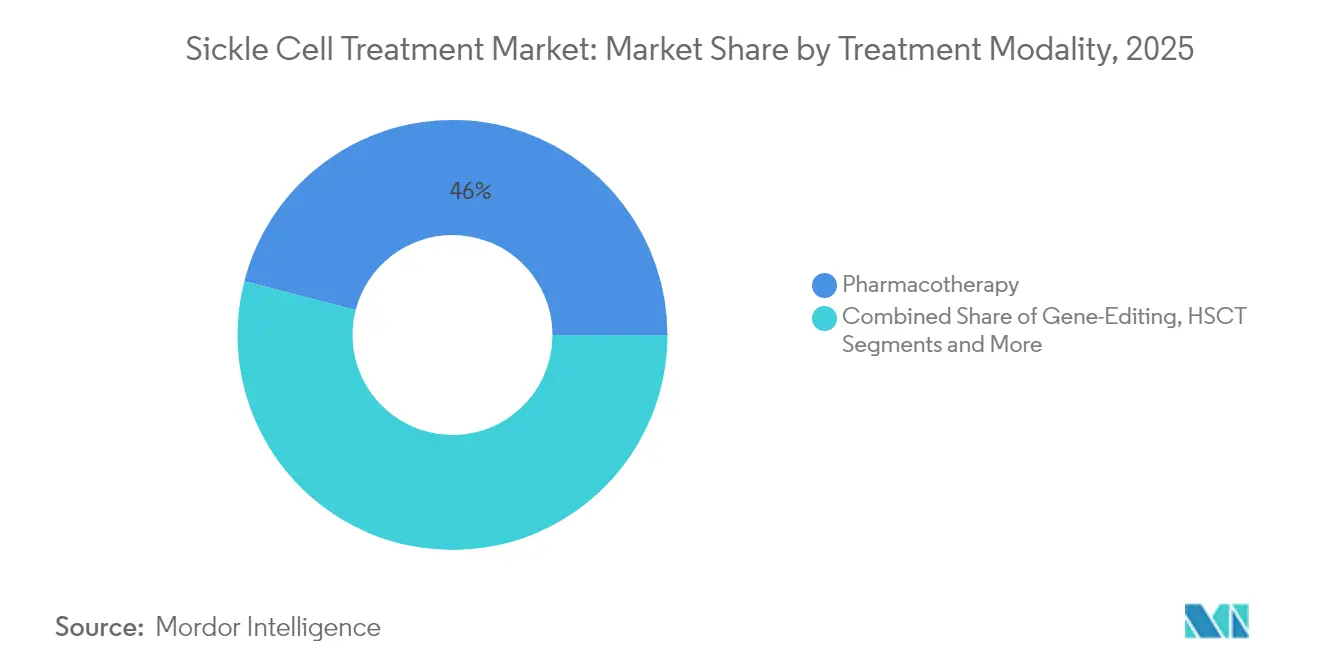
- By treatment modality, pharmacotherapy led with 45.97% of the sickle cell treatment market share in 2025, while gene-editing therapies are forecast to expand at a 17.05% CAGR through 2031.
- By patient age group, the pediatric segment accounted for 50.12% of the sickle cell treatment market size in 2025, whereas the adult segment is projected to rise at a 15.76% CAGR to 2031.
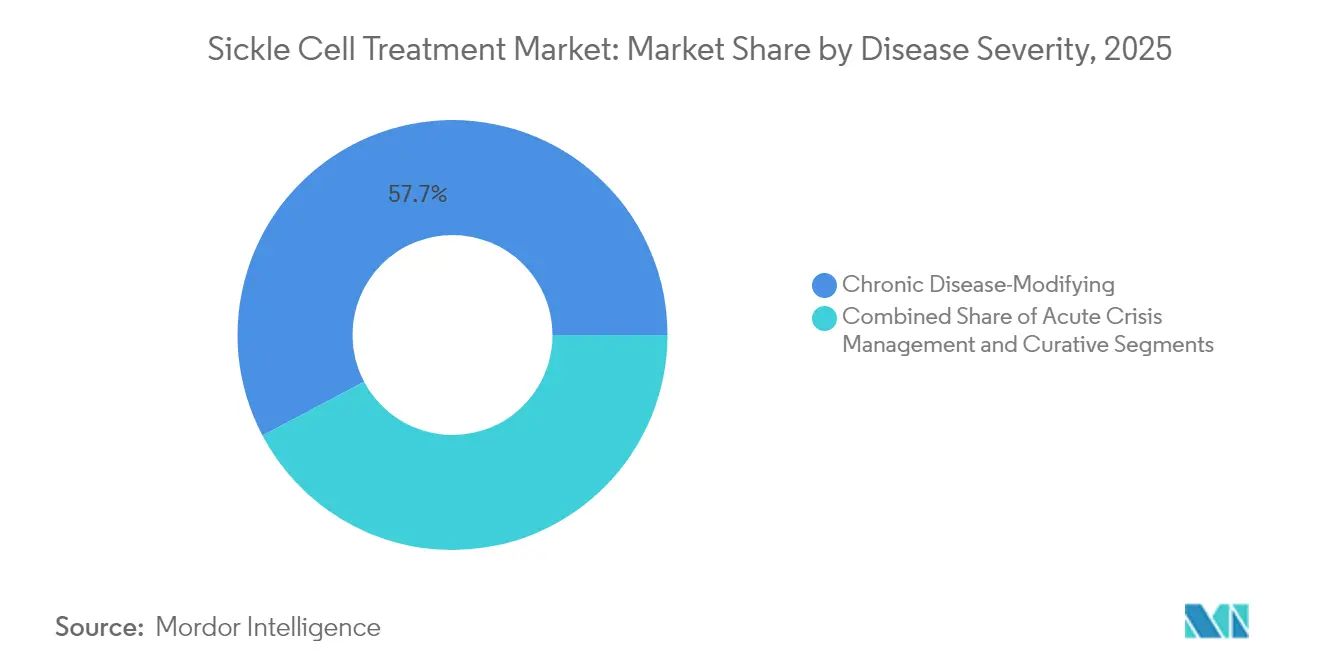
- By disease severity, chronic disease-modifying treatments held 57.74% share of the sickle cell treatment market size in 2025, while curative approaches are advancing at an 18.12% CAGR over the same period.
- By end-user, hospitals dominated with 59.05% revenue share in 2025, while ambulatory surgical centers are expected to grow at a 15.44% CAGR through 2031.
- By geography, North America led with 35.92% of sickle cell treatment market share in 2025, yet Asia-Pacific is poised for the fastest expansion at a 15.93% CAGR to 2031.
Note: Market size and forecast figures in this report are generated using Mordor Intelligence’s proprietary estimation framework, updated with the latest available data and insights as of 2026.
Global Sickle Cell Treatment Market Trends and Insights
Drivers Impact Analysis*
| Driver | (~) % Impact on CAGR Forecast | Geographic Relevance | Impact Timeline |
|---|---|---|---|
| Increasing prevalence of sickle-cell mutations | +2.1% | Global with focus on Sub-Saharan Africa and Middle East | Long term (≥ 4 years) |
| Robust late-stage R&D pipeline | +3.2% | North America and Europe with spill-over to Asia-Pacific | Medium term (2-4 years) |
| Regulatory fast-track and orphan-drug incentives | +2.8% | Global led by FDA and EMA | Short term (≤ 2 years) |
| Commercial rollout of disease-modifying drugs | +2.4% | North America expanding to Europe and Middle East | Medium term (2-4 years) |
| Expansion of newborn screening in Sub-Saharan Africa | +1.9% | Sub-Saharan Africa with pilot programs in Asia | Long term (≥ 4 years) |
| Value-based reimbursement for curative gene editing therapies | +1.8% | North America with early adoption in Europe | Medium term (2-4 years) |
| Source: Mordor Intelligence | |||
Increasing Prevalence of Sickle-Cell Mutations
Global births affected by sickle cell disease reached 515,000 in 2021, and annual mortality remains high at 376,000 deaths, sustaining multi-regional demand for therapeutic interventions. Nigeria drives one-third of the global patient pool, while migration elevates case numbers in Europe and the Gulf. National registries in Saudi Arabia track 22,956 patients across state facilities, enabling care coordination and real-world data capture.[1] Longevity gains in high-income countries create a second surge of adult patients who require long-term disease-modifying or curative options.
Robust Late-Stage R&D Pipeline
Clinical momentum remains strong as gene editors, metabolic modulators, and epigenetic regulators advance through Phase 2 and Phase 3 programs. Etavopivat shows reduction in vaso-occlusive crises, mitapivat targets red cell metabolism, and next-generation agents such as Novartis dWIZ-1 and Fulcrum’s epigenetic candidates broaden mechanisms of action.[2] Trial designs integrate patient-reported outcomes and real-world evidence, streamlining approval packages and lowering commercialization risk.
Regulatory Fast-Track & Orphan-Drug Incentives
The US FDA cleared exagamglogene autotemcel (Casgevy) and lovotibeglogene autotemcel (Lyfgenia) within a year of each other, demonstrating unprecedented acceleration under breakthrough therapy status and priority review. EMA alignment shortens European access timelines and provides unified reference pricing for payers.[3] Tax credits and seven-to-ten-year exclusivity windows enhance return-on-investment for developers targeting small populations.
Commercial Rollout of Disease-Modifying Drugs
Voxelotor, crizanlizumab, and L-glutamine expanded treatment beyond hydroxyurea monotherapy, underscoring appetite for combination regimens that better control vaso-occlusive crises. Pfizer’s 2024 withdrawal of voxelotor due to safety issues highlights post-marketing surveillance importance, yet sustained real-world efficacy of crizanlizumab preserves confidence in disease-modifying pathways fiercepharma.com.
Restraints Impact Analysis*
| Restraint | (~) % Impact on CAGR Forecast | Geographic Relevance | Impact Timeline |
|---|---|---|---|
| High total cost of care and single-use gene editing prices | -2.9% | Global with greatest strain in emerging markets | Long term (≥ 4 years) |
| Limited matched-donor availability for HSCT | -1.4% | Worldwide with higher deficit in genetically diverse regions | Long term (≥ 4 years) |
| Cold-chain and infusion-centre infrastructure gaps in LMICs | -2.1% | Sub-Saharan Africa plus parts of Asia and Latin America | Medium term (2-4 years) |
| Uneven insurance coverage and benefit-design exclusions | -1.8% | Global with variability by payer model | Medium term (2-4 years) |
| Source: Mordor Intelligence | |||
High Total Cost of Care & Single-Use Gene-Editing Prices
Commercial list prices of USD 2.2 million for Casgevy and USD 3.1 million for Lyfgenia create affordability stress despite projected lifetime savings from reduced hospitalizations. Bluebird Bio established more than 70 treatment centers, yet uptake stalled as payers negotiated outcome-linked payment schedules. Additional costs for conditioning, hospitalization, and monitoring inflate total spending envelopes, delaying widespread access.
Cold-Chain & Infusion-Centre Infrastructure Gaps in LMICs
Many high-burden African countries lack reliable electricity, advanced laboratories, and trained infusion teams required for ex-vivo gene therapy. WHO’s 2024 guidelines outline staged capacity building and financing pathways but execution remains slow. Logistics barriers persist despite philanthropic support for technology transfer and workforce training.
*Our forecasts treat driver/restraint impacts as directional, not additive. The impact forecasts reflect baseline growth, mix effects, and variable interactions.
Segment Analysis
By Treatment Modality: Gene Editing Drives Premium Growth
Gene editing commanded the fastest trajectory with a 17.05% CAGR between 2026 and 2031, reflecting strong payer interest in one-time curative interventions. Pharmacotherapy retained 45.97% of revenue in 2025, underscoring entrenched demand for hydroxyurea and recently introduced disease-modifying drugs. The sickle cell treatment market size for pharmacotherapy reached USD 1.7 billion in 2025, while gene-editing’s share was smaller but accelerating following Casgevy and Lyfgenia approvals. Stem cell transplantation continues to face donor limitations and conditioning-related morbidity that restrict procedural volumes.
Bluebird Bio and Vertex selected divergent roll-out strategies. Bluebird prioritized broad treatment-site certification, whereas Vertex focused on streamlined patient funneling through 35 hubs to improve throughput. Tessera Therapeutics explores in-vivo gene writers that could bypass harvesting and reinfusion steps, potentially lowering cost-to-serve and expanding the sickle cell treatment market in resource-limited settings.

By Patient Age Group: Adult Segment Accelerates
Adult patients aged 18-49 posted a 15.76% CAGR, supported by survival gains and inclusion in gene-therapy eligibility criteria. The pediatric segment held a 50.12% sickle cell treatment market share in 2025, backed by mandatory screening and early intervention programs. Saudi registry averages indicate a patient age of 28 years, reflecting successful transition to adult care.
Higher age groups bring cumulative organ complications, driving combination therapy regimens and multidisciplinary follow-up. Adult uptake of gene therapy is rising where financing and clinical capacity align, enlarging the sickle cell treatment market size for advanced modalities.
By Disease Severity: Curative Approaches Transform Care
Curative and potentially curative options grew at 18.12% CAGR and captured early adopters who experience severe, recurrent crises. Chronic disease-modifying agents held 57.74% of 2025 revenue, driven by hydroxyurea, crizanlizumab, and L-glutamine. Acute crisis interventions remain critical to all severity bands and anchor hospital spending. Lyfgenia resolved severe vaso-occlusive events in 94% of treated patients, while Casgevy sustained freedom from severe crises in 97% over one year.
Demonstrated durability of benefit is refocusing payer calculus from repetitive chronic expenditures to single-event cures. This pivot is expected to broaden the sickle cell treatment industry’s investment-case diversity, attracting capital to both disruptive and complementary platforms.
By End-User: Ambulatory Centers Gain Traction
Hospitals retained 59.05% of sales in 2025 given their role in emergency management and conditioning regimens, yet ambulatory surgical centers advanced at 15.44% CAGR as outpatient gene-therapy protocols gained regulatory acceptance. Network certification programs underpin reliable service quality.
Bluebird’s 70-strong site roster and Vertex’s 35-hub model underscore the on-going shift toward specialized, high-throughput centers of excellence. Academic institutes sustain trials and translational research, fuelling next-wave technology validation and education pipelines.
Geography Analysis
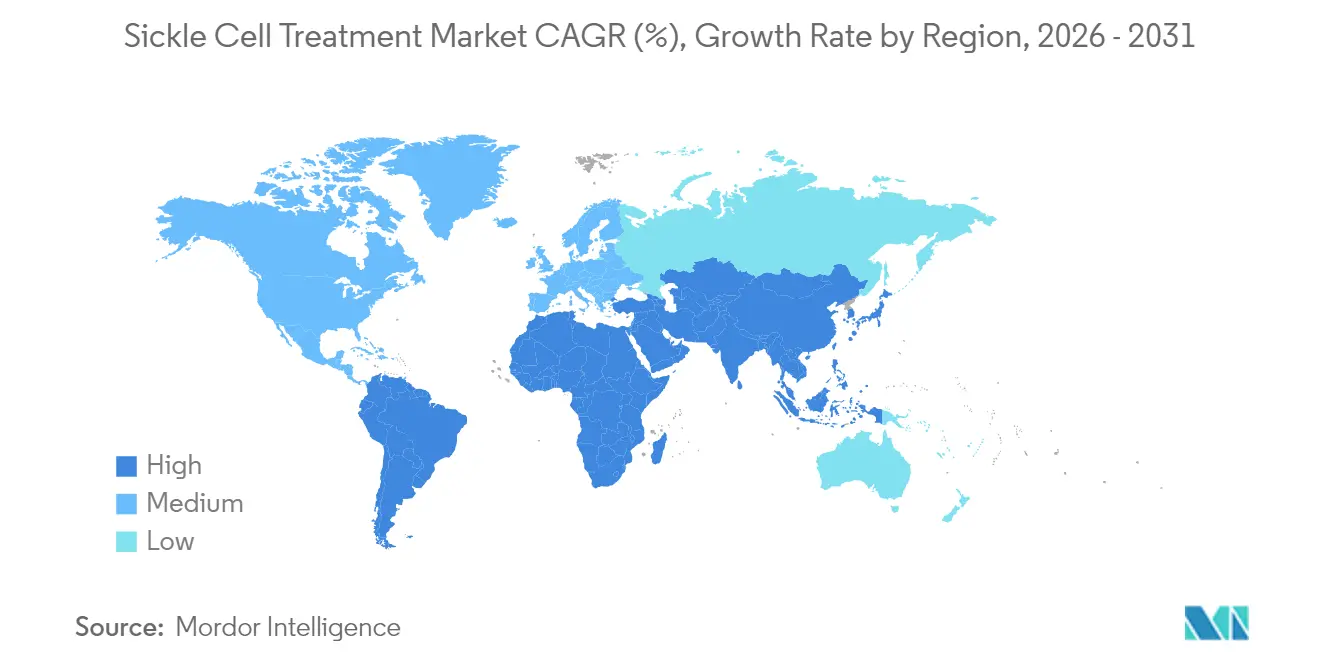
North America commanded 35.92% revenue in 2025 due to early approvals, high insurance coverage, and dense specialist networks. The United States remains the policy trendsetter, designing value-based payment models through CMS that influence global reimbursement debate. Canada and Mexico leverage provincial and social security frameworks to subsidize costly therapies, although adoption rates vary by province and funding cycle. Cross-border collaborations allow Mexican patients to access US centers, expanding treatment choices.
Asia-Pacific carries the highest growth momentum at a 15.93% CAGR. India’s National Sickle Cell Anaemia Elimination Mission implements universal screening across 17 states, integrating patient education and subsidized pharmacotherapy. The initiative enlarges the diagnosed pool and creates procurement scale for generics. Malaysia, Thailand, and Indonesia report that 78% of providers highlight treatment affordability as a primary barrier, reinforcing demand for cost-effective innovation. Regional governments negotiate tiered pricing to balance public budgets and patient outcomes, paving the way for eventual curative therapy roll-out once infrastructure matures.
Europe exhibits steady adoption anchored by strong social insurance systems and EMA regulatory synchrony. Germany and France reimburse gene editing under risk-sharing deals, while the United Kingdom pilots annuity payment structures to spread cost across budget cycles. Middle East and Africa are bifurcated. Gulf states, led by Bahrain’s first CRISPR treatment outside the United States, invest heavily in precision medicine. Sub-Saharan Africa, despite highest prevalence, confronts infrastructure limits that dull near-term adoption of advanced products. WHO’s 2024 guideline package directs donor funding toward lab capacity, workforce training, and supply-chain resilience.
Regulatory Landscape
The regulatory environment for sickle cell disease (SCD) therapies is shaped by orphan-drug frameworks and expedited review pathways, with a key inflection tied to US FDA approvals of the first gene therapies for SCD (Casgevy and Lyfgenia) in December 2023 for patients aged 12 years and older. In July 2026, the FDA expanded Casgevy use to pediatric patients aged 2 years and older, widening the labeled population and keeping regulators focused on earlier-intervention indications for high-burden rare diseases.
Across Europe, the EMA maintains active post-authorization oversight for SCD products, including an EU-wide suspension process for Oxbryta (voxelotor) that culminated in a European Commission decision in December 2025 to keep the marketing authorization suspended due to safety concerns. Health-technology assessment and commissioning decisions also drive access: NICE issued TA1044 (February 2025) recommending Casgevy with managed access for eligible patients, while NHS England (February 2025) published a commissioning statement supporting plerixafor use in Casgevy-eligible patients through prior-approval workflows. Together, these actions reflect tighter linkage between regulatory status and structured care-pathway controls.
Value Chain Analysis
The sickle cell treatment value chain spans (1) API and finished-dose manufacturing for chronic pharmacotherapies (hydroxyurea, L-glutamine, and biologics), (2) blood collection and transfusion services, and (3) highly specialized autologous cell and gene therapy pathways for Casgevy and Lyfgenia. For ex vivo gene therapies, the operational chain starts with patient identification and payer authorization, then moves through apheresis, cryopreserved transport, centralized manufacturing with release testing, and reinfusion at Authorized/Qualified Treatment Centers that can support cryostorage, cell handling, and myeloablative conditioning.
In practice, constraints have shifted from molecule supply toward site readiness and vein-to-vein orchestration. 2026 field reports flagged stem-cell collection yield and apheresis capacity as practical bottlenecks for Casgevy, extending the time from enrollment to infusion, commonly cited around 8 to 10 months in commercial implementation discussions. These dependencies increase the importance of certified hospital hubs, specialty labs, cryoshipping providers, and center-of-excellence networks, while also raising the need for standardized payer processes and scheduling coordination across manufacturers, treatment centers, and transplant-capable units.
Competitive Landscape
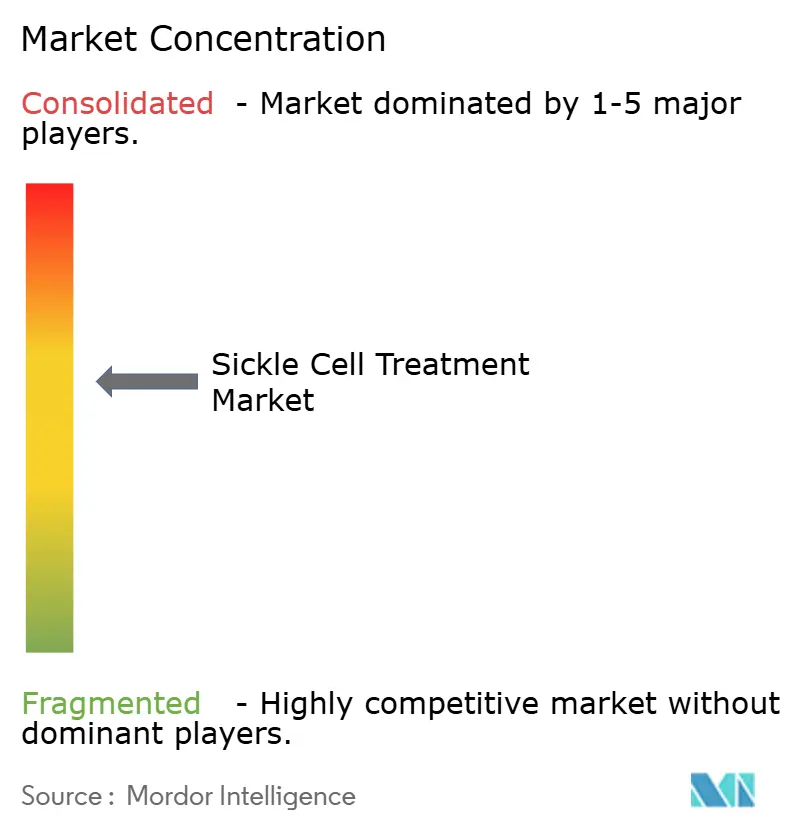
Market concentration is moderate. Vertex Pharmaceuticals and CRISPR Therapeutics enjoy first-mover advantage in gene editing through Casgevy, securing premium positioning and brand recognition. Bluebird Bio offers the sole alternative autologous gene therapy but wrestles with slower enrollment tied to financing complexity. Novartis spans both conventional and next-generation segments with hydroxyurea generics, crizanlizumab, and a pipeline of targeted agents. Pfizer’s exit from voxelotor underscores volatility in post-launch safety surveillance.
Emergent technology differentiators include in-vivo gene writers, lipid nanoparticle delivery, and oral modulators aimed at hemoglobin polymerization. Tessera Therapeutics, backed by the Gates Foundation, pursues single-dose intravenous administration that could disrupt resource-intensive ex-vivo protocols. Generic manufacturers hold volume leadership in hydroxyurea, preserving cost-effective options for public programs in Africa and South Asia. Competitive battlegrounds now extend beyond molecules to integrated care models, site certification, and real-world data partnerships that demonstrate durability and health-economic value.
Sickle Cell Treatment Industry Leaders
-
Novartis AG
-
Sanofi SA
-
Pfizer
-
Vertex Pharmaceuticals Inc.
-
CRISPR Therapeutics AG
- *Disclaimer: Major Players sorted in no particular order
Market Opportunities and Future Outlook
A key whitespace is improved access and throughput for curative therapies, where eligibility expansion and center capacity translate into additional treated patients. The US FDA label expansion for Casgevy in July 2026 to patients aged 2 years and older expands the pediatric addressable pool and adds pressure for earlier diagnosis, referral, and conditioning-capable infrastructure. This creates opportunities for hospitals, specialty clinics, and supporting service providers (apheresis, cryologistics, and transplant units) that can meet Authorized Treatment Center requirements.
Payment design and regional localization also remain active opportunity areas, as public payers and national systems formalize pathways to manage high one-time costs. US Medicaid-oriented reimbursement frameworks are becoming more operationalized, including state-level guidance aligned to the CMS Cell and Gene Therapy Access Model (for example, Connecticut Department of Social Services billing guidance issued in January 2026) and outcomes-based contracting activity initiated by gene-therapy sponsors. Internationally, manufacturing and commercialization partnerships that shorten logistics and strengthen local supply are emerging, illustrated by Genetix Biotherapeutics (formerly bluebird bio) announcing an agreement with SPIMACO in June 2026 to commercialize and manufacture Lyfgenia and Zynteglo in Saudi Arabia and the Middle East. The arrangement supports market development where infrastructure investment and registry-driven care coordination are already visible.
Recent Industry Developments
- July 2026: Vertex Pharmaceuticals announced that the US FDA approved expanded use of Casgevy (exagamglogene autotemcel) for patients aged 2 years and older with severe sickle cell disease with recurrent vaso-occlusive crises. The younger-age label increases the eligible pool and intensifies demand for pediatric-capable authorized treatment centers, apheresis capacity, and conditioning infrastructure.
- June 2025: Vascarta Inc. received US FDA Orphan Drug Designation for VAS-101 for the treatment of sickle cell disease. The designation adds development incentives and increases competitive intensity in the pipeline beyond established disease-modifying drugs and first-wave gene therapies.
- September 2024: Pfizer voluntarily withdrew Oxbryta (voxelotor) from global markets following clinical data indicating an imbalance of vaso-occlusive crises and fatal events. The withdrawal removed a widely used disease-modifying option and increased reliance on remaining pharmacotherapies while sharpening scrutiny on post-marketing safety surveillance.
Research Methodology Framework and Report Scope
Market Definition and Coverage
This market covers the value of therapies used to treat sickle cell disease across major care settings, counting drug-based treatment and related disease-modifying approaches that are used in routine clinical practice.
Scope exclusions: We exclude screening and diagnostic tests, blood bank operations, and broader hospital procedure revenues that are not directly tied to drug treatment value.
Segmentation Overview
- By Treatment Modality
- Blood Transfusion
- Hematopoietic Stem-Cell Transplant (HSCT)
- Pharmacotherapy
- Hydroxyurea
- L-Glutamine
- Voxelotor
- Crizanlizumab
- Others (incl. Pain-management, Folic Acid)
- Gene-Editing / Gene-Addition Therapies
- By Patient Age Group
- Paediatric (0–17 yrs)
- Adult (18–49 yrs)
- Older Adult (50 yrs +)
- By Disease Severity / Clinical Objective
- Acute Crisis Management
- Chronic Disease-Modifying
- Curative / Potentially Curative
- By End-User
- Hospitals
- Specialty Clinics
- Ambulatory Surgical Centres
- Academic & Research Institutes
- By Geography
- North America
- United States
- Canada
- Mexico
- Europe
- Germany
- United Kingdom
- France
- Italy
- Spain
- Rest of Europe
- Asia-Pacific
- China
- Japan
- India
- Australia
- South Korea
- Rest of Asia-Pacific
- Middle East and Africa
- GCC
- South Africa
- Rest of Middle East and Africa
- South America
- Brazil
- Argentina
- Rest of South America
- North America
Data Sources, Market Sizing, and Validation
Desk Research
Desk research starts with building the addressable patient and treatment pool, then aligning it to how therapies are actually used and paid for in each region. Public sources such as the US CDC, the World Health Organization, the National Institutes of Health, and the UK NHS help us anchor prevalence, screening practices, and care pathways that shape treated share. We also review clinical trial registries and peer-reviewed journals to check therapy adoption timing, label expansions, and changes in standard of care.
On the commercial side, we review company filings, investor materials, and reputable press coverage to understand launch sequencing, access changes, and demand signals that influence realized sales. Where needed, we use paid subscriptions for company financial intelligence, patent databases, and shipment-level import and export checks to validate supply availability and country presence. The desk sources listed here are illustrative only, and we also consulted other public documents for data collection, cross-checks, and clarification.
Primary Interviews and Surveys
Primary work focuses on validating what desk research cannot fully show, such as real world treatment mix, access friction, and the speed at which newer therapies are being adopted. We spoke with a mix of clinicians, hospital pharmacy stakeholders, payers, distributors, and industry participants across Americas, EMEA, and APAC so regional differences in diagnosis, reimbursement controls, and supply could be reflected in the final model.
Distribution of primary research fieldwork respondents
| Company type | Respondent position | Region |
|---|---|---|
| Top tier: 31% | CXOs: 15% | APAC: 45% |
| Mid tier: 54% | Functional/Unit leaders: 34% | EMEA: 34% |
| Smaller Players: 15% | Managers: 51% | Americas: 21% |
Market-Sizing & Forecasting
Sizing is built around a demand-pool structure, where prevalence and diagnosed population are converted into a treated cohort, then mapped to therapy use in each geography. Once the treated pool is set, value is derived using therapy class mix and typical annual treatment cost levels, and then adjusted for access and payer controls that influence real utilization. To keep the model grounded, we also run selective top-down and bottom-up checks, comparing reported sales signals and sampled price times volume logic back to the demand pool, and we correct the model when we see gaps.
Key inputs that materially move the totals include diagnosed sickle cell population, share of patients on disease-modifying therapy, therapy switching rate after new launches, persistence and discontinuation patterns, reimbursement coverage and prior authorization intensity, and expected timing of label expansions. Forecasts are built using scenario analysis, because future uptake depends on access decisions, physician comfort, and the pace at which newer modalities move beyond early adopter centers. Where country detail is thin, we bridge gaps using regional analogs with similar care infrastructure and then validate those assumptions through follow-up calls.
Data Validation & Update Cycle
Outputs are checked against independent signals, including diagnosed population ranges, therapy utilization markers, and publicly visible sales direction, then reviewed for outliers at the country and region level. If a variance looks too large to be explained by epidemiology or access, we re-test assumptions and re-contact selective respondents before sign-off.
The dataset is refreshed on an annual cycle, and interim updates are made when material events occur, such as a major approval, safety restriction, or pricing change that can alter adoption. Before a client delivery, an analyst performs a last pass to ensure the numbers reflect the latest available public information and validated assumptions.
Mordor Intelligence's Sickle Cell Treatment Market Size Compared With Other Published Estimates
Published market values for sickle cell treatment can look far apart because the underlying model choices are not the same, even when the market name sounds identical. Differences usually come from what is counted as treatment value, which countries are included, and how fast newer therapies are assumed to scale.
Key gap drivers tend to be scope and uptake logic, where some estimates include adjacent services or count pipeline value early, and others use aggressive adoption curves that assume quick reimbursement expansion. By tracking treated patient pool changes, checking therapy mix shifts, and refreshing access assumptions through interviews, Mordor Intelligence keeps the total tied to observable diagnosis and utilization realities, instead of relying mainly on long-range launch optimism.
Benchmark comparison
| Source | Market Size | Gaps in Research Methodology |
|---|---|---|
| Mordor Intelligence | USD 4.23 B (2026) | |
| Trade Journal A | USD 3.23 B (2024) | This estimate appears to anchor heavily on a single base year view and then applies a steep growth curve, which can understate near-term value if therapy mix and pricing are treated conservatively, and overstate longer-term value if access expansion is assumed to be smooth across regions. |
| Industry Publisher B | USD 3.24 B (2024) | The scope and geography list is broad, but the method summary suggests faster conversion of diagnosed patients into treated patients, which can inflate the addressable pool in markets where diagnosis rates and reimbursement coverage still constrain real utilization. |
The spread in the table is largely explained by timing and what is assumed about treated share acceleration, which is why year alignment and clear inclusion rules matter as much as the math. When the treated cohort build-up, therapy mix, and access gates are made explicit and then re-checked, the result is a more traceable number that can be replicated and stress-tested.
Key Questions Answered in the Report
What is the current size of the sickle cell treatment market?
The sickle cell treatment market size is valued at USD 4.23 billion in 2026 with a projected USD 8.41 billion value by 2031.
Which treatment modality is growing the fastest?
Gene-editing therapies are expanding at a 17.05% CAGR, reflecting early adoption of curative options such as Casgevy and Lyfgenia.
Why is Asia-Pacific expected to grow rapidly?
Government initiatives like India’s National Sickle Cell Anaemia Elimination Mission, improved screening, and rising healthcare investment propel a 15.93% CAGR in the region.
How do high therapy prices affect market growth?
List prices above USD 2 million limit access, reduce uptake speed, and subtract up to 2.9% from the forecast CAGR where financing mechanisms are weak.
What reimbursement models are emerging for curative therapies?
Value-based agreements such as CMS’s Cell and Gene Therapy Access Model tie payments to long-term patient outcomes to mitigate high upfront costs.
What years does this Sickle Cell Treatment Market cover, and what was the market size in 2025?
In 2025, the Sickle Cell Treatment Market size was estimated at USD 4.23 billion. The report covers the Sickle Cell Treatment Market historical market size for years: 2019, 2020, 2021, 2022, 2023 and 2024. The report also forecasts the Sickle Cell Treatment Market size for years: 2026, 2027, 2028, 2029, 2030 and 2031.