
Sharps Containers Market Size and Share
Market Overview
| Study Period | 2020 - 2031 |
|---|---|
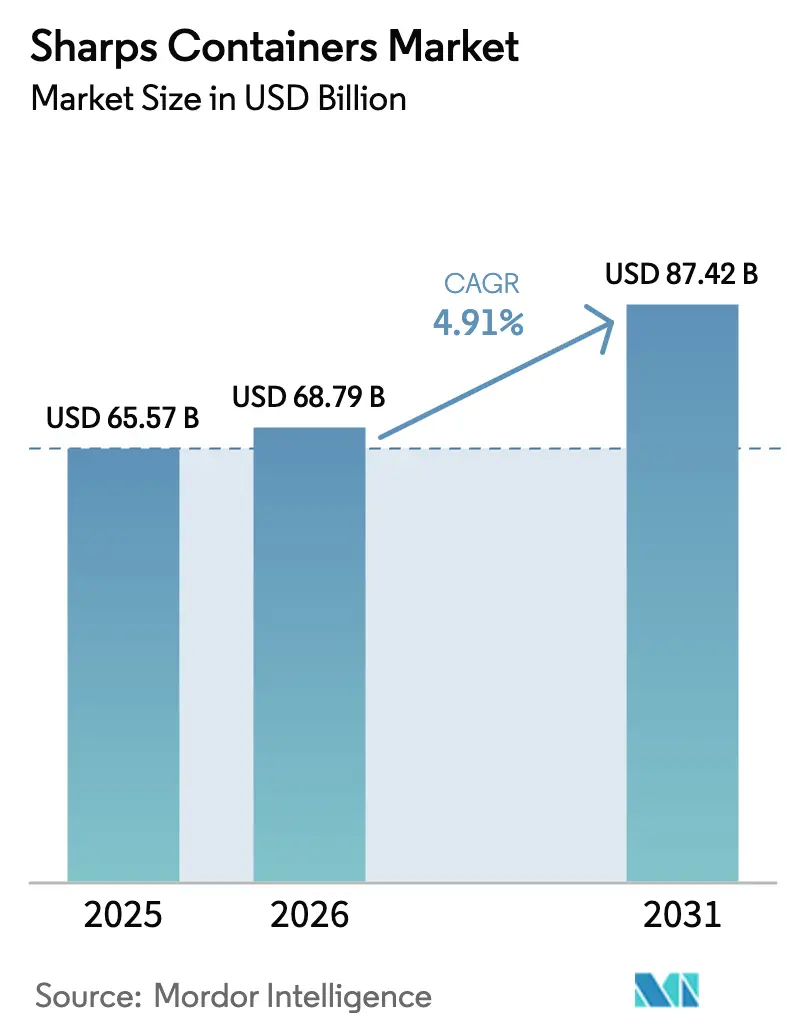
| Market Size (2026) | USD 68.79 Billion |
| Market Size (2031) | USD 87.42 Billion |
| Growth Rate (2026 - 2031) | 4.91 % |
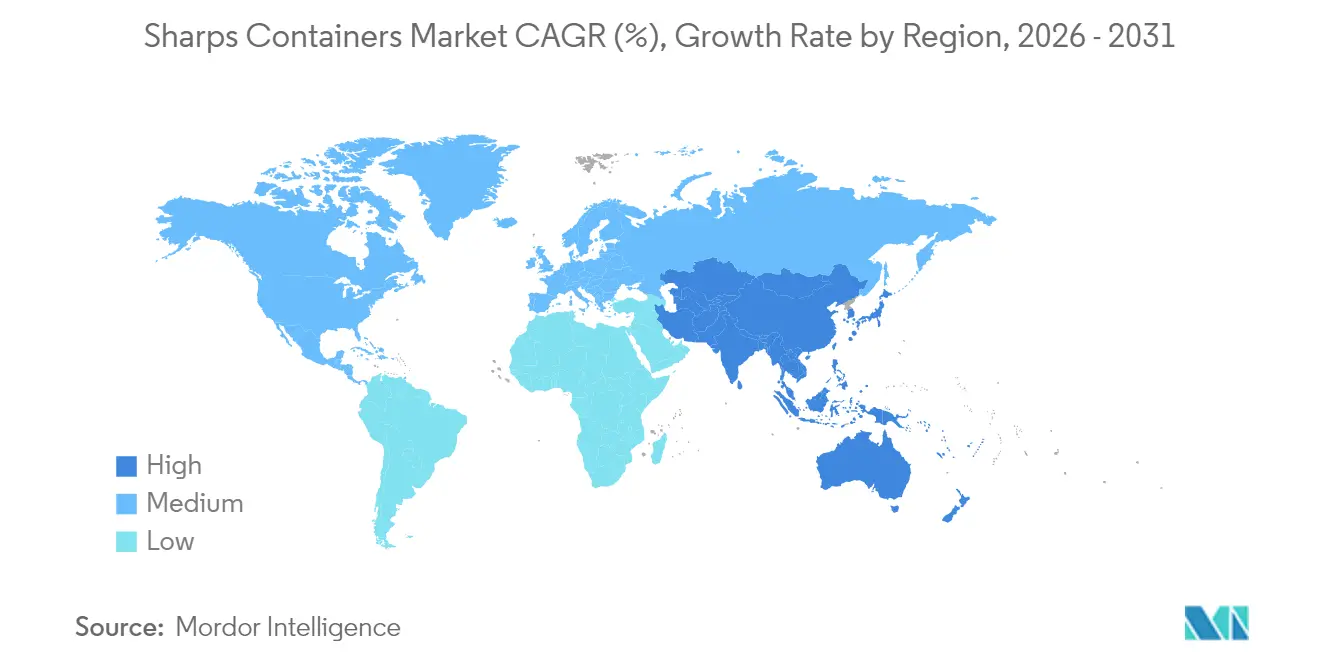
| Fastest Growing Market | Asia Pacific |
| Largest Market | North America |
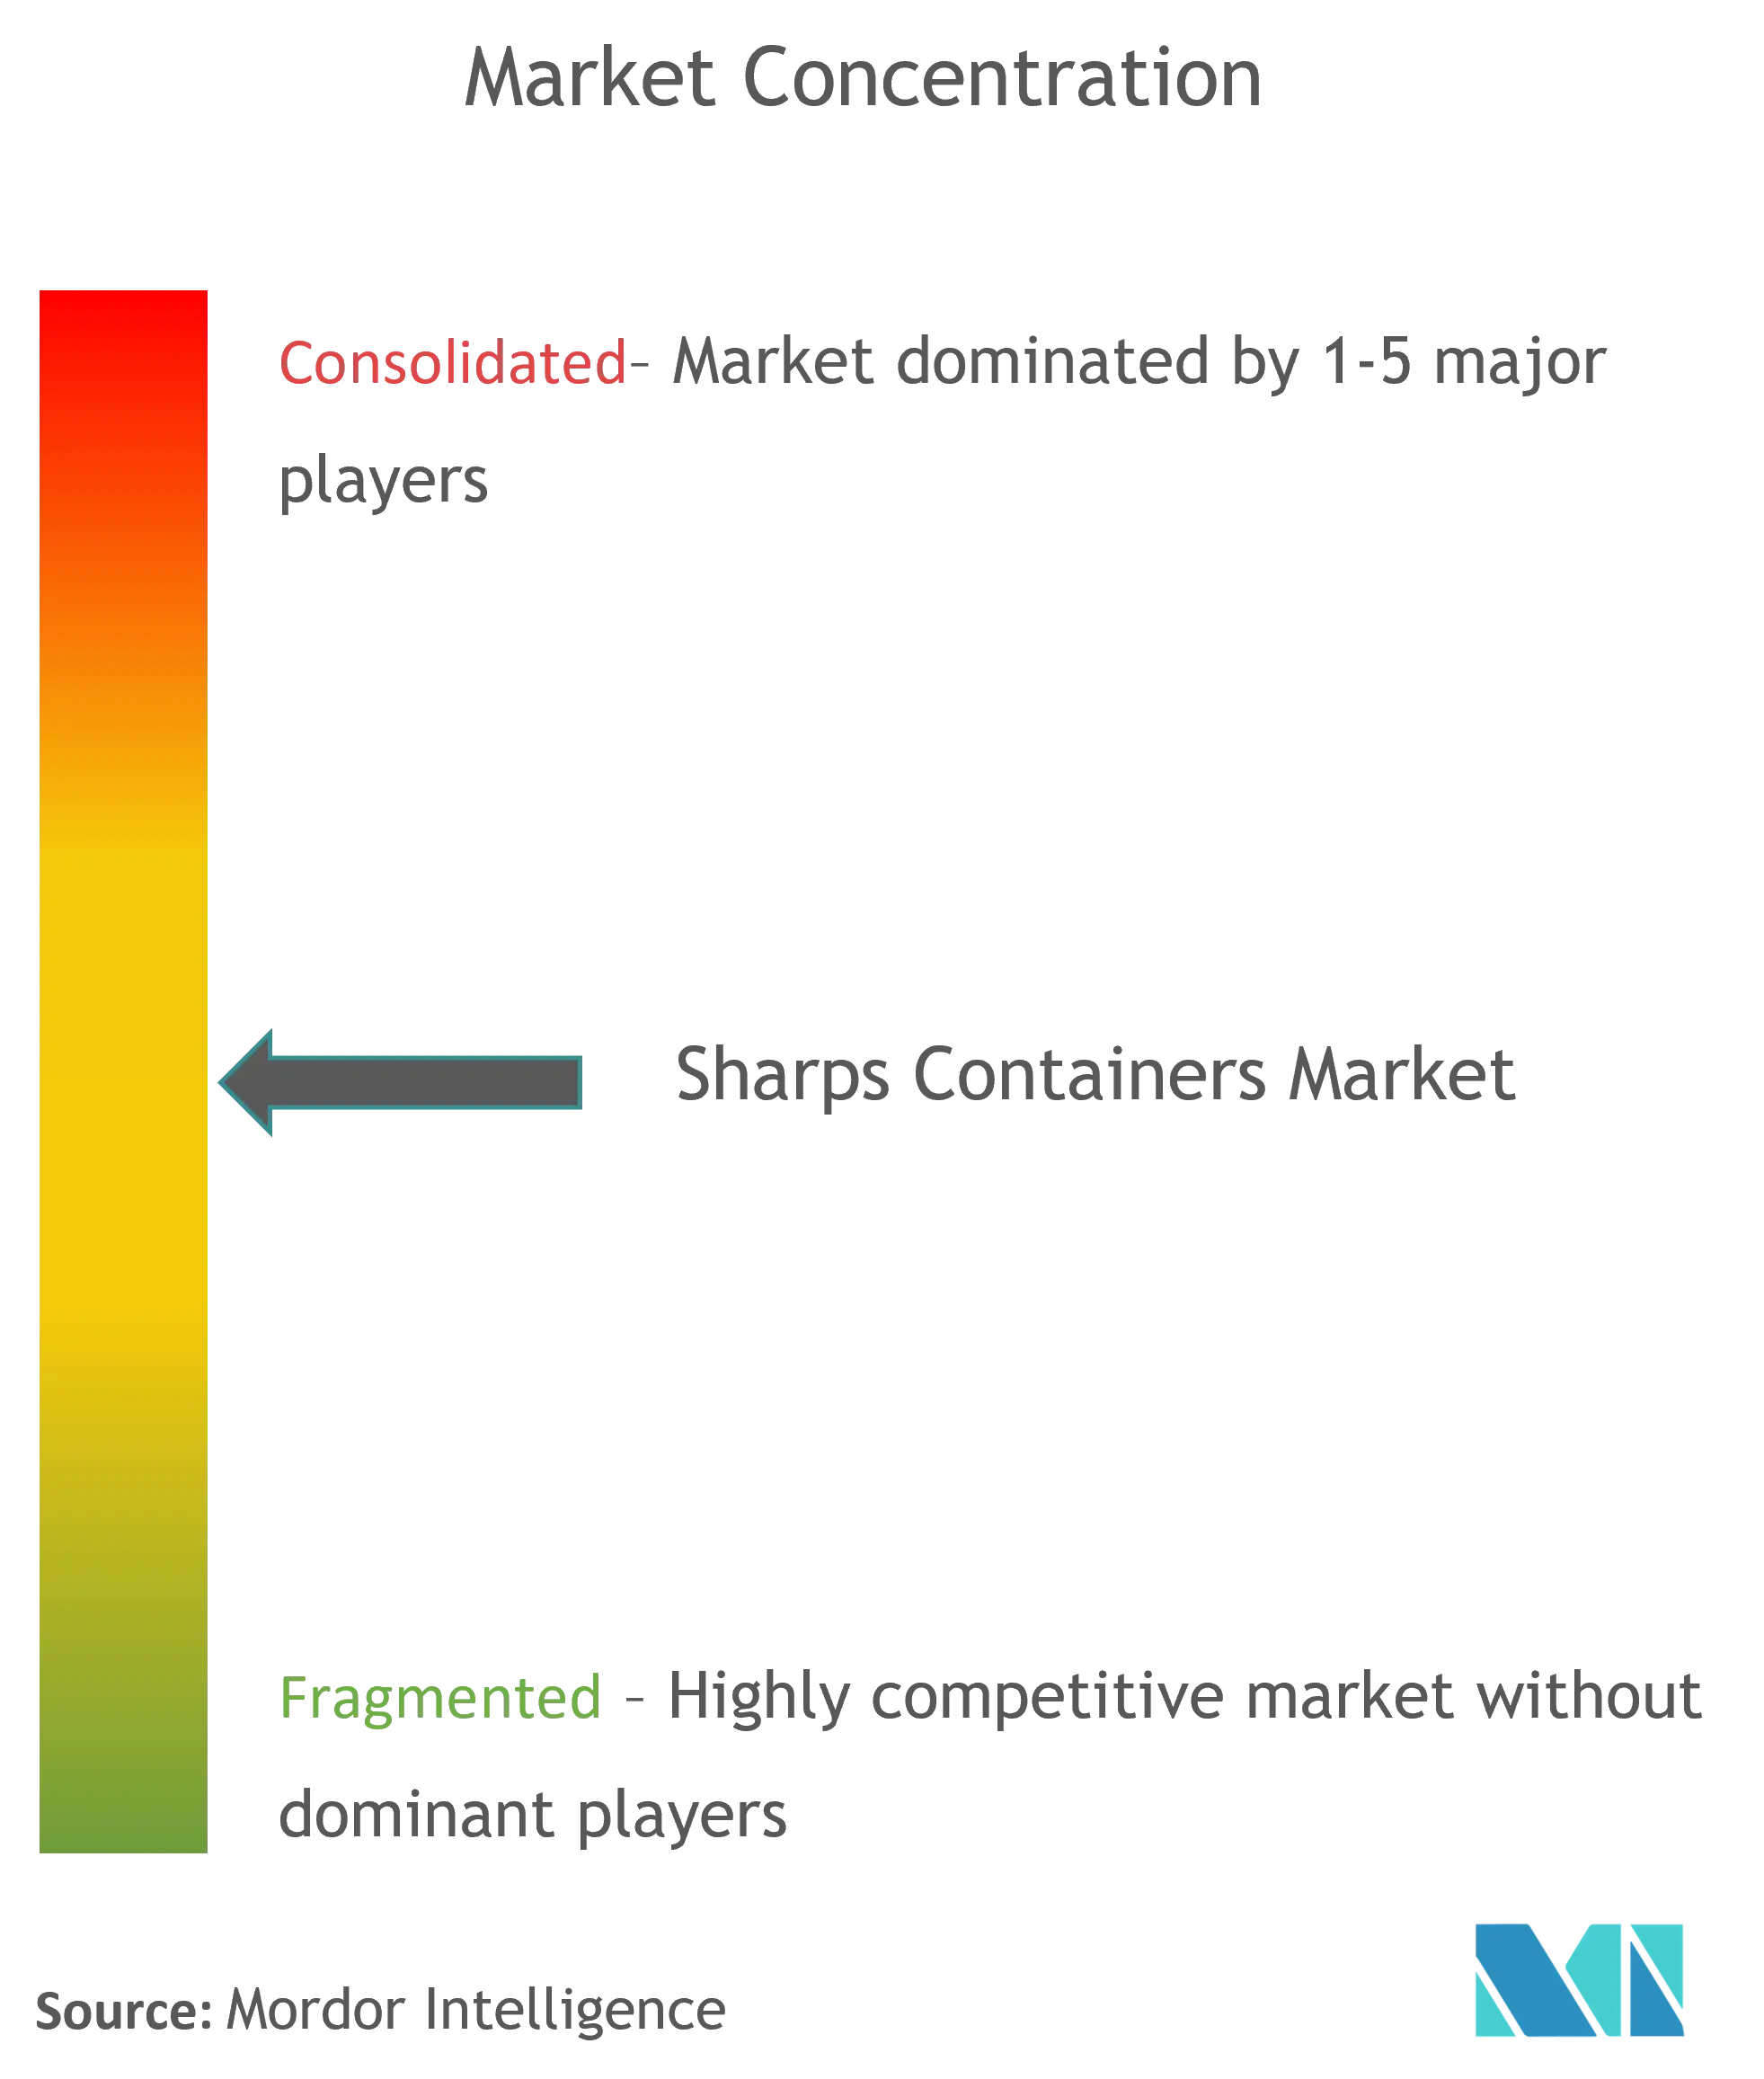
| Market Concentration | Medium |
Major Players *Disclaimer: Major Players sorted in no particular order Image © Mordor Intelligence. Reuse requires attribution under CC BY 4.0. | |
Sharps Containers Market Analysis by Mordor Intelligence
The sharps containers market size was valued at USD 65.57 million in 2025 and estimated to grow from USD 68.79 million in 2026 to reach USD 87.42 million by 2031, at a CAGR of 4.91% during the forecast period (2026-2031). North America remains the revenue anchor, while Asia-Pacific delivers the steepest growth slope. Regulatory tightening, chronic-disease-driven injectable therapy demand, and the pivot toward reusable systems shape competitive positioning. Suppliers are now differentiating on lifecycle compliance, safety engineering, and environmental credentials rather than on container volumes or price alone. Sustainability targets, home-care expansion, and digital procurement are restructuring value creation across the sharps containers market.
Key Report Takeaways
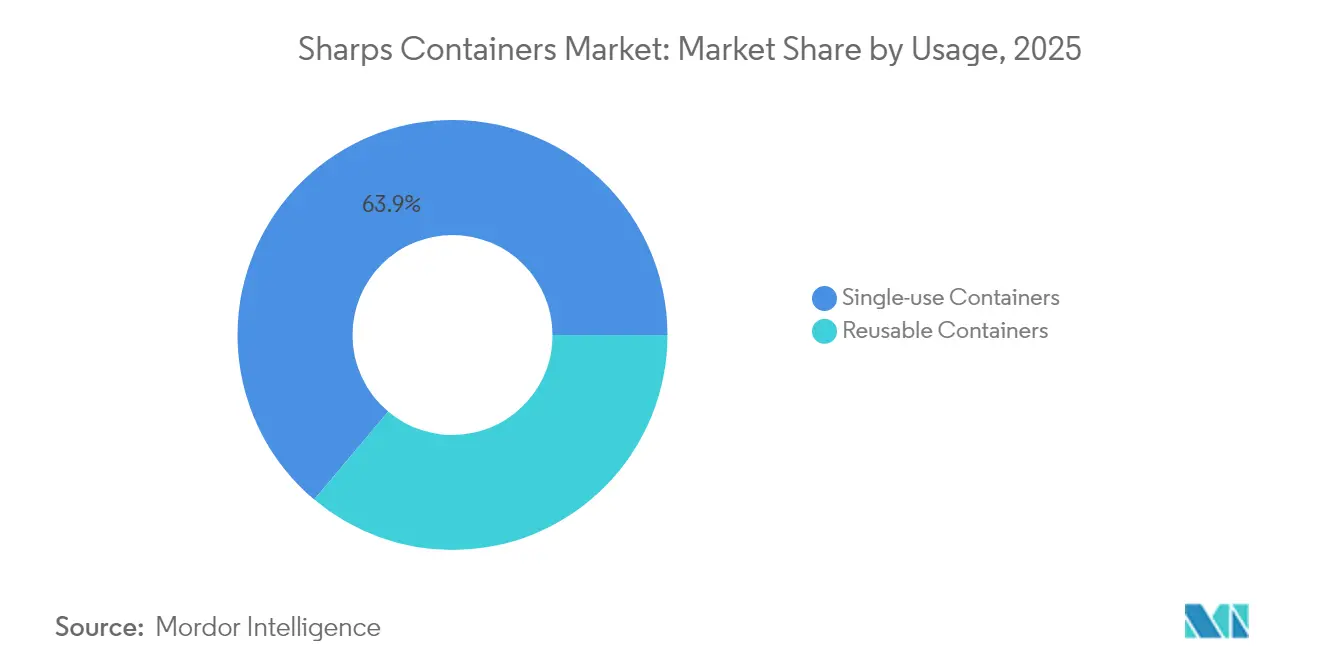
- By usage, single-use systems led with 63.88% revenue share in 2025; reusable solutions are forecast to expand at a 6.28% CAGR through 2031.
- By type, multipurpose designs held 41.90% of the sharps containers market share in 2025, while patient-room units are set to grow fastest at 6.57% CAGR to 2031.
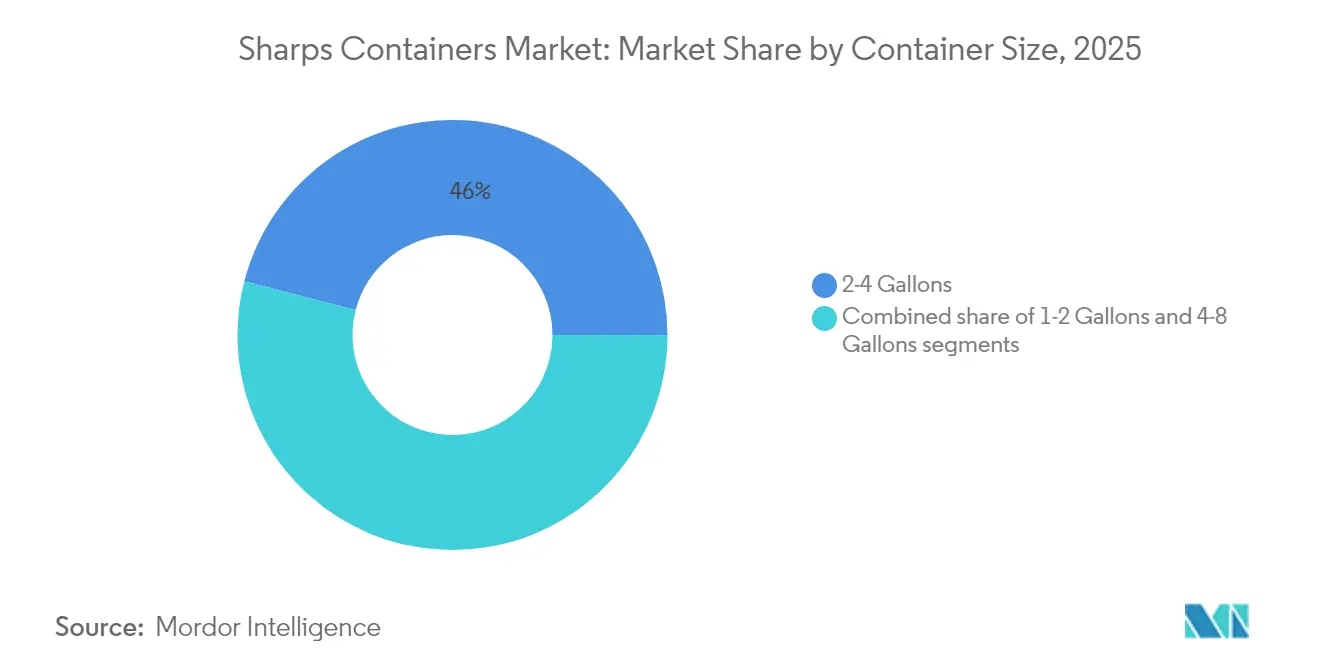
- By container size, the 2-4 gallon band captured 45.98% share of the sharps containers market size in 2025; the 4-8 gallon band will advance at 6.78% CAGR over 2026-2031.
- By distribution channel, direct sales accounted for 50.92% of 2025 revenue; online sales are projected to post a 7.11% CAGR through 2031.
- Geographically, North America led with 35.12% revenue in 2025; Asia-Pacific is forecast to post a 5.44% CAGR, the fastest worldwide.
Note: Market size and forecast figures in this report are generated using Mordor Intelligence’s proprietary estimation framework, updated with the latest available data and insights as of 2026.
Market Trends and Insights
Drivers Impact Analysis of Sharps Containers Market*
| Driver | % Impact on CAGR Forecast | Geographic Relevance | Impact Timeline |
|---|---|---|---|
| Stringent Healthcare Waste Management Regulations | +1.2% | North America, EU, global roll-out | Long term (≥ 4 years) |
| Growing Healthcare Service Utilization Worldwide | +0.9% | Global; strongest in Asia-Pacific | Medium term (2–4 years) |
| Increasing Prevalence Of Chronic Diseases Requiring Injectable Therapies | +1.1% | Developed economies, expanding globally | Long term (≥ 4 years) |
| Rising Adoption Of Reusable And Eco-Friendly Sharps Disposal Solutions | +0.7% | North America, EU, early adoption in Asia-Pacific | Medium term (2–4 years) |
| Rapid Expansion Of Healthcare Infrastructure In Emerging Markets | +0.8% | Asia-Pacific core, spill-over to Middle East & Africa | Short term (≤ 2 years) |
| Technological Advancements In Safety And Tracking Of Sharps Containers | +0.5% | North America, EU, gradual Asia-Pacific penetration | Long term (≥ 4 years) |
| Source: Mordor Intelligence | |||
Stringent Healthcare Waste Regulations
OSHA, FDA, and state-level rule changes, such as Michigan’s 18-month storage allowance for containers < 75% full and Ohio’s pathway for controlled container reuse, require continuous compliance investments. The forthcoming EU Packaging and Packaging Waste Regulation extends recyclability mandates while maintaining patient-safety exemptions, aligning environmental goals with infection-control imperatives. Large vendors leverage compliance expertise to consolidate regional share, while smaller providers exit or partner for scale.
Growing Healthcare Service Utilization Worldwide
Hospital outpatient shifts and home-care therapy growth are accelerating container demand in smaller formats. U.S. hospitals still generate more than 29 lb of waste per occupied bed daily, with sharps a key infectious fraction. Asia-Pacific bed additions and specialty-pharmacy expansion reinforce baseline volume growth.
Increasing Prevalence of Chronic Diseases Requiring Injectable Therapies
The CDC counts 76.4% of U.S. adults with at least one chronic condition in 2025, sustaining high injectable drug volumes[1]Centers for Disease Control and Prevention, “Guidelines for Safe Work Practices in Human and Animal Medical Diagnostic Laboratories,” cdc.gov. GLP-1 pen usage for diabetes and obesity multiplies single-patient sharps waste streams and prompts pharmacy collection programs.
Rising adoption of reusable and eco-friendly sharps disposal solutions
Daniels Health reports 90% CO₂-equivalent reductions and 7,000 lb annual plastic savings per 100 occupied beds when hospitals switch to its Sharpsmart system. ESG-driven procurement increasingly stipulates lifecycle impact metrics, spurring conversion from disposable to reusable systems.
Restraints Impact Analysis of Sharps Containers Market*
| Restraints Impact Analysis | (~) % Impact on CAGR Forecast | Geographic Relevance | Impact Timeline |
|---|---|---|---|
| Operational Challenges In Segregation And Collection Of Sharps Waste | -0.8% | Global, most pronounced in developing regions | Medium term (2–4 years) |
| High Cost Of Compliance For Healthcare Facilities | -0.6% | Global, with varying impact by healthcare system maturity | Long term (≥ 4 years) |
| Limited Waste Management Infrastructure In Developing Regions | -0.7% | Developing regions | Long term (≥ 4 years) |
| Supply Chain Disruptions And Raw Material Price Volatility | -0.4% | Global | Short term (≤ 2 years) |
| Source: Mordor Intelligence | |||
Operational challenges in segregation and collection
A Portuguese microbiology lab found sharps misclassification in 2.79% of daily waste, heightening exposure risks and disposal costs. Similar findings across emerging markets reveal skills gaps that drive training and technology spending.
High cost of compliance for healthcare facilities
U.S. hospitals spend an estimated USD 760 billion-935 billion annually on waste-related activities, with documentation and audit overhead accounting for a meaningful share. Smaller clinics increasingly outsource to integrated providers to mitigate fixed-cost pressure.
*Our forecasts treat driver/restraint impacts as directional, not additive. The impact forecasts reflect baseline growth, mix effects, and variable interactions.
Sharps Containers Market Segment Analysis
By Usage:
Reusable Systems Challenge Disposable DominanceSingle-use units kept a 63.88% revenue lead in 2025. However, reusable formats are projected to grow at 6.28% CAGR, supported by lifecycle cost modeling and ESG scoring. Daniels Health documents up to 87% cuts in container-related needlestick injuries after reusable adoption. Large hospital networks account for most conversions, aligning with volume thresholds that justify processing infrastructure. The sharps containers market size for reusable formats is expected to surpass USD 34.1 million by 2031 alongside regulatory credits tied to carbon disclosure.
Reusable penetration faces logistics hurdles in small practices, yet service providers now offer regional processing hubs and RFID-enabled asset tracking to close capability gaps. As public sustainability reporting frameworks such as GRI expand into healthcare, reusable share gains will accelerate.


By Type:
Patient-Room Containers Drive Point-Of-Care EfficiencyMultipurpose containers held 41.90% revenue in 2025. Patient-room designs will register the fastest gains at 6.57% CAGR thanks to bedside care models. Horizontal entry lids, clear fill windows, and wall-mount frames reduce transport steps and injury exposure. Clinical evidence links immediate disposal at the use site with reduced needlestick events, reinforcing procurement preference.
Engineered features now include passive overfill locks and tamper-evident seals to satisfy OSHA’s secure-closure criteria. Suppliers offering modular mounting kits capture incremental revenue from retrofit projects in existing wards.
By Container Size:
Mid-Range Capacity Optimizes Handling EfficiencyThe 2-4 gallon class commanded 45.98% of revenue in 2025. Yet high-acuity departments increasingly favor 4-8 gallon vessels, propelling a 6.78% CAGR. Larger bins cut change-out labor and support RFID-based route optimization. Conversely, 1-2 gallon units defend share in home infusion and ambulatory surgery centers where storage footprints are constrained.
Hospitals adopt mixed-size strategies mapped to procedural throughput analytics. The sharps containers market share held by 4-8 gallon models is forecast to climb to 32.40% by 2031, reshaping SKU portfolios.
By Distribution Channel:
Digital Transformation Accelerates Online GrowthDirect contracts still deliver 50.92% of 2025 revenue, driven by consultative selling. Online platforms will grow at 7.11% CAGR as group purchasing organizations automate reorder workflows. Henry Schein’s marketplace expansion to 8,000 non-clinical SKUs exemplifies the pivot to e-procurement convenience. Vendor portals now integrate SDS libraries and compliance dashboards, embedding value beyond price.
Geography Analysis
North America Sharps Containers Market
North America generated 35.12% of 2025 revenue and posts stable low-single-digit growth under mature OSHA-FDA oversight. Hospitals deploy smart fill-level telemetry and statewide rule updates, such as Michigan’s storage-period extension, to fine-tune collection logistics. The sharps containers market size in the region reached USD 24.15 million in 2026 and is projected at USD 30.66 million by 2031.
APAC Sharps Containers Market
Asia-Pacific is the sprint leader with 5.44% CAGR. China and India’s hospital bed expansions, coupled with 774 metric-ton daily biomedical waste peaks, strain existing disposal capacity and unlock demand for compliant sharps solutions. Government funding for waste-treatment plants and private-hospital chains catalyze procurement cycles. Cross-border suppliers partner with local collectors to navigate evolving licensing norms.
Europe Sharps Containers Market
Europe maintains moderate growth as the EU’s 2025/40 packaging regulation incentivizes recyclable and reusable medical packaging while retaining infection-control provisions. Scandinavian and UK health systems highlight 90% CO2 reductions from reusable programs, setting reference benchmarks for continental tenders.
MEA and South America Sharps Containers Market
South America, Middle East, and Africa show heterogeneous patterns. Gulf Cooperation Council hospitals pursue JCI accreditation, lifting demand for UN-rated containers, while parts of Africa face capacity shortfalls that delay market development.
Mordor Intelligence provides coverage of the sharps containers market across other key regional markets, including Europe, each with their regulatory frameworks and demand patterns.

Regulatory Landscape
Sharps-container regulation sits across medical-device safety and regulated medical waste handling. In the United States, sharps containers are treated as FDA Class II devices (21 CFR 880.5570, product code MMK), and procurement specifications commonly track consensus expectations for puncture resistance, leak resistance, and secure closure. Globally, ISO 23907-1:2019 remains the core benchmark for single-use sharps containers, while ISO 23907-2:2019 sets performance, cleaning, and decontamination requirements for reusable systems. The ISO 23907-1 standard was reaffirmed in a July 2024 systematic review cycle, which supports cross-border tender harmonization.
On the waste-management side, occupational safety and infection-control requirements, including OSHA bloodborne pathogens controls in the US, push facilities toward point-of-use disposal and documented handling processes. WHO guidance for health-care waste management continues to emphasize standardized sharps containment, including safety boxes for both high-resource and low-resource settings. Across major markets, the direction of travel combines tighter documentation and container engineering requirements, such as overfill protection and tamper resistance, with sustainability-driven packaging rules that differentiate reusable versus single-use programs in hospital and outpatient purchasing.
Value Chain Analysis
The value chain starts with resin and additives suppliers, then container design and molding (or board-based converting for alternative formats), followed by regulatory testing against ISO performance requirements. On the go-to-market side, the chain reaches buyers through direct contracts, distributors, and increasingly online channels. Downstream, value extends into mounting and accessory systems, route-based collection, and treatment or reprocessing infrastructure, which becomes a differentiator for reusable sharps containers through cleaning, decontamination, and asset management aligned with ISO 23907-2.
Vertically integrated waste-management providers and reusable-service specialists compete by bundling containers with pickup, documentation, and processing, rather than selling containers as standalone consumables. Care decentralization is also changing flow and fulfillment, with home-use sharps and specialty-pharmacy therapies increasing demand for smaller-format containers and compliant take-back options such as mail-back and consumer drop solutions. That shift adds consumer-facing ordering and reverse logistics partners, and it raises the value of traceability tools, including labels, barcodes/RFID, and digital documentation, to reduce misclassification and improve chain-of-custody controls across mixed institutional and residential waste streams.
Competitive Landscape
The sharps containers market is moderately consolidated. Waste Management’s USD 7.2 billion purchase of Stericycle formed a vertically integrated leader with national hauling, treatment, and mail-back services, unlocking over USD 125 million annual synergies. Daniels Health remains the reference brand for engineered reusable systems, operating automated washlines across five continents. BD supports containers through its Medication Delivery franchise and invests USD 2.5 billion in U.S. device capacity to secure syringe supply, indirectly boosting disposal volumes[3]BD Increases Domestic Production to Support U.S. Health Care Need for Syringes,” news.bd.com.
Disruptors such as Sharps Technology target prefillable syringe niches and home-care mail-back kits. Regional service specialists bundle container leasing with route-based pickup to protect share against the WM-Stericycle behemoth. Competitive success now hinges on proof-of-injury reduction, Scope 3 emission reporting, and digital traceability integration rather than on container commoditization.
Sharps Containers Industry Leaders
Stericycle
Sharps Compliance, Inc.
Becton, Dickinson & Co.
Daniels Health
Cardinal Health
- *Disclaimer: Major Players sorted in no particular order
Sharps Containers Market Companies Covered in this Report
- Stericycle
- Sharps Compliance
- Beckton Dickinson
- Daniels Health
- Cardinal Health
- Medtronic
- Veolia Environmental Services
- MAUSER Packaging Solutions
- Bemis Manufacturing Company
- MarketLab
- GPC Medical Ltd.
- Medu-Scientific
- Henry Schein
- EnviroTain LLC
- Thermo Fisher Scientific
- Terumo Corp.
- Smiths Group
- McKesson Corp.

Market Opportunities and Future Outlook
A major whitespace area is the consumer and home-care disposal ecosystem, where injectable therapy volumes continue to rise but many markets still rely on fragmented take-back pathways. One in-scope proof point is TriHaz Solutions launching a direct-to-consumer sharps disposal platform in May 2026 to serve demand tied to GLP-1 medication users, which signals a shift in go-to-market models from purely institutional sales to a combination of B2B and consumer logistics. Suppliers that pair compliant containers with convenient return options, such as mail-back kits, prepaid logistics, pharmacy collection, or local drop networks, can capture recurring demand and limit leakage of sharps into municipal waste streams.
A second opportunity is differentiation through lifecycle compliance and measurable sustainability outcomes, where reusable programs, verified CO2-equivalent reductions, and injury-reduction evidence increasingly affect tenders and health system ESG scoring. Digitalization adds another practical layer: connected fill-level monitoring and electronic documentation tools help support demand-based collection intervals and auditable records, creating room for offerings that integrate containers, service scheduling, and reporting dashboards. On the supply side, localized manufacturing upgrades, such as Sharps Technology scaling SoloGard-related production technology at its Hungary facility (March 2025 update), illustrate how capacity and quality systems influence hospital and home-care channel requirements.
Recent Industry Developments in Sharps Containers Market
- May 2026: TriHaz Solutions launched a direct-to-consumer sharps disposal platform aimed at home users, including those associated with rising GLP-1 medication use. The move expands the addressable demand beyond institutional purchasing and adds consumer logistics and take-back as a competitive battleground alongside container hardware.
- November 2025: BD completed its acquisition of Edwards Lifesciences Critical Care product group, expanding its smart connected care footprint. A larger installed base of monitoring and infusion-related workflows supports downstream sharps generation and strengthens BD’s ability to bundle device ecosystems with safety and disposal-aligned consumables.
- November 2024: WM completed its USD 7.2 billion acquisition of Stericycle and integrated the business under a dedicated healthcare solutions platform. The transaction raised scale thresholds in regulated medical waste services and strengthened integrated offerings that combine sharps containers, collection, and treatment infrastructure.


Sharps Containers Market Report Scope and Research Methodology
Market Definition and Coverage
The sharps containers market covers revenue earned from rigid, puncture-resistant containers used to collect and dispose of needles and other sharp medical items in healthcare and at-home care settings. We size this market in value terms across major regions, using a consistent USD conversion approach.
Scope exclusions: We exclude downstream medical waste collection, transport, treatment, and disposal services, and we also exclude general-purpose waste bins that are not designed and labeled for sharps.
Segments Covered in This Report
- By Usage
- Single-Use Containers
- Reusable Containers
- By Type
- Patient-Room Containers
- Phlebotomy Containers
- Multipurpose Containers
- By Container Size
- 1-2 Gallons
- 2-4 Gallons
- 4-8 Gallons
- By Distribution Channel
- Direct Sale
- Online Sale
- Retail Sale
- Geography
- North America
- United States
- Canada
- Mexico
- Europe
- Germany
- United Kingdom
- France
- Italy
- Spain
- Rest of Europe
- Asia-Pacific
- China
- Japan
- India
- Australia
- South Korea
- Rest of Asia-Pacific
- Rest of the World
- North America
Data Sources, Market Sizing, and Validation
Desk Research
Desk work started with a clear understanding of where sharps waste is generated and how disposal rules shape container usage. We referred to public and official sources such as the US CDC guidance on sharps safety, OSHA bloodborne pathogens requirements, WHO materials on safe injection and healthcare waste, and EPA resources linked to medical waste handling, which help frame use cases and compliance needs.
To translate demand signals into market inputs, we also used supporting references like national health statistics releases, immunization and injection-related program data, and public procurement portals that show buying patterns for consumables. Company annual reports, investor presentations, and trusted news were used to sanity-check product mix shifts like reusable systems and specialty container formats. Where needed, paid subscriptions for company financials, news and financial intelligence, and patent databases were used to fill gaps around corporate revenue exposure and product pipeline activity. The desk sources mentioned here are illustrative only, and many other references were used for cross-checking, validation, and clarification during the work.
Primary Interviews and Surveys
Primary discussions were used to pressure-test volumes, pricing behavior, and replacement cycles across hospitals, clinics, labs, and home healthcare channels, and then to confirm how purchasing differs for direct sales versus retail and online routes. We also spoke with a mix of manufacturers, distributors, and waste-handling stakeholders to validate common container sizes, typical order frequencies, and the impact of safety and sustainability requirements across the Americas, EMEA, and APAC.
Distribution of primary research fieldwork respondents
| Company type | Respondent position | Region |
|---|---|---|
| Top tier: 36% | CXOs: 16% | APAC: 45% |
| Mid tier: 48% | Functional/Unit leaders: 40% | EMEA: 32% |
| Smaller Players: 16% | Managers: 44% | Americas: 23% |
Market-Sizing & Forecasting
Sizing was built using a top-down and bottom-up approach, where healthcare activity indicators were first translated into an addressable sharps-disposal need pool, which was then converted into container demand by applying usage and replacement assumptions. For example, injections and blood draw activity, the share of care delivered in hospitals versus home settings, and compliance intensity in regulated facilities were used to reconstruct likely container consumption.
Those totals were then corroborated using selective bottom-up checks, such as sampling common average selling prices by container size bands, validating the split between single-use and reusable systems, and rolling up approximate supplier and channel shares where they could be reasonably supported. Inputs that mattered most included typical container capacity choices (such as small versus 4-8 gallon formats), frequency of container change-out tied to fill levels and policy, pricing progression by material and locking features, and the shift in distribution toward online and retail for at-home users. When country-level data was thin, we bridged gaps by using proxy indicators like relative procedure volumes, facility counts, and import-export signals for plastics and medical consumables, and then corrected the output through interview feedback.
For forecasting, scenario analysis was used so growth could be adjusted based on changes in home-injection adoption, infection-prevention policy tightening, and sustainability-driven moves toward reusable systems. The scenario paths were reviewed with primary respondents, and the final forecast was selected to reflect the most likely adoption and pricing pattern over the period.
Data Validation & Update Cycle
Validation was done by checking whether the modeled market values aligned with independent signals, such as healthcare procedure intensity, sharps waste generation context, and the expected purchasing cadence of facilities. Outliers were investigated by re-checking assumptions like container size mix, channel margins, and currency conversion timing, and then adjusted only when the change could be explained with a clear input shift.
Before sign-off, the model and narrative go through multi-step analyst reviews so arithmetic, logic, and scope treatment remain consistent across regions and segments. When a large variance appears between desk inputs and interview feedback, we re-contact relevant respondents and re-run the sensitive parts of the model to confirm what moved. Reports are refreshed annually, and interim updates are made when material events occur, followed by a final pre-delivery review so clients receive the latest updated view.
Mordor Intelligence's Sharps Containers Market Size Compared Against Other Published Estimates
Published market sizes for sharps containers often differ because each publisher makes its own choices on what to count, which year to anchor, and how prices are carried forward. We see the biggest swings when adjacent medical waste container categories are grouped together, or when home-care channels are assumed to grow faster than facility purchasing behavior.
Key gap drivers usually come down to scope and the pricing logic used in the model. Some estimates blend sharps containers with broader medical waste containers, which inflates totals, while others keep only regulated sharps containers but apply aggressive ASP increases without checking tender and distributor feedback. The main spread is also influenced by how reusable systems are treated, since counting the device and service portion together can lift the value, which is handled as product-only revenue in this study, a choice applied by Mordor Intelligence.
Benchmark comparison
| Source | Market Size | Gaps in Research Methodology |
|---|---|---|
| Mordor Intelligence | USD 65.57 M (2025) | |
| Industry Association A | USD 74.10 M (2025) | Often bundles sharps containers with a wider set of medical waste container types and accessories, and uses a broader procurement universe that can double-count facility and waste-service pass-through purchases. |
| Global Consultancy B | USD 58.30 M (2025) | Typically applies conservative adoption for home healthcare and reusable systems, and may assume slower price movement by holding container size mix constant even when policy and usage are shifting. |
Looking across the three figures, most of the difference is explained by whether adjacent waste-container products are included and whether reusable models are valued as products only or as combined solutions. Our approach keeps the market traceable to practical demand signals like procedure intensity, container replacement cadence, and channel mix, and then uses interviews to correct assumptions that do not match real purchasing patterns.


Key Questions Answered in the Report
What is the current value of the global sharps containers market in 2026?
The market stands at USD 68.79 million in 2026.
Why are reusable sharps containers gaining share so quickly?
Reusable systems cut carbon emissions by up to 90% and reduce needlestick injuries by about 87%, giving hospitals both ESG and safety payoffs that offset processing costs.
Which region will post the fastest revenue growth?
Asia-Pacific is projected to expand at 5.44% CAGR, powered by hospital infrastructure investment and rising injectable therapy volumes in China and India.
How is digital procurement affecting distribution channels?
Online platforms are forecast to grow at 7.11% CAGR as health systems automate reorder workflows and integrate compliance documentation, eroding purely direct-sales reliance.
What impact did Waste Management’s acquisition of Stericycle create?
The USD 7.2 billion deal formed a single entity handling more than half of North American regulated medical waste, raising competitive scale thresholds for smaller service providers.
Are container size preferences changing?
Yes. High-acuity departments are rotating to 4-8 gallon bins for labor efficiency, while home-care and ambulatory centers still favor 1-2 gallon formats for space optimization.
Page last updated on:


 Your data is secure and never sold or shared.


