
Servo Motors And Drives Market Size and Share
Market Overview
| Study Period | 2020 - 2031 |
|---|---|
| Market Size (2026) | USD 17.34 Billion |
| Market Size (2031) | USD 23.14 Billion |
| Growth Rate (2026 - 2031) | 5.94% CAGR |
| Fastest Growing Market | South America |
| Largest Market | Asia Pacific |
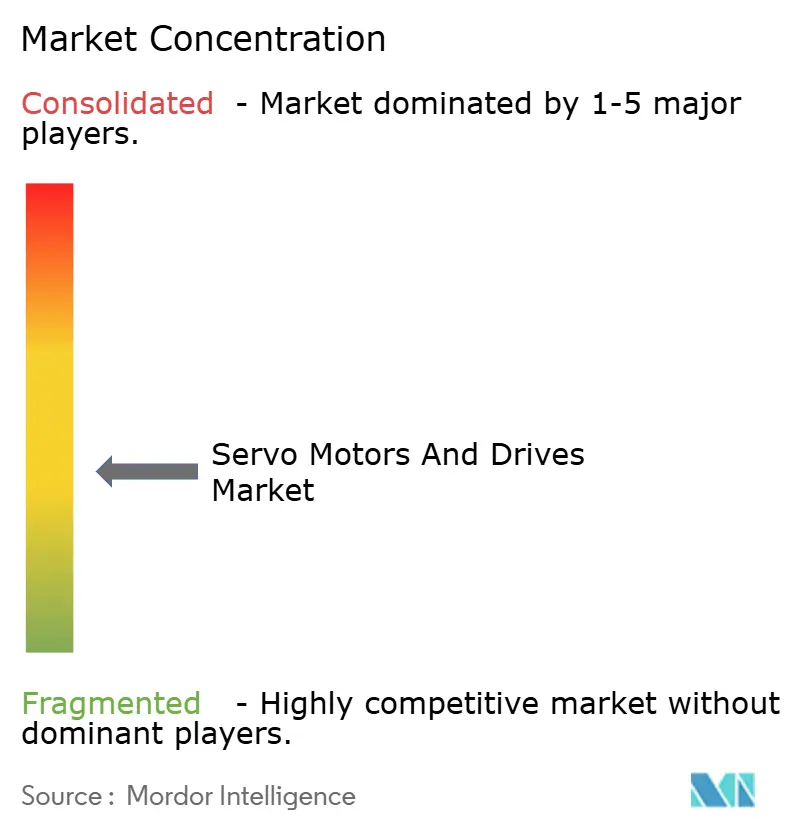
| Market Concentration | Medium |
Major Players *Disclaimer: Major Players sorted in no particular order Image © Mordor Intelligence. Reuse requires attribution under CC BY 4.0. | |
Servo Motors And Drives Market Analysis by Mordor Intelligence
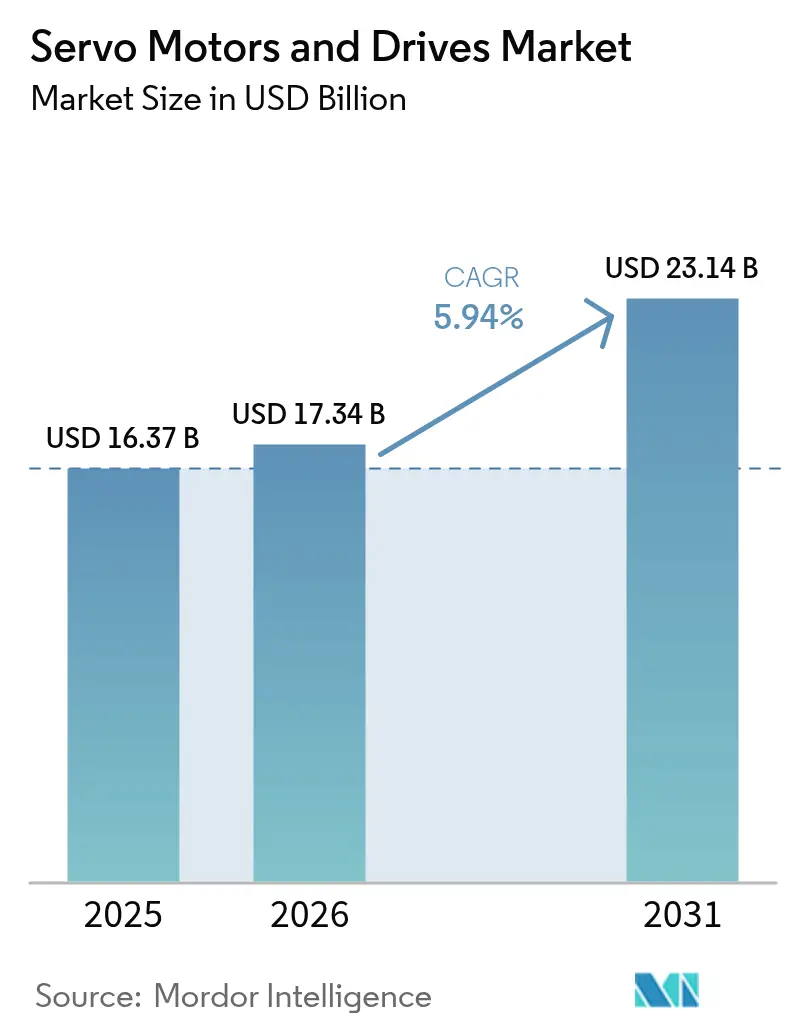
The servo motors and drives market size is projected to be USD 16.37 billion in 2025, USD 17.34 billion in 2026, and reach USD 23.14 billion by 2031, growing at a CAGR of 5.94% from 2026 to 2031. This growth reflects a shift in manufacturing economics, where precision motion control is no longer a premium feature but a baseline requirement for competitive production. The widespread rollout of silicon-carbide power electronics and edge-deployed artificial intelligence is trimming the total cost of ownership, making servo systems attractive even in price-sensitive segments. Integrated motor-drive units are reducing cabinet footprints and simplifying wiring, while medium-voltage variants are extending servo technology into heavy-industry presses and extruders. Vendors are embedding cloud-connected diagnostics and predictive-maintenance algorithms to create recurring revenue streams and lock customers into proprietary ecosystems.
Key Report Takeaways
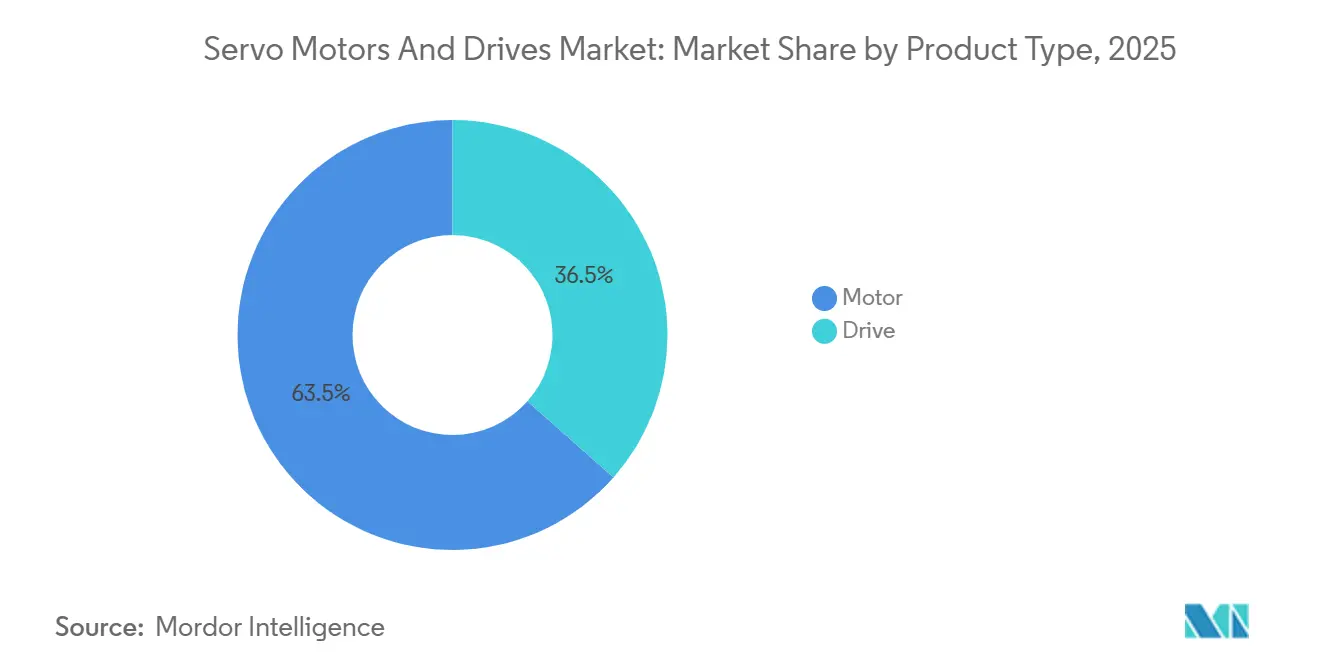
- By product type, motors led with 63.47% revenue share in 2025 and are projected to expand at a 6.37% CAGR through 2031.
- By voltage range, low-voltage systems captured 72.38% of the servo motors and drives market share in 2025, while medium-voltage systems are advancing at a 6.54% CAGR over the forecast period.
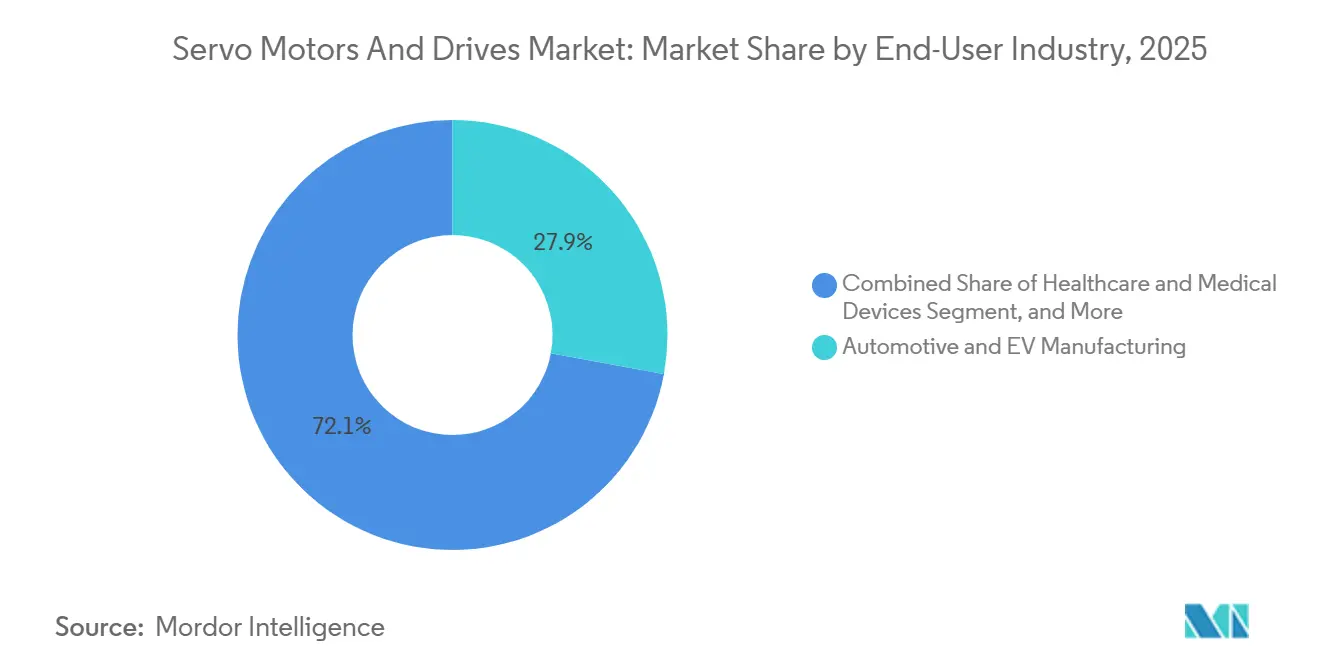
- By end-user industry, automotive and electric-vehicle manufacturing accounted for 27.91% of revenue in 2025, whereas healthcare and medical devices are rising at a 7.51% CAGR between 2026 and 2031.
- By power rating, sub-1 kW motors held 44.58% of the servo motors and drives market share in 2025, while units above 15 kW are forecast to post the highest 6.77% CAGR to 2031.
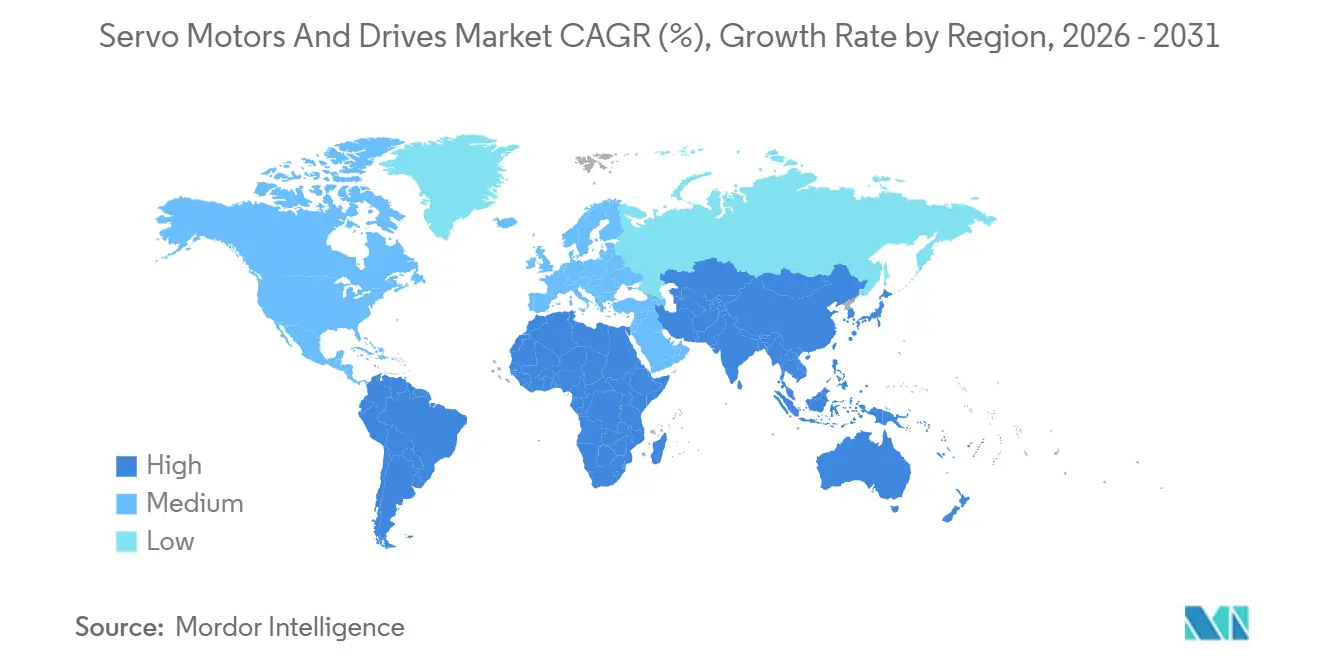
- By geography, Asia-Pacific commanded 39.73% of global revenue in 2025, and South America is expected to register the fastest 6.91% CAGR through 2031.
Note: Market size and forecast figures in this report are generated using Mordor Intelligence’s proprietary estimation framework, updated with the latest available data and insights as of 2026.
Global Servo Motors And Drives Market Trends and Insights
Drivers Impact Analysis*
| Driver | (~) % Impact on CAGR Forecast | Geographic Relevance | Impact Timeline |
|---|---|---|---|
| Rapid Industrial Automation and Smart-Factory Rollout | +1.2% | Global, with highest intensity in Asia-Pacific and Europe | Medium term (2-4 years) |
| Rising Adoption of Collaborative and Mobile Robotics | +0.9% | North America and Europe core, expanding to Asia-Pacific | Short term (≤ 2 years) |
| Stringent Global and Regional Energy-Efficiency Mandates | +0.8% | Europe and North America leading, Asia-Pacific following | Long term (≥ 4 years) |
| Transition to Silicon-Carbide Power Modules in Servo Drives | +0.7% | Global, with early adoption in automotive and semiconductor sectors | Medium term (2-4 years) |
| Digital-Twin-Enabled Predictive Sizing of Servo Systems | +0.5% | North America and Europe, pilot deployments in Asia-Pacific | Medium term (2-4 years) |
| Growth of Micro-Fulfilment Centres Requiring Compact Servo Actuation | +0.6% | North America and Europe e-commerce hubs, expanding to urban Asia-Pacific | Short term (≤ 2 years) |
| Source: Mordor Intelligence | |||
Rapid Industrial Automation and Smart-Factory Rollout
Manufacturers are accelerating the adoption of lights-out production models, elevating servos from optional upgrades to mandatory infrastructure. Deloitte found that 68% of producers intend to deploy autonomous material-handling within two years. Electronics assembly lines now reconfigure quarterly, and servo systems enable sub-millimeter repeatability that fixed automation cannot match. Automotive and consumer-electronics plants boosted servo content per line by 23% in 2026, replacing pneumatic actuators to handle the proliferation of variants. Global robot installations hit 553,000 units in 2025, adding more than 3.3 million new servo motors annually.[1]International Federation of Robotics, “World Robotics 2025 – Industrial Robots,” ifr.org Targeted subsidies worth CNY 15 billion (USD 2.1 billion) in China accelerated upgrades that integrate servo drives with industrial IoT, opening Tier-2 and Tier-3 markets.
Rising Adoption of Collaborative and Mobile Robotics
Collaborative robots and autonomous mobile robots are spreading beyond large factories into small and medium enterprises, each unit containing 6-8 frameless servo motors for compliant motion. Global shipments of mobile robots reached 140,000 units in 2025, and ABB reported a 41% revenue jump in its mobile-robot division driven by fleets of 50-100 vehicles per site. Boston Dynamics’ Stretch, adopted by major logistics firms, carries 11 servo axes, highlighting the rising servo count per robot. The combination of locomotion and manipulation intensifies demand, sustaining double-digit logistics growth through 2028.
Stringent Global and Regional Energy-Efficiency Mandates
Regulators are pushing motors toward IE4 and IE5 efficiency classes. The European Union mandates IE3 minimums today and IE4 by 2027, forcing retrofits that favor servo architectures.[2]European Commission, “Regulation 2019/1781 on Ecodesign Requirements,” eur-lex.europa.eu The U.S. Department of Energy estimates that replacing 30% of installed motors with IE4 or higher could save 52 terawatt-hours annually, and identifies servo drives as the preferred path for applications requiring dynamic speed control. China updated GB 18613-2020 to align with IE4 thresholds, accelerating servo adoption in textiles and packaging. Schneider Electric documented average energy savings of 27% when customers switched from legacy inverters to servo drives.
Transition to Silicon-Carbide Power Modules in Servo Drives
Silicon-carbide semiconductors raise drive efficiency above 98%, shrink footprints by up to 40%, and enable junction temperatures of 175 °C. Wolfspeed stated that servo applications are its fastest-growing industrial segment. Mitsubishi Electric’s MELSERVO-J5 line uses all-SiC stages to deliver fanless, cleanroom-ready drives. IEEE studies show that SiC drives cut harmonic distortion by 15-20%, allowing plants to add more axes without grid upgrades. Payback often falls below 18 months in high-duty-cycle presses, making SiC an increasingly mainstream choice.
Restraints Impact Analysis*
| Restraint | (~) % Impact on CAGR Forecast | Geographic Relevance | Impact Timeline |
|---|---|---|---|
| High Upfront Cost versus Induction or Stepper Alternatives | -0.5% | Global, most acute in price-sensitive emerging markets | Short term (≤ 2 years) |
| Supply-Chain Risk for High-Grade Rare-Earth Permanent Magnets | -0.4% | Global, with highest exposure in North America and Europe | Medium term (2-4 years) |
| Cyber-Vulnerabilities in Networked Servo Drives Causing Downtime | -0.3% | North America and Europe, expanding to Asia-Pacific | Short term (≤ 2 years) |
| Rising Share of Integrated Servo-Stepper Hybrids Cannibalising Entry-Level Servo Systems | -0.3% | Global, concentrated in packaging and textile applications | Medium term (2-4 years) |
| Source: Mordor Intelligence | |||
High Upfront Cost versus Induction or Stepper Alternatives
A 5 kW servo package averages USD 2,800, versus USD 950 for an induction motor with a VFD and USD 600 for a stepper, yielding 3-5 year payback horizons for moderate-duty tasks.[3]U.S. Department of Energy, “Cost Analysis of Servo Motor Systems,” energy.gov Emerging-market SMEs frequently choose steppers to conserve capital, especially when low-cost labor offsets the benefits of automation. Lifecycle advantages are not always visible to procurement teams, so decisions tend to skew toward the lowest upfront price. Vendors now offer performance-based contracts, but penetration remained below 15% in 2025.
Supply-Chain Risk for High-Grade Rare-Earth Permanent Magnets
China controlled about 70% of rare-earth mining and over 90% of processing in 2025, and an August 2025 quota sent neodymium prices up 35%. European manufacturers saw magnet lead times double, eroding margins. Substitution with ferrite magnets reduces torque density by 20-30%, which is unacceptable in precision axes. Recycling covered less than 3% of demand, while new processing plants funded in Australia and Canada will not reach scale before 2028.
*Our forecasts treat driver/restraint impacts as directional, not additive. The impact forecasts reflect baseline growth, mix effects, and variable interactions.
Segment Analysis
By Product Type: Integration Drives Motor Upswing
Motors generated USD 10.39 billion of the servo motors and drives market in 2025, translating into a 63.47% market share, which is projected to widen at a 6.37% CAGR through 2031. AC rotary models dominate because their high torque-to-inertia ratios suit multi-axis CNC machines and articulated robots that demand millisecond response times. Brushless DC variants, though smaller in volume, are gaining traction in surgical robots and aerospace mechanisms where low outgassing and extreme-temperature performance are critical. Linear motors occupy less than 5% of revenue yet post double-digit growth in semiconductor lithography owing to their sub-micron accuracy and elimination of mechanical backlash.
Drives contributed USD 5.98 billion in 2025 and are evolving into intelligent motion hubs that embed safety, analytics, and multi-axis coordination. AC servo drives form the backbone of this shift, while adjustable multi-axis platforms are the fastest risers as machine builders condense up to 64 axes into one rack. Adoption of integrated motor-drive actuators climbed to 18% of new installations, cutting cabinet space and simplifying compliance with IEC 61800-5-2 functional-safety rules. Vendors now bundle cloud-connected diagnostics that unlock subscription revenue, making software, not hardware, the new frontier for differentiation.


By Voltage Range: Low Voltage Commands, Medium Voltage Accelerates
Low-voltage systems below 1,000 V controlled 72.38% of revenue in 2025, driven by standardized 400 V and 480 V industrial grids and well-established safety norms that shorten certification cycles. These platforms dominate robotics, packaging, and mobile automation, where compact form factors and lower shock risk outweigh raw power. Battery-powered collaborative robots and automated guided vehicles universally use low-voltage servos, helping sustain high unit volumes even as average selling prices erode. Retrofits in mature factories also favor sub-600 V solutions because they drop into existing panel layouts without costly switchgear upgrades.
Medium-voltage products ranging from 1,000 V to 10,000 V are expanding at a 6.54% CAGR, the quickest rate among voltage classes, as metals processing, mining, and oil and gas replace DC and hydraulic drives with precision AC servos. New steel strip mills, for instance, deploy megawatt-class servo stands that boost yield and slash downtime, justifying their premium. Active front-end rectifiers and common DC-bus architectures now let plants combine medium-voltage mains with low-voltage motors, optimizing both footprint and efficiency. High-voltage offerings above 10 kV remain a specialized niche serving particle accelerators and aerospace dynos, but incremental gains in silicon-carbide insulation may unlock broader industrial use later in the decade.
By End-User Industry: Automotive Leads, Healthcare Surges
Automotive and electric-vehicle plants accounted for 27.91% of 2025 revenue, installing thousands of servo axes for battery-pack assembly, body-in-white welding, and precision adhesive dispensing. Cycle-time reductions of 20-30% and higher first-pass yields validate the investment even in capital-intensive stamping and painting operations. Servo presses with programmable stroke profiles replace conventional mechanical units, improving formability of lightweight aluminum and composite panels. EV driveline machining demands tighter tolerances than internal-combustion parts, further raising servo content per line and locking in future upgrade cycles.
Healthcare and medical devices form the fastest-growing vertical, advancing at a 7.51% CAGR through 2031 as surgical-robot shipments climb and single-use bioreactors proliferate. Servo motors enable haptic feedback and sub-degree articulation in robot arms, expanding the addressable procedure set from urology to cardiovascular interventions. Cleanroom-rated, frameless motors with antimicrobial coatings satisfy stringent regulatory standards while fitting within compact diagnostic imaging gantries. Beyond hospitals, an aging population is driving demand for automated pharmaceutical packaging that uses high-speed servo sorting and labeling to curb medication errors. This dual pull from clinical and manufacturing environments secures long-run momentum for the segment.

By Power Rating: Sub-1 kW Dominates Volume, High-Power Gains Momentum
Units rated below 1 kW represented 44.58% of shipments in 2025, buoyed by desktop CNC routers, 3-D printers, and educational robotics kits sold by Chinese vendors at sub-USD 200 price points. High unit turnover keeps overall revenue robust even as margin pressure persists. Widespread maker-movement adoption also seeds future industrial demand, as engineers trained on low-power servos migrate to factory-floor roles. The 1-5 kW category remains the revenue anchor for general automation, covering conveyors, pick-and-place arms, and smaller injection molders that drive steady replacement cycles.
The 5-15 kW class is scaling rapidly as modern servo designs pack 15 kW into frames once limited to 11 kW, allowing machine builders to downsize without sacrificing torque reserves. Above 15 kW, the segment is on track for a 6.77% CAGR thanks to servo-driven metal-forming presses, plastics extruders, and port cranes that swap hydraulics for cleaner, energy-regenerative electrics. Energy savings of 20-35% and programmable force profiles outweigh higher capex, especially where environmental regulations penalize fluid leaks. Continuous advances in cooling and silicon-carbide modules signal that the practical ceiling for commercial servos could exceed 200 kW before 2031, opening new terrain in marine propulsion and industrial ventilation.
Geography Analysis
Asia-Pacific led with 39.73% of global revenue in 2025, underscoring the region’s role as the production hub for electronics, machinery, and robotics. China alone manufactured 4.5 million servo motors in 2025, and domestic brands accounted for 55% of local demand by narrowing the gap in resolution and thermal stability. The Made in China 2025 program disbursed CNY 8 billion (USD 1.1 billion) in upgrade subsidies, prioritizing CNC machines and robots equipped with precision servo drives. Japan exported JPY 287 billion (USD 2.0 billion) in servo products, maintaining leadership in semiconductor and medical equipment that need nanometer positioning accuracy. India’s Production-Linked Incentive scheme released INR 12,500 crore (USD 1.5 billion) in 2025, funding assembly lines that added 180,000 new axes and substantially enlarged the regional servo motors and drives market.
North America held close to 24% of 2025 revenue, buoyed by USD 39 billion in semiconductor-fabrication incentives under the CHIPS and Science Act. New fabs from Intel, TSMC, and Samsung each integrate 5,000-8,000 axes for wafer handling, lithography, and metrology, driving incremental orders for high-precision servos. Rockwell Automation reported an 18% regional order spike, with automotive and food processors automating to offset skilled-labor shortages. Mexico attracted USD 35 billion in nearshoring investment during 2024-2025, equipping greenfield plants with state-of-the-art automation and lifting the country’s servo motors and drives market share within North America.
Europe captured about 22% of global revenue in 2025 and is accelerating retrofits to meet IE4 efficiency mandates effective 2027. Siemens logged 14% servo-drive growth in Germany and Italy as exporters embedded the Sinamics S210 platform in packaging and CNC machinery. The United Kingdom’s GBP 4.5 billion (USD 5.7 billion) Advanced Manufacturing Plan channels funds into aerospace composites and pharmaceutical fill-finish lines that favor high-bandwidth servos. South America, led by Brazil and Argentina, is forecast to post the fastest CAGR of 6.91% through 2031, as USD 18.2 billion in inbound investment in 2025 demands automation on par with global benchmarks. The Middle East and Africa remain below 8% share but are growing as Saudi and Emirati diversification programs specify servo-driven equipment for construction materials and pharmaceuticals.

Regulatory Landscape
Regulation of servo motors and drives is shaped by energy-efficiency and safety compliance frameworks that increasingly treat drives and motor-drive systems as regulated energy-using products. In Europe, Regulation (EU) 2019/1781 sets ecodesign requirements for electric motors and variable speed drives, and the European Commission has placed this regulation under review within its 2025-2030 Ecodesign and Energy Labelling Working Plan, keeping compliance roadmaps active for global suppliers serving EU OEMs and retrofit markets. The United Kingdom mirrors this direction through the Ecodesign for Energy-Related Products and Energy Information Regulations 2021, which embeds similar minimum-efficiency requirements into national implementation.
China continues to formalize servo-specific technical requirements alongside broader motor efficiency programs. The State Administration for Market Regulation issued GB/T 16439-2024 (general specification for AC servo systems) in August 2024, effective March 1, 2025, raising the importance of national testing and documentation alignment for servo system vendors selling into Chinese automation and machine-tool channels. At the standards layer, IEC 61800-9-2 (energy efficiency determination for power drive systems) and EN IEC 61800-9-2:2025 (published March 2025) shape how suppliers characterize drive-system losses and efficiency classes in tenders and customer qualification, while IEC 61800-5-2 remains a common anchor for functional-safety expectations in servo drives.
Value Chain Analysis
The servo motors and drives value chain starts with upstream materials and components, notably rare-earth permanent magnets, electrical steel, copper windings, bearings, and power semiconductors (increasingly SiC and GaN), plus feedback devices such as absolute encoders. These inputs flow into motor manufacturing (stator and rotor lamination, winding, magnet insertion, balancing) and drive manufacturing (power stage, control board, firmware, safety and communications stacks), followed by system integration where motors, drives, cables, and motion controllers are validated as a coordinated axis or multi-axis platform. Downstream, demand is amplified through machine builders and robotics OEMs where servo systems can be a large share of motion subsystem cost, as well as through industrial distributors and automation integrators that provide commissioning, tuning, and lifecycle service.
Midstream strategies increasingly emphasize vertical integration and platform bundling. Vendors pair servo hardware with proprietary motion software, safety, and diagnostics to reduce commissioning time and deepen installed-base lock-in. Capacity and footprint decisions also influence lead times and pricing, as reflected by Siemens announcing a EUR 180 million expansion of its Bad Neustadt motor plant in January 2026 to lift capacity by 40%. Channel delivery spans direct OEM programs (robotics, packaging, CNC, semiconductor tools) and project-driven integrator routes (retrofits and brownfield automation), while aftersales services, spares, and software subscriptions broaden the post-install revenue layer for major suppliers.
Competitive Landscape
The market shows moderate consolidation: Yaskawa Electric, Siemens, Mitsubishi Electric, ABB, and Rockwell Automation together held roughly 45% of global shipments in 2025, anchoring scale advantages in R&D and field service. These incumbents defend installed bases by bundling lifecycle contracts, remote diagnostics, and proprietary motion software that deepen customer lock-in. Chinese challengers Inovance Technology, STEP Electric, and Estun Automation dominate their domestic market and are expanding into Southeast Asia and Latin America with IEC-certified products priced 30-40% below incumbents, eroding entry-level margins. Patent data reveal intense activity in AI-assisted tuning and wireless commissioning; Yaskawa filed 47 servo-related patents in 2025 alone.
Strategic vertical integration is accelerating. Nidec bought a Vietnamese rare-earth magnet producer for USD 95 million, securing 15% of its annual magnet needs and buffering exposure to Chinese export quotas. Bosch Rexroth expanded in-house silicon-carbide fabrication to shorten design cycles for its IndraDrive Xc line, which reaches 98.3% efficiency without forced-air cooling. Siemens is spending EUR 180 million (USD 195 million) to expand Bad Neustadt's motor capacity by 40%, deploying AI inspection that reduces defect rates and lead times. Rockwell’s new Kinetix 5700 series integrates SIL 3 functional safety and synchronizes up to 100 axes at 250 µs network cycles, raising the performance bar for packaging and automotive assembly.
Software subscriptions are becoming a decisive revenue driver as hardware margins compress. Siemens disclosed that more than 30% of new European installations included paid digital service bundles that deliver predictive maintenance and cloud analytics. Vendors compete on cybersecurity credentials, rushing to certify drives to IEC 62443 to satisfy automotive and pharmaceutical buyers wary of ransomware threats. White-space opportunities lie in hydraulics replacement; Schuler noted that 60% of new metal-forming press orders now specify servo actuation, and mobile equipment OEMs are experimenting with 50-150 kW servos for excavator propulsion, signaling that the competitive perimeter is expanding beyond traditional factory automation.
Servo Motors And Drives Industry Leaders
Mitsubishi Electric Corporation
Siemens AG
Schneider Electric SE
Rockwell Automation, Inc.
ABB Ltd.
- *Disclaimer: Major Players sorted in no particular order

Market Opportunities and Future Outlook
Energy-efficiency compliance and measurement requirements create whitespace for suppliers that can quantify and optimize complete power drive system performance under IEC 61800-9-2 and EN IEC 61800-9-2:2025. This is particularly relevant as the EU continues to manage ecodesign obligations under Regulation (EU) 2019/1781 and its 2025-2030 working-plan review cycle. The result is demand for retrofit packages that combine higher-efficiency motors with modern servo drives and integrated diagnostics, along with documentation and testing services that help OEMs and end users standardize efficiency reporting across multi-axis machines.
Technology migration toward wide-bandgap power electronics is also opening product tiers focused on higher power density and smaller cabinets. In June 2026, Beckhoff introduced the AX1000 Economy Servo Drive series with EtherCAT and TwinCAT integration in 240 V and 480 V versions, reinforcing demand for system-integrated drives that simplify machine wiring and commissioning. Also in June 2026, Elmo Motion Control launched its Titanium servo drives and Titanium Maestro motion controller, highlighting GaN and SiC adoption and scaling to very high axis counts (up to 256 axes at 100 microsecond EtherCAT cycles) for complex robotics and packaging architectures. Together, these launches point to near-term opportunities in compact multi-axis platforms, integrated networking stacks, and edge-ready diagnostics that reduce downtime and engineering hours for OEMs running high-mix production lines.
Recent Industry Developments
- June 2026: Mitsubishi Electric and Semikron Danfoss announced joint development of an LV100-type standard power module package with integrated 3-level circuits for industrial drive equipment. The work targets standardized power semiconductor packaging for inverter designs, supporting higher efficiency and packaging flexibility in servo drives and adjacent industrial drive applications.
- October 2025: Siemens introduced the Sinamics S220 drive system, extending its servo drive lineup with an emphasis on higher performance, fast safety response (down to 4 ms), and development processes aligned to IEC 62443-4-1. The launch strengthens Siemens positioning in connected motion systems where cybersecurity and functional safety are procurement gates for automotive, intralogistics, and other high-uptime industries.
- July 2024: Siemens announced an agreement to acquire the industrial drive technology business of ebm-papst. The deal broadened Siemens access to compact, battery-powered drive technologies used in intralogistics and mobile robotics, expanding the addressable installed base for servo-related controls, software, and lifecycle services.


Research Methodology Framework and Report Scope
Market Definition and Coverage
This market covers revenue generated from servo motors and servo drives used to control motion in industrial and automation equipment, counted at the point of sale by manufacturers and authorized channels, across major regions.
Scope exclusions: We do not count unrelated motion components such as gearboxes, couplings, sensors, PLCs, or standalone automation software unless they are bundled and priced as part of the servo motor or drive sale.
Segmentation Overview
- By Product Type
- Motor
- AC Servo Motor
- DC Brushless Servo Motor
- Brushed DC Servo Motor
- Linear Servo Motor
- Drive
- AC Servo Drive
- DC Servo Drive
- Adjustable / Multi-Axis Servo Drive
- Motor
- By Voltage Range
- Low Voltage
- Medium Voltage
- High Voltage
- By End-User Industry
- Automotive and EV Manufacturing
- Oil and Gas
- Healthcare and Medical Devices
- Packaging and Labelling
- Semiconductor and Electronics
- Chemicals and Petrochemicals
- Food and Beverage
- Textile and Printing
- By Power Rating
- Below 1 kW
- 1 kW-5 kW
- 5 kW-15 kW
- Above 15 kW
- By Geography
- North America
- United States
- Canada
- Mexico
- South America
- Brazil
- Argentina
- Rest of South America
- Europe
- United Kingdom
- Germany
- France
- Italy
- Rest of Europe
- Asia Pacific
- China
- Japan
- India
- South Korea
- Rest of Asia Pacific
- Middle East and Africa
- Middle East
- United Arab Emirates
- Saudi Arabia
- Rest of Middle East
- Africa
- South Africa
- Egypt
- Rest of Africa
- Middle East
- North America
Data Sources, Market Sizing, and Validation
Desk Research
Desk work started with mapping the demand base for servo-controlled motion using public manufacturing and investment indicators, and then aligning it to how servo products are typically specified and purchased. We referred to sources such as the US Census Bureau manufacturing data, Eurostat industry statistics, Japan METI releases, UN Comtrade trade flows for relevant motor and drive categories, and publications from standards bodies such as IEC for efficiency and drive-related standards.
To anchor the supply side, we also used company annual reports, 10-K style filings, investor presentations, and credible industry press for capacity additions, plant footprints, and product launches. In a few places, our analysts also checked subscription databases for company financial intelligence, patent activity, and shipment-level import export signals to validate directional trends. These examples are not exhaustive, and many other public and paid sources were referenced to collect data, validate it, and clarify gaps.
Primary Interviews and Surveys
Primary inputs were gathered through interviews and structured surveys with servo motor and drive manufacturers, distributors, system integrators, and large end users that buy motion systems for factories. The discussions were used to confirm typical price bands by power rating, how multi-axis projects are costed, and which end-use industries are translating into real orders across APAC, EMEA, and the Americas.
Distribution of primary research fieldwork respondents
| Company type | Respondent position | Region |
|---|---|---|
| Top tier: 25% | CXOs: 14% | APAC: 48% |
| Mid tier: 57% | Functional/Unit leaders: 34% | EMEA: 31% |
| Smaller Players: 18% | Managers: 52% | Americas: 21% |
Market-Sizing & Forecasting
The size model is built using top-down logic where production and trade indicators, manufacturing activity, and automation investment signals are used to reconstruct the yearly demand pool for servo motors and drives by region. Once that demand pool is set, it is translated into value using a mix of penetration assumptions and typical pricing ranges that differ by power band and voltage class.
To keep the totals realistic, the outputs are corroborated with selective bottom-up approximations, such as sampling average selling prices times estimated unit volumes for common applications, cross-checking distributor channel shares, and comparing against supplier revenue exposure discussed in public filings. Key inputs used (illustrative) include factory automation and machinery output indices, robotics and CNC machine shipments, semiconductor capex cycles that influence precision motion demand, import export trends for motor and drive categories, and price movement expectations tied to materials and electronics content.
For forecasting, we mainly use scenario analysis supported by a light multivariate regression overlay, where variables like industrial production, automation spending outlook, and electronics cycle timing are adjusted based on what interviewees see in order pipelines. Where bottom-up checks have gaps, we use conservative fill rates by region and power band, and then the assumptions are re-tested with experts before finalizing the curve.
Data Validation & Update Cycle
Validation happens in layers, because a single data series can be noisy for motion control products. We compare model outputs against independent signals such as import trends, machinery output, and the implied servo content per factory automation spend, and then outliers are investigated before sign-off.
If large variances appear by region or end-use, the analyst revisits the pricing and penetration assumptions and, when needed, re-contacts primary respondents to confirm whether a shift is real or timing-related. Reports are refreshed annually, and interim updates are made when material events occur, such as sharp demand shocks in electronics, major policy changes affecting manufacturing, or step changes in component availability. Before delivery, we run a final data pass so clients receive the most current version available.
Mordor Intelligence's Servo Motors and Drives Market Estimate Compared With Other Published Estimates
Published numbers for servo motors and drives can differ even when the topic sounds identical, because each publisher sets its own time base, product boundaries, and pricing treatment, and those choices change the final total. Differences also come from how much of the value chain is counted, how regional totals are converted into USD, and whether the model leans on demand signals or company revenue roll-ups.
The table shows a clear spread in 2024 to 2026 sizing, and in Mordor Intelligence's model the value is counted for servo motors and servo drives across defined voltage and power rating bands, then validated against end-use purchase patterns instead of broad motion control bundles. Some other estimates appear to anchor earlier base years and then apply uniform CAGR ramps, or they fold in adjacent control hardware categories that inflate the starting point, which then changes the later-year math.
Benchmark comparison
| Source | Market Size | Gaps in Research Methodology |
|---|---|---|
| Mordor Intelligence | USD 17.34 B (2026) | |
| Global Consultancy A | USD 14.41 B (2024) | Uses an earlier base year and a different starting demand pool, and the scope description is broader at the component level, which can shift what is treated as a servo drive versus adjacent control electronics. |
| Industry Publisher B | USD 13.90 B (2024) | Relies more on a single base-year valuation with a long-horizon CAGR, and the price and mix progression by power rating is less transparent, which can understate later-year mix upgrades. |
Taken together, the comparison suggests that year selection, what is included around servo control hardware, and how price mix is progressed are the biggest reasons totals diverge. By tying assumptions to visible industrial indicators and checking them with market participants, the final number stays traceable to clear inputs and repeatable steps rather than a single headline CAGR.


Key Questions Answered in the Report
What is the projected value of the global servo motors and drives space by 2031?
It is forecast to reach USD 23.14 billion by 2031.
Which region is expected to register the quickest revenue growth through 2031?
South America is projected to advance at a 6.91% CAGR from 2026 to 2031.
Which voltage segment is expanding fastest over the forecast period?
Medium-voltage solutions are on track for a 6.54% CAGR through 2031.
How much 2025 revenue did motors contribute?
Motors accounted for 63.47% of total 2025 revenue.
Which end-user category shows the highest forecast growth rate?
Healthcare and medical devices are set to grow at a 7.51% CAGR between 2026 and 2031.
How concentrated is supplier competition?
The top five vendors held roughly 45% of global shipments in 2025, indicating moderate consolidation.
Page last updated on:






