
Service Integration And Management Market Size and Share
Market Overview
| Study Period | 2020 - 2031 |
|---|---|
| Market Size (2026) | USD 6.46 Billion |
| Market Size (2031) | USD 8.49 Billion |
| Growth Rate (2026 - 2031) | 5.65% CAGR |
| Fastest Growing Market | Asia Pacific |
| Largest Market | North America |
| Market Concentration | Medium |
Major Players *Disclaimer: Major Players sorted in no particular order Image © Mordor Intelligence. Reuse requires attribution under CC BY 4.0. | |
Service Integration And Management Market Analysis by Mordor Intelligence
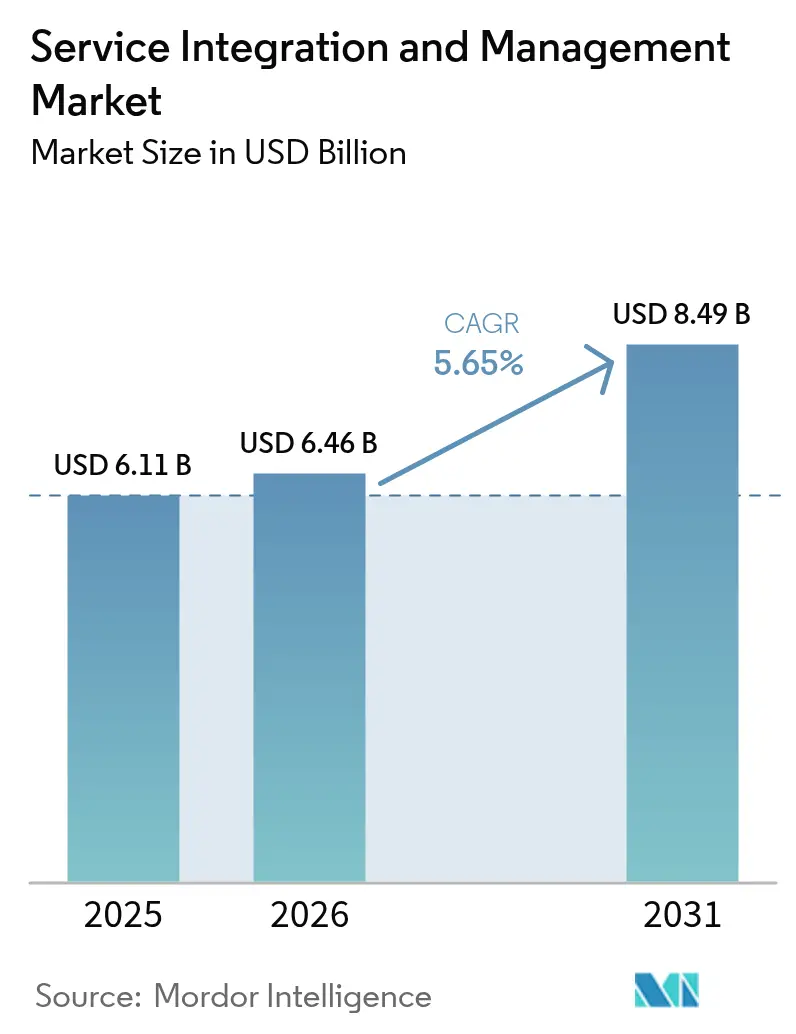
The global service integration and management market size in 2026 is estimated at USD 6.46 billion, growing from 2025 value of USD 6.11 billion with 2031 projections showing USD 8.49 billion, growing at 5.65% CAGR over 2026-2031. Growing reliance on hybrid IT estates, the average use of 2.6 public-cloud providers, and mounting regulatory scrutiny are compelling enterprises to adopt unified orchestration platforms that improve vendor coordination and SLA compliance.[1]IBM Security, “Cost of a Data Breach Report 2024,” IBM.com Escalating cloud-native application rollouts, particularly those involving containerized microservices, intensify integration touchpoints and increase demand for real-time service mapping. Enterprises also acknowledge that traditional siloed vendor oversight prolongs incident resolution and inflates governance costs, thus reinforcing the need for centralized, automation-driven SIAM frameworks that safeguard business continuity across distributed environments.
Key Report Takeaways
- By component, services retained 58.92% of 2025 revenue of the service integration and management market; however, the solutions segment is expanding at the fastest rate, with a 6.42% CAGR through 2031.
- By service model, the hybrid-provider model led with a 39.20% share of the service integration and management market in 2025, while the internal service integrator model is expected to advance at a 7.29% CAGR through 2031.
- By deployment mode, hybrid cloud accounted for 47.40% of 2025 deployments of the service integration and management market; public-cloud rollouts are accelerating at a 7.66% CAGR.
- By organization size, large enterprises captured 67.12% of the 2025 demand of the service integration and management market; SME uptake is climbing at a 6.29% CAGR as subscription-based offerings lower entry barriers.
- By end-user industry, BFSI dominated end-user adoption, with a 27.08% share of the service integration and management market in 2025. In contrast, healthcare showed the fastest growth, at an 8.07% CAGR through 2031.
- By geography, North America commanded 35.91% of the service integration and management market's 2025 revenue, but the Asia Pacific is set to grow at a 6.98% CAGR, eroding the leadership gap.
Note: Market size and forecast figures in this report are generated using Mordor Intelligence’s proprietary estimation framework, updated with the latest available data and insights as of 2026.
Global Service Integration And Management Market Trends and Insights
Drivers Impact Analysis*
| Driver | (~) % Impact on CAGR Forecast | Geographic Relevance | Impact Timeline |
|---|---|---|---|
| Rising multi-vendor IT outsourcing complexity | +1.2% | Global, concentrated in North America and Europe | Medium term (2-4 years) |
| Surge in cloud-native microservices architectures | +1.0% | Global, led by Asia Pacific and North America | Short term (≤ 2 years) |
| Growing demand for unified SLA governance platforms | +0.8% | Global, notably regulated industries | Medium term (2-4 years) |
| Acceleration of digital transformation in regulated industries | +0.7% | North America and Europe, expanding to Asia Pacific | Long term (≥ 4 years) |
| Hybrid-work operating model adoption | +0.5% | Global, early uptake in developed markets | Short term (≤ 2 years) |
| Adoption of AIOps for proactive service orchestration | +0.6% | North America and Europe, expanding to Asia Pacific | Medium term (2-4 years) |
| Source: Mordor Intelligence | |||
Rising Multi-Vendor IT Outsourcing Complexity
Enterprises typically manage 5-7 major IT providers plus multiple niche vendors, generating exponential integration touchpoints that legacy vendor management cannot control effectively. IBM’s 2024 study reveals that organizations with four or more primary providers incur 40% higher operational overhead and 60-80% longer outage resolution times, underscoring the financial risks associated with fragmented governance. SIAM platforms establish single-pane visibility, standardized KPIs, and dispute-avoidance protocols that eliminate finger-pointing, accelerate root-cause isolation, and strengthen compliance audit trails across the vendor ecosystem.
Surge in Cloud-Native Microservices Architectures
Kubernetes penetration reached 96% in 2024, yet containerized workloads spawn transient service dependencies spanning on-premises clusters and multiple public clouds.[2]Cloud Native Computing Foundation, “CNCF Annual Survey 2024,” CNCF.io Conventional ITSM catalogs become obsolete in this fluid landscape. Modern SIAM solutions embed real-time service discovery, automated dependency mapping, and policy-driven orchestration that dynamically recalibrates performance baselines as microservices scale, ensuring a consistent user experience despite frequent infrastructure changes.
Growing Demand for Unified SLA Governance Platforms
Enterprises increasingly insist on granular, end-to-end performance guarantees, but disparate vendor SLAs impede accountability. Advanced SIAM suites ingest telemetry across provider boundaries, correlate events, and auto-generate compliance dashboards that satisfy auditors in regulated verticals such as banking and healthcare. Unified governance mitigates cascading penalty clauses triggered by SLA breaches, enhancing executive confidence in multi-sourced operating models.
Acceleration of Digital Transformation in Regulated Industries
BFSI and healthcare must modernize legacy estates while respecting PCI DSS, SOX, HIPAA, and emerging digital banking mandates. SIAM frameworks overlay ITIL and ISO 20000 foundations with vertical-specific compliance controls, ensuring seamless data governance as workloads traverse hybrid clouds.[3]International Organization for Standardization, “ISO/IEC 20000-1:2018,” ISO.org Continuous monitoring, automated remediation, and immutable audit logs make SIAM essential for sustaining transformation momentum without compromising regulatory posture.
Restraints Impact Analysis*
| Restraint | (~) % Impact on CAGR Forecast | Geographic Relevance | Impact Timeline |
|---|---|---|---|
| Shortage of SIAM-skilled professionals | -0.8% | Global, acute in Asia Pacific and emerging markets | Long term (≥ 4 years) |
| Absence of global standardized SLA frameworks | -0.6% | Global; regional compliance variations | Medium term (2-4 years) |
| Legacy toolchain interoperability challenges | -0.5% | Global, concentrated in mature IT environments | Medium term (2-4 years) |
| Perceived loss of direct vendor control | -0.3% | North America and Europe | Short term (≤ 2 years) |
| Source: Mordor Intelligence | |||
Shortage of SIAM-Skilled Professionals
The demand for SIAM talent outstrips supply by roughly 40% in North America and Europe, resulting in extended implementation cycles of 18-24 months for many programs. Effective practitioners blend deep ITSM expertise, cloud architecture fluency, and vendor-negotiation acuity capabilities rarely found in a single resource. Enterprises are establishing internal academies and sponsoring external certifications to close the gap, yet near-term capacity constraints inflate cost structures and slow time-to-value.
Absence of Global Standardized SLA Frameworks
Multinationals struggle to harmonize measurement baselines because vendor SLAs differ by region, industry, and service tier. Custom reconciliation models inflate governance overhead and obscure apples-to-apples performance comparisons. While ITIL and ISO 20000 provide templates, their scope does not address microservice latency metrics or cross-cloud workload commitments, thereby perpetuating fragmentation and limiting the effectiveness of benchmarking.
*Our forecasts treat driver/restraint impacts as directional, not additive. The impact forecasts reflect baseline growth, mix effects, and variable interactions.
Segment Analysis
By Component: Momentum Shifts Toward Automation-Centric Solutions
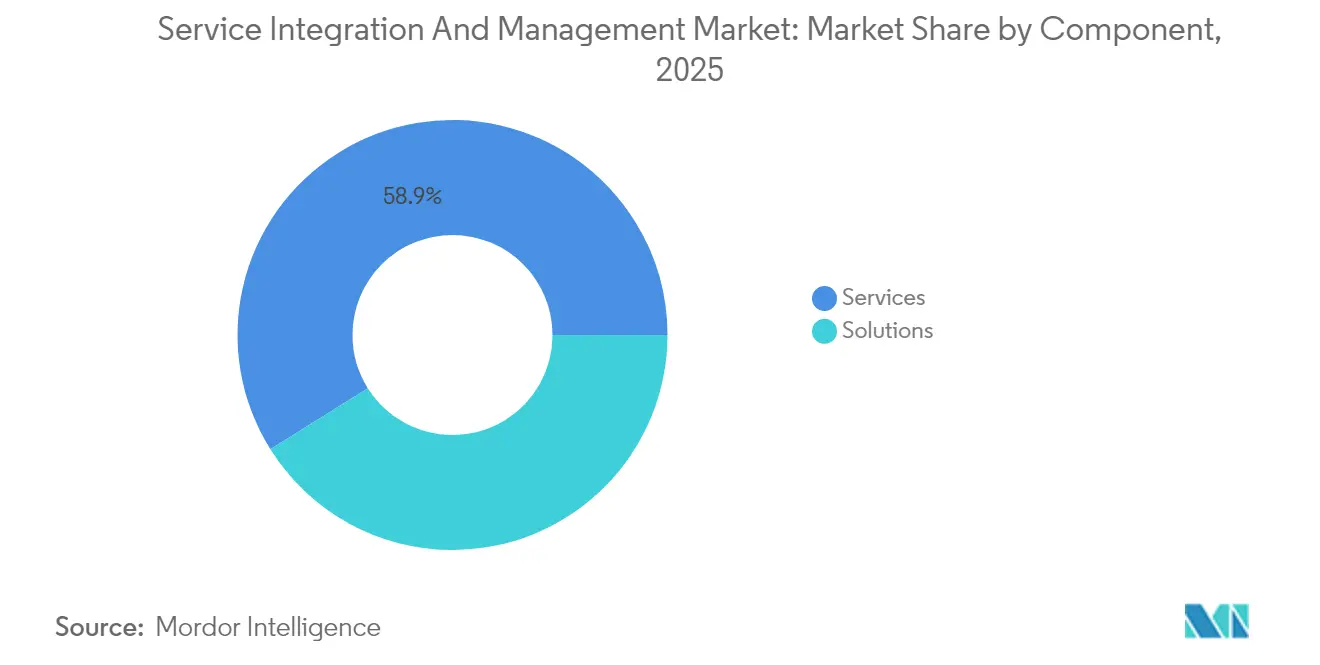
The services tranche accounted for 58.92% of 2025 revenue, thanks to consulting-heavy change-management engagements. However, platform-centric solutions are scaling faster at a 6.42% CAGR, signaling an enterprise pivot toward automation as multi-vendor ecosystems expand. The service integration and management market size for solutions is forecast to hit USD 3.64 billion by 2031, reflecting a strong appetite for pre-built governance engines that lower dependency on scarce human expertise. AI-driven orchestration modules, API-first architectures, and out-of-the-box compliance packs cut configuration time and support self-service onboarding, making technology investments more attractive than ongoing consultancy fees.
Enterprises are increasingly combining lightweight advisory engagements with subscription platforms, thereby blending knowledge transfer and repeatable automation. This hybrid spend pattern underpins sustained growth for system integrators offering solution accelerators rather than pure consulting hours.
As maturity rises, the service integration and management market share of solutions is poised to overtake services in the longer term if current adoption curves persist.


By Service Model: Internal Competence Centers Gain Ground
Hybrid-provider arrangements accounted for 39.20% of 2025 revenue, striking a balance between internal stewardship and selective outsourcing for niche skills. Yet the internal service integrator model is outpacing all peers, advancing at a 7.29% CAGR as organizations formalize in-house SIAM centers of excellence. Catalysts include increased access to certified training, declining tooling complexity, and executive recognition that service integration constitutes a strategic core competence.
External service integrator contracts still flourish where budget constraints or talent shortages prevail, particularly among mid-market firms in highly regulated sectors. Nevertheless, continuous investment in workforce upskilling and automation may tilt the mix toward internal governance over the forecast period, aligning with board-level mandates for tighter oversight of third-party risk.
By Deployment Mode: Public Cloud Closes the Gap on Hybrid Dominance
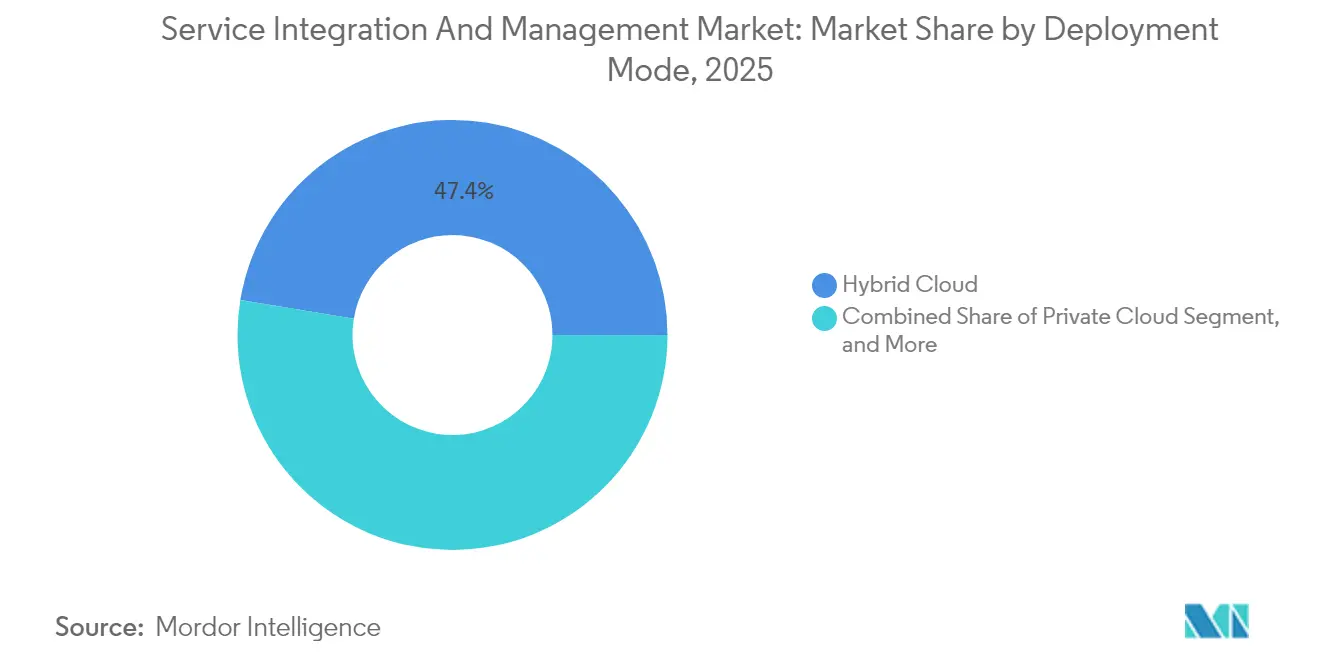
Hybrid cloud remained the deployment archetype of choice at 47.40% in 2025, allowing sensitive workloads to reside on-prem while elastic capacity bursts to the cloud. However, public-cloud SIAM subscriptions are growing at the fastest rate, with a 7.66% CAGR, supported by hardened security postures, sovereign-cloud zones, and pay-as-you-go economics. The service integration and management market size attributable to public-cloud deployments is expected to reach USD 3.25 billion in 2031, narrowing the difference with hybrid footprints.
Private-cloud and on-prem installations serve retrofit-averse incumbents in defense and critical infrastructure, yet face subdued demand amid capital-expense pressures. SaaS-based orchestration suites also offer instant updates, reducing technical debt and luring organizations that previously deferred platform refreshes due to lengthy upgrade cycles.
By Organization Size: Cloud-Native Platforms Democratize Adoption
Large enterprises accounted for 67.12% of 2025 spending, largely due to their sprawling vendor ecosystems and high compliance exposure. Nonetheless, SME adoption is accelerating at a rate of 6.29% annually, buoyed by low-touch SaaS propositions and consumption-based pricing. SMEs favor pre-configured playbooks and no-code connectors that mask underlying complexity, enabling lean IT teams to enforce unified governance without hiring SIAM veterans.
Vendor roadmaps that prioritize guided workflows, embedded AI support bots, and marketplace plug-ins further lower onboarding friction. As a result, the service integration and management industry now addresses a broader total addressable market than during its consultancy-centric origins.
By End-User Industry: Healthcare Surges While BFSI Retains Primacy
BFSI held 27.08% of 2025 revenue, as stringent operational risk mandates sustain robust demand for end-to-end visibility and audit-ready reporting. Electronic trading platforms, core-banking migrations, and fintech partnerships deepen multi-vendor reliance, elevating SIAM to a board-level imperative.
Healthcare is projected to post the highest CAGR of 8.07% through 2031, driven by the expansion of telehealth, EHR modernization, and connected medical devices that span institutional and cloud boundaries. HIPAA and emerging data-interoperability mandates push providers toward centralized orchestration to guarantee patient-safety SLAs. Manufacturing, retail, and government sectors continue to experience steady uptake as Industry 4.0, omnichannel commerce, and public-sector digitalization introduce complex vendor webs that require meticulous governance.
Geography Analysis
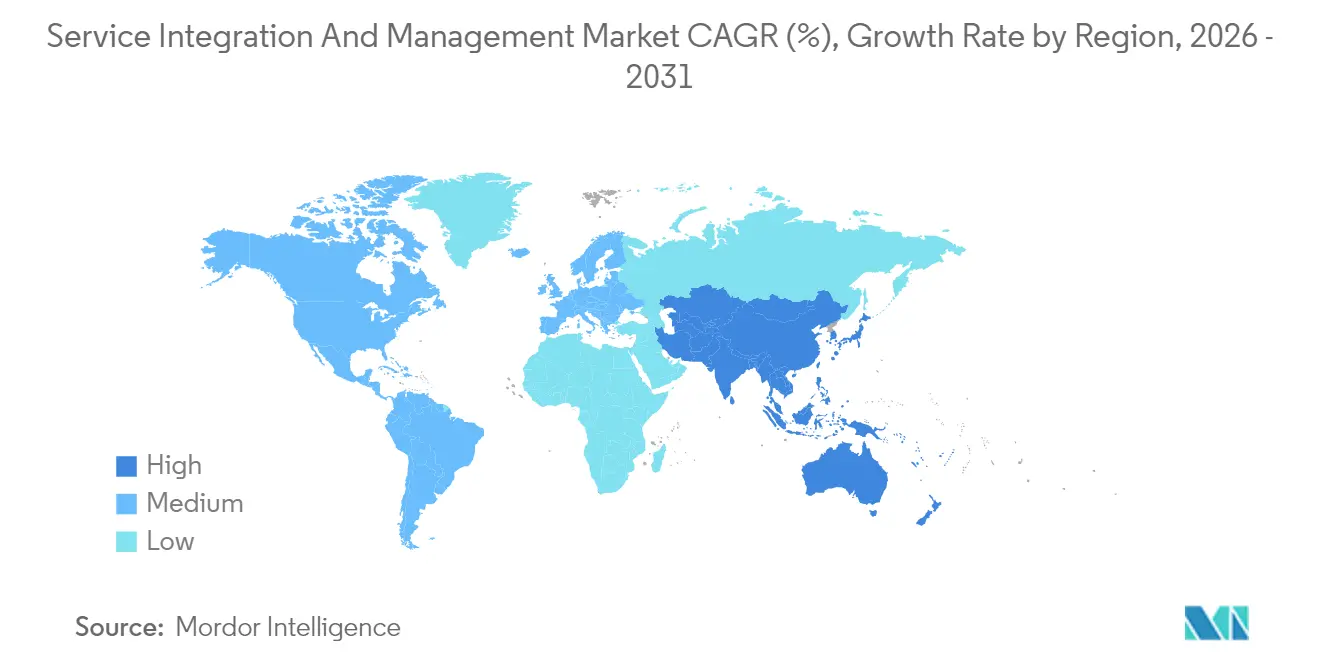
North America maintained its leadership position with a 35.91% share in 2025, driven by early-mover enterprise adoption, an abundance of SIAM talent, and stringent regulatory requirements such as SOX and HIPAA. Growth at a 5.14% CAGR indicates sustained investment as companies modernize legacy estates and integrate multi-cloud strategies. Mature consultancy ecosystems and favorable procurement budgets support sophisticated, large-scale rollouts, reinforcing the region’s status as an innovation hub.
The Asia Pacific is the fastest-growing region, with a 6.98% CAGR through 2031. National digital economy programs in India, China, and key ASEAN nations are driving multi-vendor transformation projects that overwhelm traditional ITSM processes. Foreign direct investment and hyperscaler data-center expansions further complicate service chains, catalyzing demand for SIAM. Enterprises in Japan and South Korea, already steeped in lean operations, are now layering SIAM on top of DevOps pipelines to enhance cross-provider accountability.
Europe demonstrates consistent annual growth of 5.71%, propelled by the GDPR, emerging AI regulations, and tightening third-party risk requirements. ISO 20000 certification drives baseline alignment across providers, while Brexit-driven data-flow uncertainties heighten the need for transparent governance. Germany and the United Kingdom spearhead adoption, whereas Eastern European enterprises accelerate uptake to meet EU harmonization goals. Sustainability directives are adding an environmental-performance dimension to vendor scorecards, extending SIAM KPIs beyond cost and uptime.

Regulatory Landscape
Regulatory requirements around ICT risk, third-party oversight, and service-management controls are shaping SIAM operating models, particularly for regulated industries such as BFSI and healthcare. In the European Union, the Digital Operational Resilience Act (DORA, Regulation (EU) 2022/2554) raises the bar for ICT third-party risk management by requiring financial entities to maintain a register of information covering contractual arrangements with ICT service providers. This reinforces the need for integrated vendor governance, consistent SLAs, and audit-ready service reporting across multi-provider environments.
DORA-related secondary legislation further tightens contract and monitoring expectations. Commission Delegated Regulation (EU) 2024/1773 requires specific contractual measures and KPIs to monitor confidentiality, availability, and integrity. Commission Implementing Regulation (EU) 2024/2956 (effective 17 January 2025) defines standardized templates for the register of information and broadens the scope of ICT services subject to DORA compliance. Alongside these requirements, international standards such as ISO/IEC TS 20000-14:2023 provide guidance on integrating a service integrator into a Service Management System (SMS) for multi-provider delivery, supporting more consistent control design and evidence generation across geographies.
Value Chain Analysis
The SIAM value chain begins with enabling inputs such as service-management frameworks (ITIL-aligned operating practices), international standards guidance (ISO/IEC TS 20000-14:2023 for integrator integration into an SMS), and core platform and tooling foundations that supply telemetry and workflow control (ITSM suites, observability, CMDB/service mapping, integration middleware, and AIOps/automation). Solution vendors and cloud providers contribute APIs, identity, logging, and integration primitives, which are then assembled with pre-built connectors, governance templates, and compliance packs to shorten onboarding for both internal teams and external providers.
Downstream, service integrators and managed service providers deliver consulting, operating-model design, implementation, and run services, increasingly packaged as repeatable SIAM-as-a-Service offers. Enterprises then operationalize the model through supplier onboarding, contract and SLA alignment, cross-provider incident, problem, and change workflows, and performance management that extends beyond classic SLAs into business KPIs and posture metrics, including sovereignty and ESG-related reporting in some programs. Buyers also face common bottlenecks such as fragmented tooling architectures, interface debt between providers, and inconsistent reporting that obscures root cause ownership, which is pushing demand toward tool-agnostic orchestration and automation-heavy "system of execution" approaches rather than manual, meeting-driven coordination.
Competitive Landscape
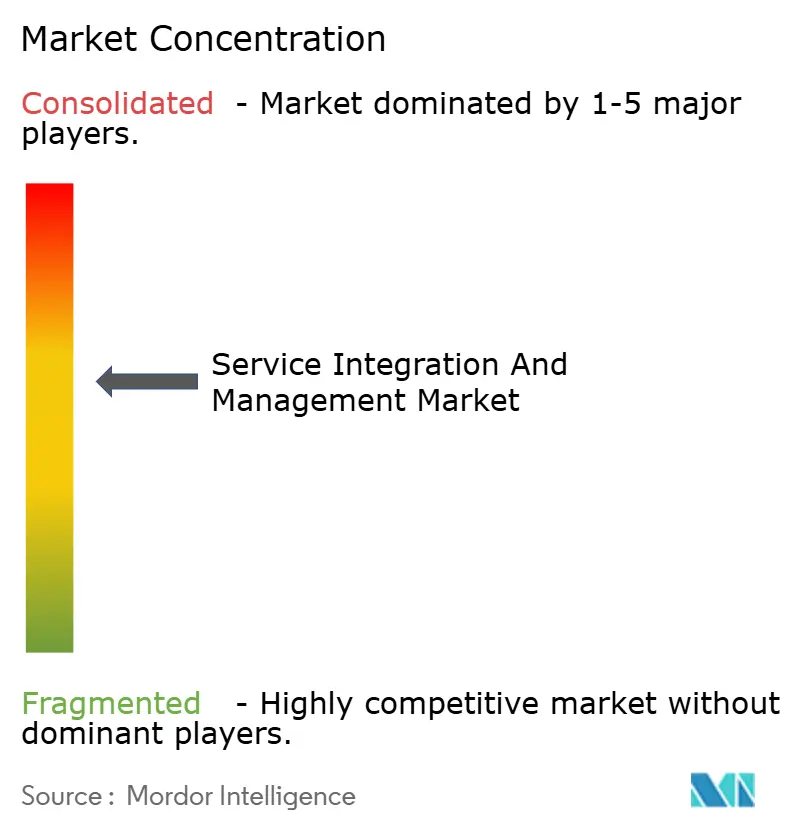
Market concentration is moderate. Consulting majors Accenture, IBM, and Tata Consultancy Services capitalize on end-to-end portfolios that blend advisory, implementation, and managed services. ServiceNow differentiates itself through platform depth, acquiring Celonis for USD 2.1 billion to embed process-mining insights and shorten value realization cycles. HCL and Wipro enhance regional coverage via targeted acquisitions and plug-and-play SIAM-as-a-Service offerings that appeal to mid-market buyers.[4]HCL Technologies, “Quarterly Results Q2 2025,” HCLTech.com
Strategic emphasis is shifting to AI-infused orchestration. IBM’s USD 500 million Watson AIOps for SIAM suite predicts disruptions 72 hours in advance, slashing MTTR and boosting customer satisfaction. Capgemini and Tech Mahindra focus on sector-specific accelerators, embedding pre-configured compliance controls tailored to banking, healthcare, and manufacturing sectors. Consulting-heavy incumbents are increasingly bundling tooling subscriptions to fend off platform-first challengers, while hyperscalers hint at integrated SIAM layers within cloud management consoles, foreshadowing the commoditization of baseline features but opening advisory niches for complex, regulated workloads.
Service Integration And Management Industry Leaders
Accenture plc
AtoS SE
Capgemini SE
Fujitsu Limited
HCL Technologies Limited
- *Disclaimer: Major Players sorted in no particular order

Market Opportunities and Future Outlook
A key whitespace is the productization of SIAM into automation-led offerings that reduce dependence on scarce SIAM-skilled professionals and compress onboarding and change cycles across multi-provider ecosystems. Enterprises also need unified orchestration spanning hybrid cloud, best-of-breed SaaS, and regulated workloads, which creates demand for platforms and providers that can normalize cross-vendor telemetry, enforce standardized KPIs, and generate audit-ready evidence for third-party risk and service performance governance.
Adoption opportunities are also emerging from SIAM's convergence with AI and automation, especially where legacy fragmentation still drives long provisioning cycles and higher operational friction. One measurable proof point is One NZs June 2026 deployment of UiPath Maestro orchestration to integrate fragmented legacy systems for enterprise mobile provisioning, cutting cycle time from 10 days to under 10 minutes and demonstrating how orchestration can translate SIAM principles into business outcomes. In parallel, updated industry guidance, including the SIAM Body of Knowledge refresh (2025) and ISO/IEC TS 20000-14:2023, broadens emphasis toward AI skills, experience management, and organizational change management, which supports more standardized program rollouts and outcome-based contract structures across sectors such as telecom, BFSI, and healthcare.
Recent Industry Developments
- June 2026: One NZ deployed UiPath Maestro orchestration to integrate fragmented legacy systems used for enterprise mobile provisioning. The initiative reduced provisioning cycle times from 10 days to under 10 minutes, illustrating how orchestration layers can convert multi-system complexity into measurable service outcomes that SIAM programs can govern and scale.
- November 2025: CGI secured a contract worth up to GBP 250 million with His Majestys Revenue and Customs (HMRC) for enterprise integration services to modernize and sustain the integration estate. The scale and public-sector criticality of the work reinforces demand for standardized integration governance, supplier coordination, and performance reporting across multi-sourced environments.
- June 2024: Fordway Solutions Limited was awarded a GBP 275,720 contract for strategic Service Integration and Management (SIAM) tool support via the UK procurement system. The award highlights ongoing government demand for SIAM tool operations and support capabilities, supporting repeatable run-models around standardized platforms in multi-supplier delivery.


Research Methodology Framework and Report Scope
Market Definition and Coverage
This market counts revenue earned from service integration and management activities that help an organization coordinate multiple internal and external IT service providers under one operating model, so service delivery is managed as one combined portfolio.
Scope exclusions: We exclude pure systems integration project work that does not include ongoing multi-provider governance and service coordination.
Segmentation Overview
- By Component
- Solutions
- Business Solutions
- Technology Solutions
- Services
- Solutions
- By Service Model
- Single-Provider Model
- Hybrid-Provider Model
- Internal Service Integrator Model
- External Service Integrator Model
- By Deployment Mode
- On-Premise
- Public Cloud
- Private Cloud
- Hybrid Cloud
- By Organization Size
- Small and Medium Enterprises
- Large Enterprises
- By End-User Industry
- Banking, Financial Services and Insurance (BFSI)
- Information Technology and Telecom
- Healthcare
- Retail
- Manufacturing
- Government and Public Sector
- Other End-User Industries
- By Geography
- North America
- United States
- Canada
- Mexico
- South America
- Brazil
- Argentina
- Rest of South America
- Europe
- Germany
- United Kingdom
- France
- Italy
- Spain
- Rest of Europe
- Asia Pacific
- China
- Japan
- India
- South Korea
- South-East Asia
- Rest of Asia Pacific
- Middle East
- Saudi Arabia
- United Arab Emirates
- Turkey
- Rest of Middle East
- Africa
- South Africa
- Nigeria
- Rest of Africa
- North America
Data Sources, Market Sizing, and Validation
Desk Research
Desk work started with clarifying what SIAM is counted as in revenue terms, and where it sits inside broader IT services spending. We used public sources to set the context for enterprise IT operations and service management adoption, which later helped us sanity check direction and growth speed.
For external signals, we reviewed non-paywalled sources such as U.S. Bureau of Labor Statistics occupational and wage series, National Institute of Standards and Technology guidance on service management and cybersecurity controls, the International Organization for Standardization pages for IT service management standards (such as ISO/IEC 20000), and public publications from IT governance bodies and professional institutes (such as ITIL community materials and ISACA resources). We also used sources like company annual reports, earnings call decks, trusted press coverage, and public contract and tender notices, and then supported revenue mapping with a paid subscription for company financials and a separate news and financials archive, plus a patent database to spot automation and orchestration themes. These are illustrative examples and many other sources were also used to collect, validate, and clarify the final dataset and assumptions.
Primary Interviews and Surveys
Primary inputs were used to pressure test what buyers actually purchase under SIAM, how contracts are structured, and how pricing changes with scope (for example, number of towers, vendors, and geographies). We spoke with service management leaders, sourcing and vendor management stakeholders, and delivery managers across APAC, EMEA, and the Americas so our assumptions reflect different maturity levels and procurement styles.
Distribution of primary research fieldwork respondents
| Company type | Respondent position | Region |
|---|---|---|
| Top tier: 32% | CXOs: 15% | APAC: 48% |
| Mid tier: 48% | Functional/Unit leaders: 42% | EMEA: 32% |
| Smaller Players: 20% | Managers: 43% | Americas: 20% |
Market-Sizing & Forecasting
Sizing is built using a top-down approach where enterprise IT services spend and IT operations outsourcing pools are reconstructed by region, and then filtered down using SIAM adoption and attach rates for multi-provider operating models. The total is then corroborated using selective bottom-up checks, where sampled contract values and typical run-rate fees are multiplied by likely adoption volume for large accounts, followed by adjustments when the two views show persistent gaps.
Key inputs used in the model include the share of enterprises running multi-vendor IT sourcing, the mix of managed services versus advisory and transition work, typical contract duration and renewal patterns, the average number of service towers under governance, and the degree of automation used in orchestration workflows (which affects delivery effort and pricing). Since public data is not available for every country, missing values are handled through regional proxies and maturity-based benchmarks that were validated with interview feedback.
For forecasting, we use scenario analysis supported by a light multivariate regression, where growth is tied to indicators like cloud and hybrid complexity, outsourcing intensity, and enterprise compliance pressure, and then refined using what respondents expect for new SIAM deals and scope expansions. We keep assumptions simple and traceable so a reader can see how each input moves the final number.
Data Validation & Update Cycle
Outputs are checked against independent signals such as reported managed services growth, large deal activity, and the observed shift toward multi-supplier governance in IT operations. When a region or end-user view shows a sharp jump that does not match these signals, it is flagged, reviewed by another analyst, and then corrected through a fresh pass of assumptions and re-checks with selected interviewees.
Reports are refreshed annually, and interim updates are done when material events change demand or pricing, such as large outsourcing policy shifts, new compliance requirements, or major macro disruptions. Before delivery, we do one more update sweep so clients receive the latest aligned view across the model, the narrative, and the comparison table.
Mordor Intelligence's Service Integration and Management Market Estimate Compared With Other Published Estimates
Published numbers for SIAM often do not match because companies do not measure the same thing, even when the market name looks identical. Differences usually come from what is counted as SIAM revenue, which years are treated as the base, and how quickly pricing is assumed to move as automation increases.
The spread in estimates is typically driven by scope choices and modeling shortcuts. Some figures fold in broader IT managed services or general systems integration, while others only count SIAM software tools and exclude service-led governance, and currency timing and refresh cadence can also shift results by year.
Benchmark comparison
| Source | Market Size | Gaps in Research Methodology |
|---|---|---|
| Mordor Intelligence | USD 6.46 B (2026) | |
| Industry Briefing A | USD 6.12 B (2024) | Uses an earlier base year and tends to treat SIAM largely as a solutions-led category, which can undercount ongoing governance-led service revenue and later-period pricing changes. |
| Global Advisory Note B | USD 13.50 B (2024) | Blends SIAM with a wider managed services bucket and multi-provider operations spend, which inflates totals when pure service coordination and governance are not separated from delivery work. |
The table shows that the largest gap comes from whether broader managed services and adjacent integration work are included, or only multi-provider governance is counted, which then changes the demand pool and the implied pricing curve, a scope decision applied by Mordor Intelligence. With clear inclusion rules and repeatable checks against deal patterns and adoption signals, we aim to keep the market total understandable and stable across refreshes.


Key Questions Answered in the Report
What is the projected value of the service integration and management market in 2031?
It is forecast to reach USD 8.49 billion, growing at a 5.65% CAGR between 2026 and 2031.
Which component segment is growing fastest?
The Solutions segment is expanding at a 6.42% CAGR as enterprises favor automation over exclusive reliance on consulting.
Why is SIAM adoption surging in healthcare?
Telehealth expansion, EHR modernization, and interoperability mandates are pushing healthcare providers toward centralized vendor orchestration, driving an 8.07% CAGR through 2031.
Which region will grow quickest through 2031?
Asia Pacific leads with a 6.98% CAGR thanks to aggressive digital-economy programs and hyperscale cloud expansion.
How are vendors differentiating in the market?
Leading providers embed AI-powered predictive orchestration, acquire process-mining assets, and release sector-specific accelerators to shorten deployment cycles and enhance compliance.
What is the primary talent-related challenge?
A global shortage of SIAM-skilled professionals—estimated at 40% undersupply—extends project timelines and elevates implementation costs.
Page last updated on:






