
Self-checkout System Market Size and Share
Market Overview
| Study Period | 2020 - 2031 |
|---|---|
| Market Size (2026) | USD 5.97 Billion |
| Market Size (2031) | USD 9.03 Billion |
| Growth Rate (2026 - 2031) | 8.63% CAGR |
| Fastest Growing Market | Asia Pacific |
| Largest Market | North America |
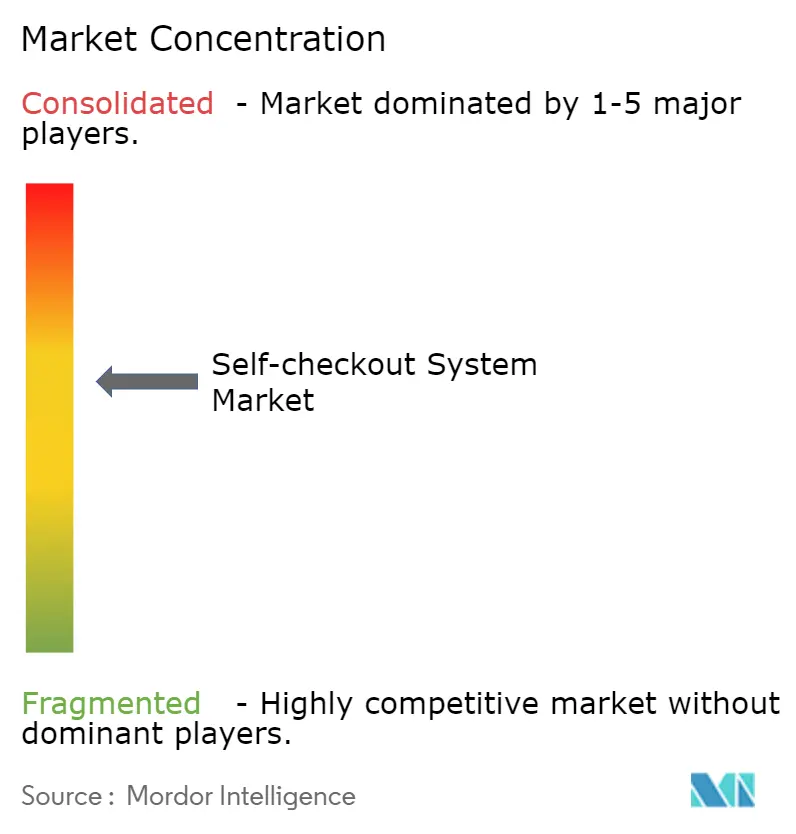
| Market Concentration | Medium |
Major Players *Disclaimer: Major Players sorted in no particular order Image © Mordor Intelligence. Reuse requires attribution under CC BY 4.0. | |
Self-checkout System Market Analysis by Mordor Intelligence
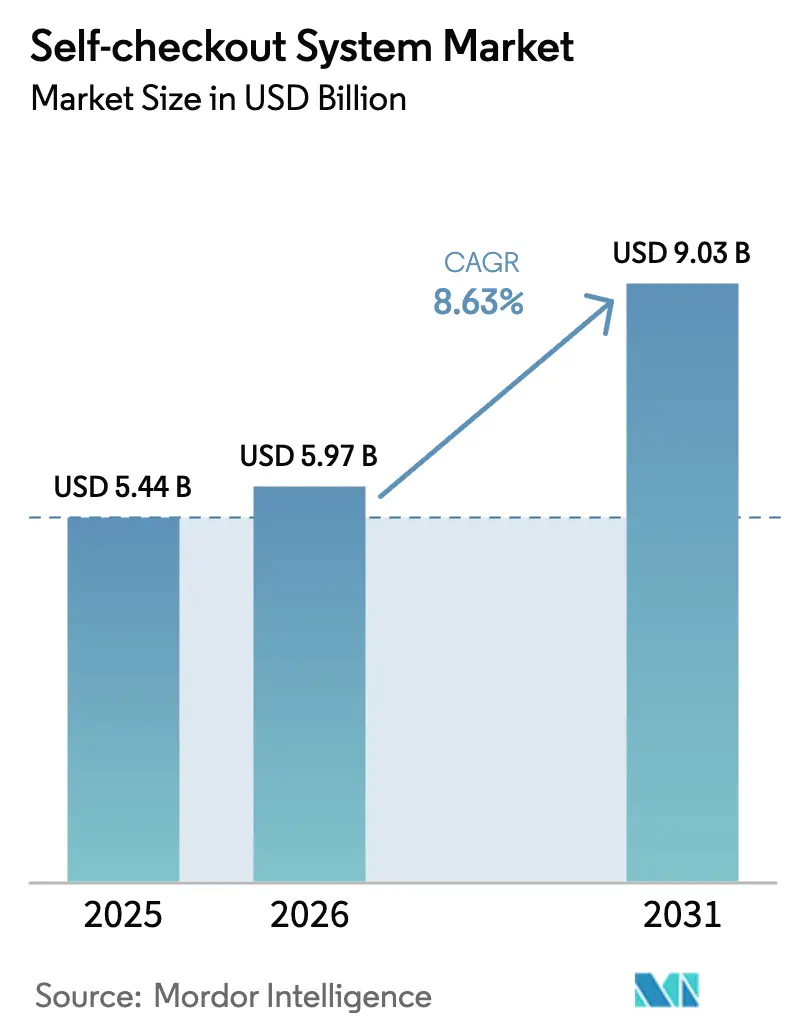
The self-checkout system market size is projected to be USD 5.44 billion in 2025, USD 5.97 billion in 2026, and reach USD 9.03 billion by 2031, growing at a CAGR of 8.63% from 2026 to 2031. These gains stem from tightening labor pools, surging digital-wallet adoption, and retailers’ need for faster front-end throughput. Hardware still anchors deployments, but margin now migrates to software, analytics, and managed services that curb fraud and integrate loyalty data. Computer-vision startups have compressed scanning time to under 10 seconds, giving retailers a path to reclaim floor space and redeploy staff. At the same time, advertising sold on kiosk screens is converting what was once a pure cost center into a blended labor-savings and media-revenue asset.
Key Report Takeaways
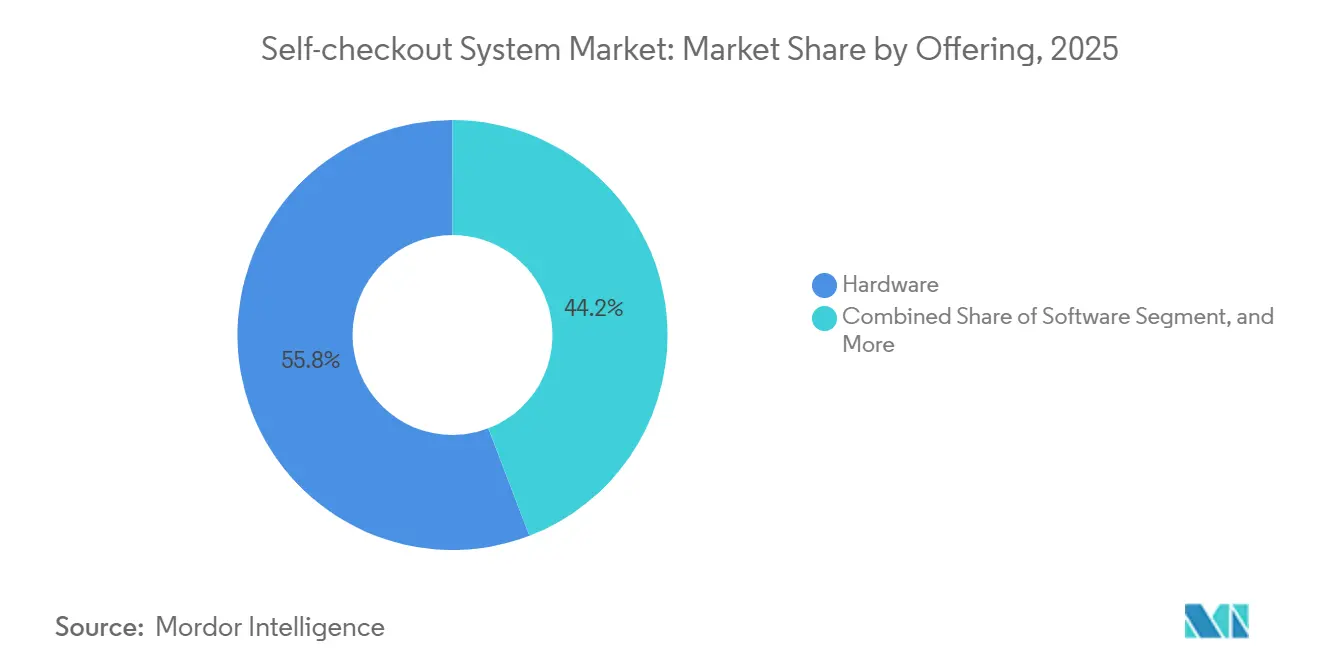
- By offering, hardware led with 55.83% of self-checkout system market share in 2025, while services are set to grow at an 11.31% CAGR through 2031.
- By transaction type, cash-based lanes held 61.79% share of the self-checkout system market size in 2025, whereas cashless lanes are projected to expand at a 12.02% CAGR.
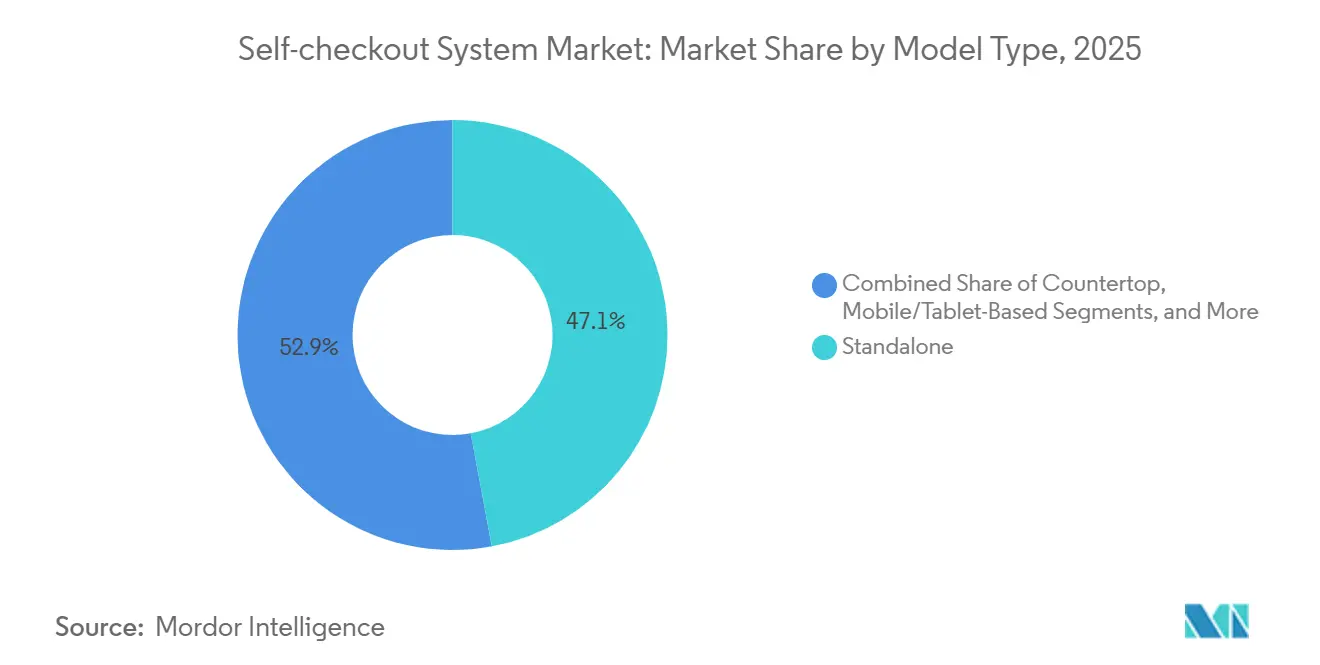
- By model type, standalone kiosks accounted for 47.07% of 2025 revenue and mobile or tablet systems are advancing at a 9.87% CAGR.
- By end-user industry, retail captured 59.68% of 2025 deployments, but travel venues are pacing the field at a 10.27% CAGR.
- By geography, North America controlled 58.47% share in 2025 and Asia Pacific is forecast to register the fastest 11.86% CAGR to 2031.
Note: Market size and forecast figures in this report are generated using Mordor Intelligence’s proprietary estimation framework, updated with the latest available data and insights as of January 2026.
Global Self-checkout System Market Trends and Insights
Drivers Impact Analysis*
| Driver | (~) % Impact on CAGR Forecast | Geographic Relevance | Impact Timeline |
|---|---|---|---|
| Rising Adoption by Supermarkets and Hypermarkets | +2.1% | Global, led by North America and Europe | Medium term (2-4 years) |
| Labor Shortages and Increasing Labor Costs | +2.3% | North America, Europe, Japan, Australia | Short term (≤ 2 years) |
| Growing Preference for Cashless and Contactless Payments | +1.8% | Global, led by Asia Pacific and Europe | Medium term (2-4 years) |
| Technological Advances in AI and Computer-Vision | +1.5% | North America, Europe, China | Long term (≥ 4 years) |
| Store-as-Media Monetization Through SCO Screens | +0.6% | North America and Europe | Long term (≥ 4 years) |
| App-Driven Personalized Promotions and Analytics | +0.7% | North America, Europe, urban Asia Pacific | Medium term (2-4 years) |
| Source: Mordor Intelligence | |||
Rising Adoption by Supermarkets and Hypermarkets
Large-format grocers now view the self-checkout system market as a strategic lever to free staff for click-and-collect picking and shelf-stocking tasks. An NCR Voyix survey of 1,000 U.S. shoppers in 2024 found that 43% prefer self-service, with the figure climbing to 60% among adults aged 18-44.[1]NCR Voyix, “Consumer Preferences and Self-Checkout Trends,” NCRVOYIX.COM Kroger reported that baskets rung through its 2,700 self-checkout lanes match the value of baskets at manned registers, calming earlier fears of trade-down. Tesco’s hybrid service model routes simple baskets to kiosks while reserving staffed lanes for age-restricted items, preserving compliance and customer choice. Carrefour’s 2025 pilot of scan-and-go apps in 150 French stores suggests European hypermarkets see mobile checkout as the next evolution. Together, these moves underscore a structural commitment from grocers to self-service formats that will sustain double-digit deployment growth.
Labor Shortages and Increasing Labor Costs
Retail quit rates sat at 3.2% per month in 2024, topping the economy-wide average and forcing operators to automate front-end roles. Japan projects a 6.4 million-worker shortfall by 2030, accelerating kiosk adoption in convenience stores.[2]Ministry of Health, Labour and Welfare, Japan, “Labor Force Projections 2030,” MHLW.GO.JP Walmart disclosed that self-checkout has trimmed labor hours per transaction by 35%, unlocking 740,000 associate hours for e-commerce fulfillment. Australia’s 5.75% minimum-wage increase in mid-2024 pushed Woolworths and Coles to widen self-service footprints. As wage inflation grows faster than kiosk amortization rates, the self-checkout system market gains a compelling cost-avoidance narrative that resonates with finance chiefs.
Growing Preference for Cashless and Contactless Payments
India’s Unified Payments Interface clocked 13.4 billion transactions in December 2024, up 58% year over year. Cashless terminals remove the cost of cash handling, armored transport, and counterfeit detection. Target calculated that cashless lanes cost 40% less to operate than cash-accepting kiosks. Regulators also back the shift: India’s 2024 National Retail Policy promotes digital payment in organized retail. As smartphone penetration climbs, cashless checkout becomes table stakes for convenience and hygiene, propelling further penetration of the self-checkout system market.
Technological Advances in AI and Computer-Vision
Computer-vision accuracy for produce now tops 95%, letting kiosks identify items in under 0.5 seconds. Mashgin processed 440 million transactions across 4,000 U.S. sites in 2024, showcasing sub-second recognition without barcodes. Toshiba’s MxP Vision Kiosk, unveiled at NRF 2025, combines Intel RealSense cameras with edge inference for real-time fraud alerts.[3]Toshiba Global Commerce Solutions, “MxP Vision Kiosk Launch,” COMMERCE.TOSHIBA.COM Standard AI and Zippin deploy ceiling-mounted cameras to offer just-walk-out baskets, broadening use cases beyond fixed kiosks. As algorithms mature, retailers gain shrinkage control while providing frictionless experiences, making AI the central differentiator in the self-checkout system industry.
Restraints Impact Analysis*
| Restraint | (~) % Impact on CAGR Forecast | Geographic Relevance | Impact Timeline |
|---|---|---|---|
| High Initial Capital Expenditure for SMB Retailers | -1.2% | Global, acute in South America, Africa, South Asia | Short term (≤ 2 years) |
| Theft and Shrinkage Concerns at Unattended Lanes | -0.9% | Global, concentrated in North America and Europe | Medium term (2-4 years) |
| Consumer Demand for Human Interaction in Premium Retail | -0.4% | Europe, North America, Middle East | Long term (≥ 4 years) |
| Data-Privacy Legislation Limiting Biometric Scanning | -0.6% | Europe, North America, select Asia Pacific markets | Medium term (2-4 years) |
| Source: Mordor Intelligence | |||
High Initial Capital Expenditure for SMB Retailers
Independent grocers face kiosk price tags of USD 15,000-40,000, a steep hurdle when EBITDA margins hover near 3%.[4]IT Retail, “Self-Checkout Capital Expenditure Study,” ITRETAIL.COM Entry models under USD 3,000 often exclude payment modules, forcing trade-offs that raise shrinkage. Zippin’s subscription option converts capex into opex, but annual fees can exceed USD 48,000 if stores run modest traffic. Import duties of up to 35% in South America plus double-digit lending rates further stretch payback periods. Until hardware costs fall or financing improves, small formats will adopt cautiously, dampening near-term self-checkout system market growth.
Theft and Shrinkage Concerns at Unattended Lanes
Shrinkage at self-service lanes runs 2-4 percentage points above staffed registers, costing U.K. grocers GBP 2 billion (USD 2.5 billion) in 2024. Lidl paused an AI-surveillance rollout after privacy pushback, showing how theft solutions can collide with customer sentiment. Diebold Nixdorf’s Vynamic Smart Vision claims 30% loss reduction but adds USD 5,000-8,000 in license fees per terminal. Walmart still employs 4,000 asset-protection associates for kiosk monitoring. Thus, loss-prevention spend partially offsets labor savings and tempers the self-checkout system market’s cost-case narrative.
*Our forecasts treat driver/restraint impacts as directional, not additive. The impact forecasts reflect baseline growth, mix effects, and variable interactions.
Segment Analysis
By Offering: Services Outpace Hardware as Integration Complexity Rises
Services will expand at an 11.31% CAGR through 2031, outstripping hardware’s installed-base dominance because retailers need POS integration, computer-vision analytics, and managed upgrades. Integration contracts average USD 50,000-120,000 for mid-sized grocers, pushing the self-checkout system market size in services toward a larger revenue pool.[5]ECR Software Corporation, “Integration Cost Benchmarks,” ECRS.COM Maintenance at 15-20% of hardware cost and rising demand for training lift recurring billings. Hardware retains scale thanks to scanners, payment modules, and scales, yet commoditization squeezes margin. Modular kiosks from Pan-Oston let retailers refresh payment modules without full replacements, trimming lifecycle expense. Software subscriptions linked to AI detection and loyalty engines provide predictable income, sharpening vendor focus on cloud updates over physical units.
Software-led value creation also injects competitive tension as computer-vision specialists monetize algorithms independently of hardware. This pivot raises switching risk for legacy vendors anchored to terminal sales. As retailers standardize on open APIs, best-of-breed analytics can bolt onto any kiosk platform, redistributing power inside the self-checkout system market. Vendors that bundle white-label media networks on kiosk screens add a higher-margin revenue stream, attracting CPG advertising dollars and further elevating service share.


By Transaction Type: Cashless Lanes Accelerate as Digital Wallets Gain Share
Cash-based terminals retained 61.79% of self-checkout system market share in 2025, but cashless lanes are tracking a 12.02% CAGR to 2031 on the back of wallet apps and contactless cards. Cashless kiosks remove bill recyclers and coin hoppers, cutting capex and ongoing vault-cash courier fees. Target quantified a 40% lower operating cost for cashless units. Hybrid kiosks give flexibility in cash-dependent regions yet introduce mechanical complexity and service calls. India’s UPI surge illustrates an accelerating glide path toward full cashless, while underbanked communities in parts of the United States still mandate cash acceptance. Regulatory nudges that cap interchange or nudge digital acceptance will keep steering capital toward electronic-only lanes, broadening the self-checkout system market.
The shift also widens inclusion of value-added services such as buy-now-pay-later at the kiosk, boosting average ticket sizes. Yet retailers must balance payment optionality with queue time: cash transactions remain slower due to bill validation. Over time, differential hardware savings and faster line speeds will tip more operators toward pure cashless configurations.
By Model Type: Mobile Platforms Disrupt Fixed Infrastructure
Standalone kiosks delivered 47.07% of 2025 revenue, but mobile and tablet solutions are pacing at a 9.87% CAGR. Walmart Plus Scan and Go lets members bypass fixed lanes, signaling that in-app checkout can coexist with kiosk fleets. Amazon’s Dash Cart embeds scanners in shopping carts, merging scan-and-go with weight sensors. Countertop and wall-mounted forms thrive where floor space is scarce, including pharmacies and quick-service restaurants. Modular systems from StrongPoint allow attachments such as cash acceptors or 2-D scanners without whole-unit swaps.
As 5G and edge computing mature, mobile models can offload vision processing to cloud services, reducing on-cart hardware costs and unlocking new entrants. For retailers, agile models lower capex and accelerate pilots, fostering broader dispersion of the self-checkout system market. Yet mobile’s success hinges on high app adoption and reliable store Wi-Fi, meaning fixed kiosks will remain a cornerstone in high-traffic stores for the foreseeable future.
By End-User Industry: Travel Venues Prioritize Throughput Over Labor Savings
Retail maintained 59.68% of 2025 deployments, but travel hubs are advancing at a 10.27% CAGR as airports, rail hubs, and stadiums aim to cut queue times. Heathrow’s 2025 pilot of Zippin’s Walk-Up lanes processed duty-free baskets in under 45 seconds. The O2 arena’s Amazon Just Walk Out concessions reduced event-rush transaction times to below 30 seconds. Cruise operators and train stations are exploring compact kiosks that handle both tickets and retail, improving passenger flow.
Specialty retail segments such as pharmacy and DIY adopt kiosks selectively, reserving staffed counters for high-touch advisory moments. Luxury stores continue to favor personal interaction, limiting kiosk rollout. Yet entertainment venues, cinemas, and theme parks see value in autonomous micro-stores that extend selling capacity without expanding footprint. This pattern diversifies end-market revenue and cements the self-checkout system industry’s cross-vertical relevance.
Geography Analysis
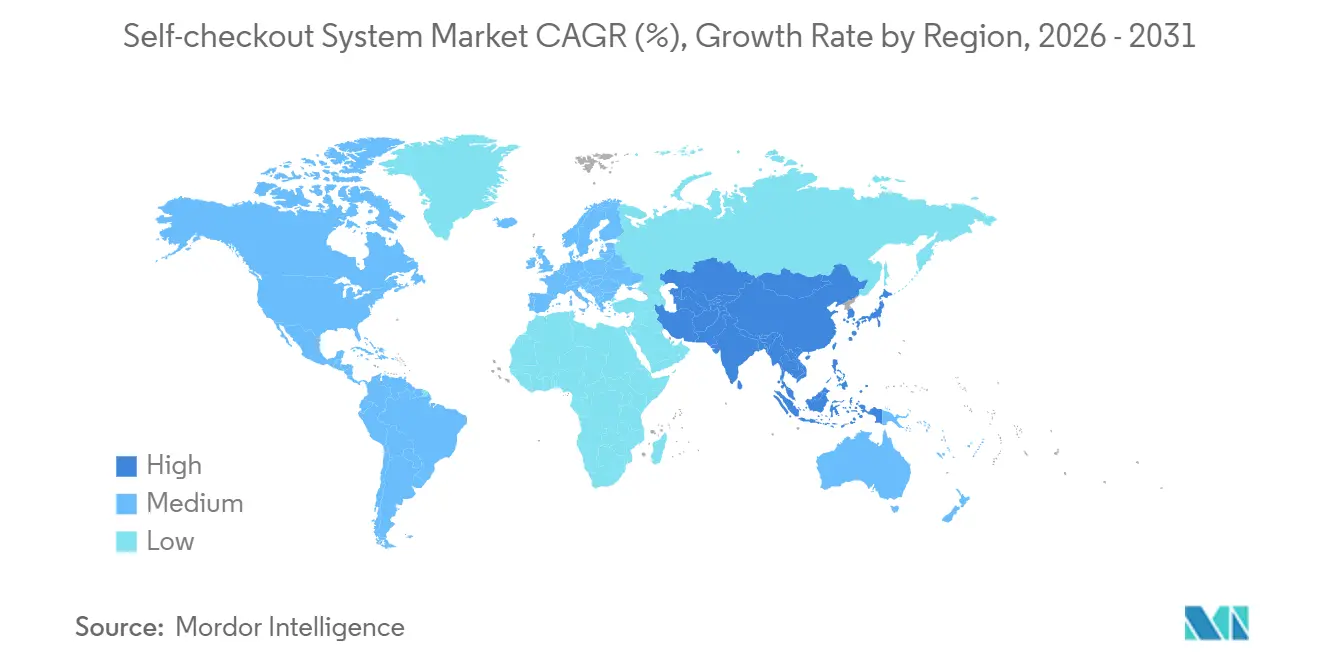
North America commanded 58.47% of revenue in 2025 on the strength of high labor costs, near-universal POS card penetration, and early adopter culture. U.S. grocers invest heavily in AI analytics, while Canadian retailers extend kiosk footprints alongside rising minimum wages. Mexico’s organized retail sector mirrors these drivers, although cash acceptance remains critical in rural areas.
Europe ranks second, with momentum in the United Kingdom, Germany, and France. The self-checkout system market size in Europe faces new compliance overhead as the AI Act designates biometric vision as high-risk, requiring third-party audits.[6]European Commission, “Artificial Intelligence Act,” EC.EUROPA.EU German discounters such as Lidl balance shrinkage variability with aggressive cost targets, creating fertile ground for computer-vision analytics. Southern Europe lags due to high cash preference and smaller store footprints, but tourism hubs are piloting compact units.
Asia Pacific is the fastest-growing region at an 11.86% CAGR, propelled by China’s unmanned-store boom and India’s National Retail Policy. China’s self-checkout system market benefits from mature QR-code payments and state support for smart retail.[7]Ministry of Commerce, People’s Republic of China, “Unmanned Retail Report,” MOFCOM.GOV.CN India’s GST harmonization and digital-wallet surge foster organized retail formats that favor kiosks. Japan’s acute labor shortage drives convenience stores to install compact units even in sub-500 square-foot shops. South Korea and ASEAN grocers pilot smartphone scan-and-go to serve mobile-centric shoppers, while Australia extends kiosks in response to wage hikes and turnover.
South America grows off a smaller base; Brazil and Argentina lead adoption as fintech wallets expand. Import tariffs and volatile exchange rates temper pace. The Middle East invests via smart-city initiatives, with Dubai promoting cashless retail as part of its digital-economy blueprint.[8]Department of Economy and Tourism, Dubai, “Cashless Transaction Strategy,” DUBAIDET.AE Africa remains nascent, though South Africa pilots kiosks in urban supermarkets. Overall, regional dynamics point to converging global appetite for the self-checkout system market tempered by local payment and labor variables.

Regulatory Landscape
Regulation for self-checkout systems is increasingly shaped by operational controls, accessibility mandates, and worker-protection requirements that influence how lanes are configured, monitored, and upgraded. In the United States, state-level bills and enacted rules have focused on staffing and deployment limits for grocery environments, including Rhode Island General Assembly H 7290 (introduced January 2026) proposing limits such as caps on the number of self-checkout stations per location and mandated manned-to-self-checkout ratios, and Connecticut General Assembly SB 438 (advanced through committee review in April 2026) proposing required manual-lane coverage and monitoring constraints.
In Europe, the European Accessibility Act took effect on June 28, 2025, requiring self-service terminals to meet accessibility requirements aligned with EN 301 549, which affects kiosk hardware selection, UI design, and field validation. Separately, California SB 1446 adds labor and safety process requirements for grocery and drug retail workplace technology deployments, including notice periods and integration into injury and illness prevention programs, increasing the importance of compliance documentation and change-management steps during rollout.
Value Chain Analysis
The value chain covers component suppliers (touch displays, barcode/2D imagers, scales, cameras, payment modules, and compute), system integrators and software providers (POS integration, loyalty/CRM connectors, computer vision, and fraud analytics), and channel partners that deploy and support fleets (retail IT service firms and OEM field-service networks). At the retail end, operators increasingly position self-checkout as part of a broader self-service estate that includes scan-and-go apps, kiosks, and smart carts, which increases the importance of platform software, device management, and data governance alongside the physical terminal.
Downstream activities, including loss prevention and compliance, are now core spend categories rather than add-ons, with ECR Retail Loss research in 2026 highlighting both operational risk (shrink uplift after installation) and the effectiveness of interventions such as prompts and missed-scan identification. Hardware vendor power remains supported by scale shipments and manufacturing control, as Datos Insights cites NCR Voyix at 22% of global self-checkout shipments in 2024 (and 54% in North America), while service and software revenue expands through integration, upgrades, and managed operations that help keep systems aligned with accessibility and staffing constraints.
Competitive Landscape
Legacy POS vendors NCR Voyix, Diebold Nixdorf, and Toshiba Global Commerce Solutions controlled an estimated 45% of hardware shipments in 2025, yet hardware gross margins narrowed as kiosks commoditized. NCR Voyix transitioned to an ODM model with Ennoconn in 2024 to focus on software and managed services. Diebold Nixdorf launched Vynamic Smart Vision to embed Azure-based produce recognition, seeking to lift attach-rate revenue.
Disruptors Mashgin, Standard AI, and Zippin bypass barcodes using computer vision, winning convenience stores, stadiums, and corporate cafeterias. Mashgin’s 440 million 2024 transactions provide scale proof for AI kiosks.[9]Mashgin, “Company Overview,” MASHGIN.COM Standard AI, backed by USD 35 million in Series B funding, positions its retro-fit camera rig as a capex-light pathway for existing retailers.[10]Standard AI, “Series B Funding Release,” STANDARD.AI
White-space growth lies in healthcare and banking. Amazon Pharmacy’s 2025 kiosk pilot dispenses pre-packed prescriptions in minutes, foreshadowing broader healthcare migration. Banks are trialing self-service machines for routine teller tasks, freeing advisors for complex queries. Competitive intensity now hinges on AI performance, integration ease, and the ability to bundle retail-media capabilities that create incremental profit pools beyond transaction processing.
Self-checkout System Industry Leaders
Diebold Nixdorf, Inc.
Fujitsu Ltd.
NCR Corporation
ECR Software Corporation
Toshiba Global Commerce Solutions
- *Disclaimer: Major Players sorted in no particular order

Market Opportunities and Future Outlook
Opportunities are clustering around software-led retrofits and operational optimization layers that help retailers maintain self-checkout throughput while reducing shrink and meeting new compliance requirements. ECR Retail Loss data published in 2026, based on 39 retailers with over EUR 1 trillion in combined annual turnover, found that 54% of retail transactions are completed via self-service, which supports demand for attach solutions such as computer-vision accuracy tools, on-screen intervention logic, exit gating, and centralized analytics. As state-level proposals and enacted measures, including Rhode Island staffing-ratio rules in 2026 and California SB 1446 worker-notification and safety-program requirements for grocery and drug retail, raise the cost of purely labor-based supervision, vendors that bundle compliance-ready workflows, audit logs, and configurable lane policies have clearer differentiation.
White space also appears in non-grocery deployments and multi-format self-service rollouts where retailers standardize across terminals, scan-and-go, and other self-service endpoints. Inditex reported in June 2026 that self-checkout registers process nearly 100% of sales in many of its stores, indicating scaled adoption beyond supermarkets and an emphasis on reliable, low-friction user experience in high-volume apparel environments. On the supply side, outsourced and modular manufacturing models, along with margin migration toward software and services, creates room for subscription offerings that shift capex barriers into opex, especially for independent and mid-sized operators that face upfront kiosk cost pressure.
Recent Industry Developments
- January 2026: NCR Voyix commenced the transition of its self-checkout and POS hardware business to Ennoconn, moving to an outsourced design and manufacturing model. The shift restructures supply-chain responsibilities while allowing NCR Voyix to concentrate more of its roadmap and commercial focus on software, integration, and managed services around self-checkout fleets.
- May 2025: Diebold Nixdorf established a new retail technology production line in North Canton, Ohio, to build self-service checkouts and kiosk systems, including the DN Series EASY family. Bringing production closer to a major demand center supports delivery responsiveness for large rollouts and aligns manufacturing capacity with localized requirements.
- January 2024: NCR Voyix launched a next-generation self-checkout solution built on a SaaS-based software stack with flexible hardware configurations. The release reinforced the market shift toward software-defined checkout, enabling faster feature updates and tighter integration with fraud analytics and loyalty systems.


Research Methodology Framework and Report Scope
Market Definition and Coverage
For this study, the self-checkout system market covers revenue generated from solutions that let shoppers complete checkout without a staffed cashier, including the hardware, software, and related services used at the point of sale across industries.
Scope exclusions: We exclude general POS terminals and store IT that does not directly enable a self-checkout transaction workflow.
Segmentation Overview
- By Offering
- Hardware
- Payment Modules
- Barcode Scanners
- Weighing Scales
- Display and Touch Panels
- Other Hardwares
- Software
- POS Integration Software
- Computer-Vision Software
- Fraud-Prevention Analytics
- Loyalty and CRM Integration
- Services
- Integration and Deployment
- Maintenance and Support
- Managed Services
- Consulting and Training
- Hardware
- By Transaction Type
- Cash
- Cashless
- Hybrid
- By Model Type
- Standalone
- Countertop
- Mobile/Tablet-Based
- Wall-Mounted
- Modular
- By End-User Industry
- Retail
- Supermarkets and Hypermarkets
- Department Stores
- Convenience Stores
- Specialty Stores
- Pharmacy and Drugstores
- Entertainment
- Cinemas
- Theme Parks
- Stadiums
- Travel
- Airports
- Railway Stations
- Cruise Terminals
- Financial Services
- Bank Branches
- Healthcare
- Hospitals
- Pharmacies
- Other End-User Industries
- Quick Service Restaurants
- Universities and Campuses
- Retail
- By Geography
- North America
- United States
- Canada
- Mexico
- South America
- Brazil
- Argentina
- Rest of South America
- Europe
- Germany
- United Kingdom
- France
- Italy
- Spain
- Russia
- Benelux
- Nordics
- Rest of Europe
- Asia-Pacific
- China
- India
- Japan
- South Korea
- ASEAN
- Australia and New Zealand
- Rest of Asia-Pacific
- Middle East
- GCC
- Turkey
- Israel
- Rest of Middle East
- Africa
- North Africa
- South Africa
- Rest of Africa
- North America
Data Sources, Market Sizing, and Validation
Desk Research
Desk research started by mapping where self-checkout is being deployed and why, so the model is anchored to real adoption drivers and constraints. We used public sources such as the US Census Bureau retail trade series, US Bureau of Labor Statistics wage and productivity series, Eurostat retail indicators, central bank payment statistics, and selected customs trade databases for relevant hardware categories.
After that, company filings, investor presentations, retailer press releases, and association websites were reviewed to understand rollout pace, store format priorities, and the typical packaging of solutions (hardware with software and services). A paid subscription for company financials and intelligence was used to cross-check revenue splits and to avoid double counting when systems are sold through partners. The desk sources listed here are illustrative, and additional public references were used for data collection, validation, and research clarification.
Primary Interviews and Surveys
Primary work was used to pressure-test adoption assumptions that desk sources do not fully show, especially conversion rates from staffed lanes to self-checkout and the mix of cashless versus hybrid deployments. Respondent input clarified pricing structure, replacement cycles, and service attachment rates for both solution providers and large retail and non-retail users across major regions, and we then adjusted the model assumptions where needed.
Distribution of primary research fieldwork respondents
| Company type | Respondent position | Region |
|---|---|---|
| Top tier: 35% | CXOs: 13% | APAC: 41% |
| Mid tier: 45% | Functional/Unit leaders: 28% | EMEA: 34% |
| Smaller Players: 20% | Managers: 59% | Americas: 25% |
Market-Sizing & Forecasting
Sizing was built using a top-down approach where retail footprint and checkout lane dynamics are reconstructed into an addressable install base, which is then converted into annual demand using replacement cycles and new-store additions. To keep the outcome grounded, totals were corroborated with selective bottom-up checks, such as sampling average selling prices by model type and validating shipment and deployment discussions from the channel.
Key inputs used in the model include store counts by format, estimated self-checkout penetration by region, share of cashless and hybrid configurations, typical number of units per store, and service and software attachment patterns over the system life. Where a bottom-up roll up had missing pieces (for example, privately held regional providers), gaps were handled through conservative share assumptions validated through interviews, then rechecked against the install base logic.
Forecasts were built using scenario analysis that links adoption pace to labor availability signals, customer throughput needs, and the ongoing shift toward cashless payments. These assumptions were reviewed with interview respondents so the trajectory aligns with observed procurement behavior.
Data Validation & Update Cycle
Model outputs were cross-verified against independent signals, including unit deployment commentary, regional retail expansion trends, and observed shifts in transaction types. Variances were investigated before final sign-off. When an input moved outside a reasonable range, the underlying driver was traced back to the original source note, and follow-up questions were raised with the relevant interviewees.
Before publication, the numbers undergo a multi-step analyst review to catch calculation errors, double counting, and currency conversion timing issues early. Reports are refreshed annually, and interim updates are made when material events occur, after which an analyst performs a fresh pass so clients receive the latest updated view.
Mordor Intelligence's Self Checkout System Market Size Compared With Other Published Estimates
Published market values for self-checkout systems often differ because each publisher sets its own scope and timing, then applies different pricing and adoption assumptions. The biggest swings usually come from whether mobile or tablet based checkout is counted the same as fixed lanes, how services are treated, and which year is used as the starting point.
The main gap comes from what gets counted as a complete self-checkout deployment. Here, Mordor Intelligence counts hardware, software, and services tied to self-checkout workflows, but avoids inflating totals with general POS and store IT spend. Differences also show up when one estimate starts from 2024 revenues and another uses 2025 as a base year, or when ASP assumptions move forward faster than replacement cycles and the cashless versus hybrid mix would suggest.
Benchmark comparison
| Source | Market Size | Gaps in Research Methodology |
|---|---|---|
| Mordor Intelligence | USD 5.44 B (2025) | |
| Industry Research Publisher A | USD 5.56 B (2025) | Uses 2025 as the base year as well, but scope and pricing treatment can differ by counting a broader retail automation set and applying faster ASP uplift assumptions into the forecast. |
| Market Tracker B | USD 4.70 B (2024) | Starts from a 2024 base year and may capture a narrower component set, which can lower the starting value even if long-range growth assumptions remain aggressive. |
Across the three figures, the spread is explained mostly by scope inclusions and base-year choice, not by a single math error. By tying the model to install base logic, transaction mix, and realistic replacement behavior, the estimate stays traceable to clear inputs that can be revisited as adoption patterns change.


Key Questions Answered in the Report
What is the projected value of the self-checkout system market in 2031?
The market is forecast to reach USD 9.03 billion by 2031 at an 8.63% CAGR.
Which segment will add the most incremental revenue by 2031?
Services, growing at an 11.31% CAGR, will add the greatest incremental revenue as retailers seek integration and analytics.
How fast is the cashless checkout segment expanding?
Cashless lanes are forecast to grow at a 12.02% CAGR between 2026 and 2031.
Which region is expected to record the quickest growth?
Asia Pacific is projected to advance at an 11.86% CAGR, fueled by China's unmanned retail and India's policy support.
What technology shift is most disruptive to traditional kiosks?
Computer-vision checkout that eliminates barcode scanning is compressing transaction time and attracting retailer investment.
How are retailers offsetting kiosk hardware costs?
Many are selling advertising on kiosk screens, generating media revenue that can cover up to 20% of annual hardware amortization.
Page last updated on:






