
Security Operation Center As A Service Market Size and Share
Market Overview
| Study Period | 2020 - 2031 |
|---|---|
| Market Size (2026) | USD 14.77 Billion |
| Market Size (2031) | USD 26.93 Billion |
| Growth Rate (2026 - 2031) | 12.77% CAGR |
| Fastest Growing Market | Asia Pacific |
| Largest Market | North America |
| Market Concentration | Medium |
Major Players *Disclaimer: Major Players sorted in no particular order Image © Mordor Intelligence. Reuse requires attribution under CC BY 4.0. | |
Security Operation Center As A Service Market Analysis by Mordor Intelligence
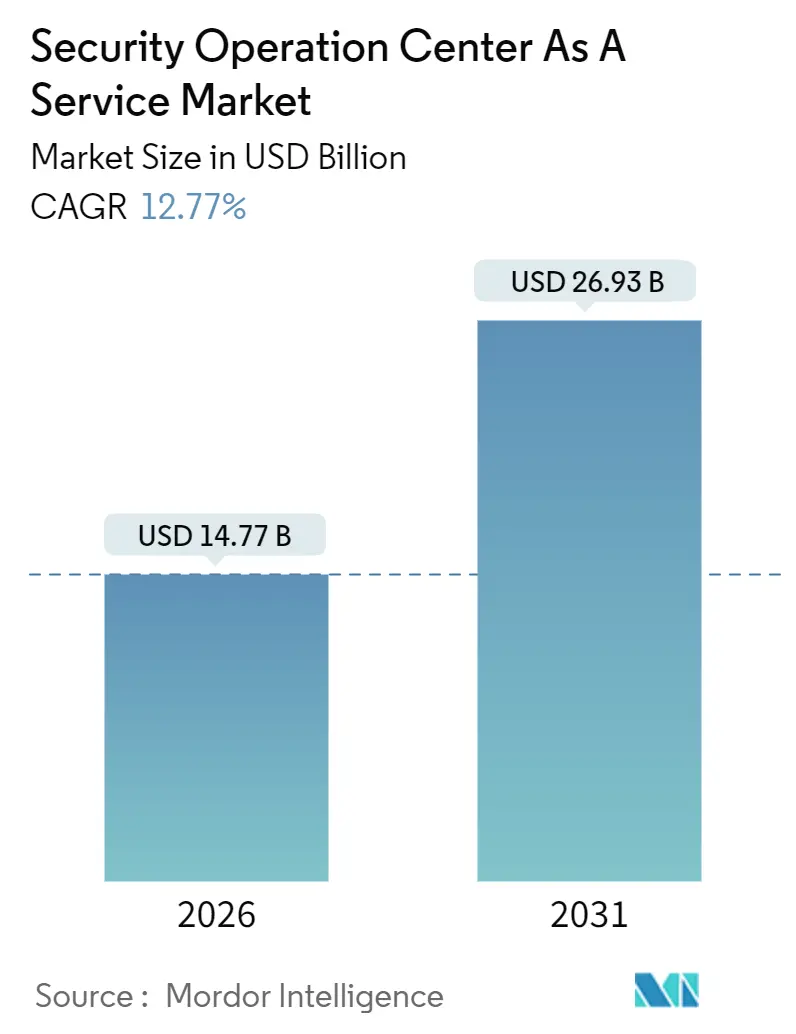
The security operation center as a service market was valued at USD 14.77 billion in 2026 and is projected to reach USD 26.93 billion by 2031, advancing at a 12.77% CAGR over the forecast period. Driven by rising regulatory scrutiny, tightening cyber-insurance underwriting, and the scarcity of qualified analysts, buyers are shifting from capital-intensive, on-premises security information and event management platforms to outcome-based managed detection and response subscriptions. Enterprises also favor cloud-delivered analytics that uncover multi-vector ransomware, supply-chain, and credential-theft activity that evades signature tools. Demand is amplified by the convergence of operational technology and Internet of Things environments, which broadens the attack surface and requires unified visibility. Competitive dynamics remain fluid as telecommunications carriers, regional specialists, and artificial-intelligence-driven disruptors challenge incumbent managed security service providers.
Key Report Takeaways
- By enterprise size, large organizations commanded 68.23% revenue share in 2025, whereas small and medium enterprises are expanding at a 13.84% CAGR to 2031.
- By service type, managed detection and response led with 41.52% of security operation center as a service market share in 2025, while incident response and threat hunting is advancing at a 13.19% CAGR through 2031.
- By deployment model, hybrid cloud accounted for 52.31% of security operation center as a service market size in 2025 and is forecast to post a 14.28% CAGR to 2031.
- By end-user industry, banking, financial services, and insurance held 29.63% of 2025 revenue, whereas healthcare and life sciences is projected to grow at a 14.36% CAGR to 2031.
- By geography, North America captured 43.81% of 2025 revenue, while Asia Pacific is set to register the fastest 15.27% CAGR through 2031.
Note: Market size and forecast figures in this report are generated using Mordor Intelligence’s proprietary estimation framework, updated with the latest available data and insights as of January 2026.
Global Security Operation Center As A Service Market Trends and Insights
Drivers Impact Analysis*
| Driver | (~) % Impact on CAGR Forecast | Geographic Relevance | Impact Timeline |
|---|---|---|---|
| Exponential Rise in Multi-Vector Cyber-Attacks | +2.8% | Global, with acute concentration in North America and Europe | Short term (≤ 2 years) |
| Escalating Cybersecurity-Talent Shortage | +2.4% | Global, most severe in North America, Western Europe, and Asia Pacific technology hubs | Medium term (2-4 years) |
| Expanding Cloud and Hybrid IT Attack Surface | +2.1% | Global, led by North America and Asia Pacific cloud-adoption leaders | Medium term (2-4 years) |
| Regulatory Push for Real-Time Incident Disclosure | +1.9% | North America (SEC), Europe (NIS2), Asia Pacific (emerging frameworks) | Short term (≤ 2 years) |
| Cyber-Insurance Mandates for 24/7 MDR | +1.7% | North America and Europe, with spillover to Australia and Singapore | Medium term (2-4 years) |
| OT and IoT Convergence Demanding Unified Visibility | +1.5% | Global, with early gains in manufacturing-intensive regions such as Germany, Japan, South Korea | Long term (≥ 4 years) |
| Source: Mordor Intelligence | |||
Exponential Rise in Multi-Vector Cyber-Attacks
Threat actors now chain ransomware, data exfiltration, and denial-of-service extortion in rapid succession, overwhelming in-house teams that still rely on periodic log reviews. The Federal Bureau of Investigation recorded USD 12.5 billion in cyber-crime losses during 2023, a 22% surge driven by ransomware and business email compromise.[1]Federal Bureau of Investigation, “Internet Crime Report 2023,” IC3.GOV In 2024, the Cybersecurity and Infrastructure Security Agency observed a 30% uptick in incidents involving initial-access brokers that shorten dwell time to fewer than 24 hours. This acceleration favors managed detection and response providers that maintain global analyst benches and behavioral analytics capable of identifying lateral movement within minutes. Organizations that once tolerated weekly reviews now demand sub-hour mean time to detect, creating dependencies on outsourced experts. The shift from perimeter defense to assume-breach postures further boosts incident-response retainer sales bundled with continuous monitoring.
Escalating Cybersecurity-Talent Shortage
The worldwide security workforce gap reached 4 million positions in 2024, including 700,000 vacancies in North America alone. Salary inflation for tier-one analysts topped 15% year-over-year, yet turnover remained higher than 25%, eroding institutional knowledge and expanding alert backlogs. Small and medium enterprises struggle most to match compensation levels offered by large technology and financial players, prompting them to adopt subscription-based security operation center as a service market offerings that spread analyst costs across hundreds of clients. Providers achieve economies of scale to fund advanced automation and threat-intelligence platforms that individual enterprises cannot justify. The shortage is particularly acute in cloud-native disciplines such as Kubernetes runtime protection, further solidifying the outsourcing trend.
Expanding Cloud and Hybrid IT Attack Surface
Public-cloud adoption has fragmented visibility, as traditional on-premises tooling rarely ingests audit logs from infrastructure-as-a-service, platform-as-a-service, or software-as-a-service environments. A breach of a widely used file-transfer application in 2023 impacted over 2,000 organizations, underscoring the concentration risk within shared-responsibility models. Hybrid deployments multiply complexity by adding proprietary log formats from on-premises active directory, network devices, and software-defined wide-area networks. Managed detection and response vendors fill this gap with lightweight agents that normalize telemetry into unified data lakes, enabling cross-domain threat hunting. As enterprises move to multi-cloud strategies to avoid vendor lock-in, vendor-agnostic platforms that accommodate Amazon Web Services, Microsoft Azure, and Google Cloud logs gain prominence.
Regulatory Push for Real-Time Incident Disclosure
The United States Securities and Exchange Commission’s 2023 rule obliges registrants to report material incidents within four business days. In the European Union, the Network and Information Security Directive 2 requires essential and important entities to alert national authorities within 24 hours. Singapore and Australia have enacted similar mandates. These compressed timelines force enterprises to maintain continuous monitoring, automated evidence collection, and rapid forensic analysis capabilities more readily delivered through the security operation center as a service market than through overstretched internal teams.
Restraints Impact Analysis*
| Restraint | (~) % Impact on CAGR Forecast | Geographic Relevance | Impact Timeline |
|---|---|---|---|
| Data-Sovereignty and Log-Residency Concerns | -1.2% | Europe (GDPR), Asia Pacific (China, India, Indonesia), Middle East | Medium term (2-4 years) |
| Integration Complexity With Legacy Tooling | -0.9% | Global, particularly acute in large enterprises with decades-old infrastructure | Short term (≤ 2 years) |
| Limited Organization-Specific Context in Outsourced SOC | -0.7% | Global, affecting mid-market and enterprise buyers with unique environments | Medium term (2-4 years) |
| Alert-Fatigue From High False-Positive Rates | -0.6% | Global, with higher impact in resource-constrained small and medium enterprises | Short term (≤ 2 years) |
| Source: Mordor Intelligence | |||
Data-Sovereignty and Log-Residency Concerns
General Data Protection Regulation restrictions on personal-data transfer compel providers to operate in-region security operations centers or adopt standard contractual clauses, adding cost and complexity.[2]European Union, “Directive (EU) 2022/2555 on Measures for a High Common Level of Cybersecurity Across the Union,” EUR-LEX.EUROPA.EU India’s Digital Personal Data Protection Act introduces similar requirements, spurring investments in domestic facilities. China’s Cybersecurity Law prevents overseas export of critical information infrastructure logs, effectively reserving that portion of demand for local champions. The resulting fragmentation hampers global providers’ economies of scale, yet gives regional specialists a home-field advantage.
Integration Complexity With Legacy Tooling
Enterprises often run decades-old firewalls, intrusion-prevention systems, and proprietary industrial-control-system protocols that lack modern application programming interfaces. Custom parsers are needed before telemetry can feed cloud-native analytics engines, delaying benefit realization and inflating professional-services costs. A SANS Institute survey found that 60% of organizations cited integration hurdles as the top impediment to managed detection and response adoption. The burden is heavier in highly segmented networks across healthcare and finance, where approval chains slow onboarding.
*Our forecasts treat driver/restraint impacts as directional, not additive. The impact forecasts reflect baseline growth, mix effects, and variable interactions.
Segment Analysis
By Enterprise Size: Consumption Economics Accelerate Small-Firm Uptake
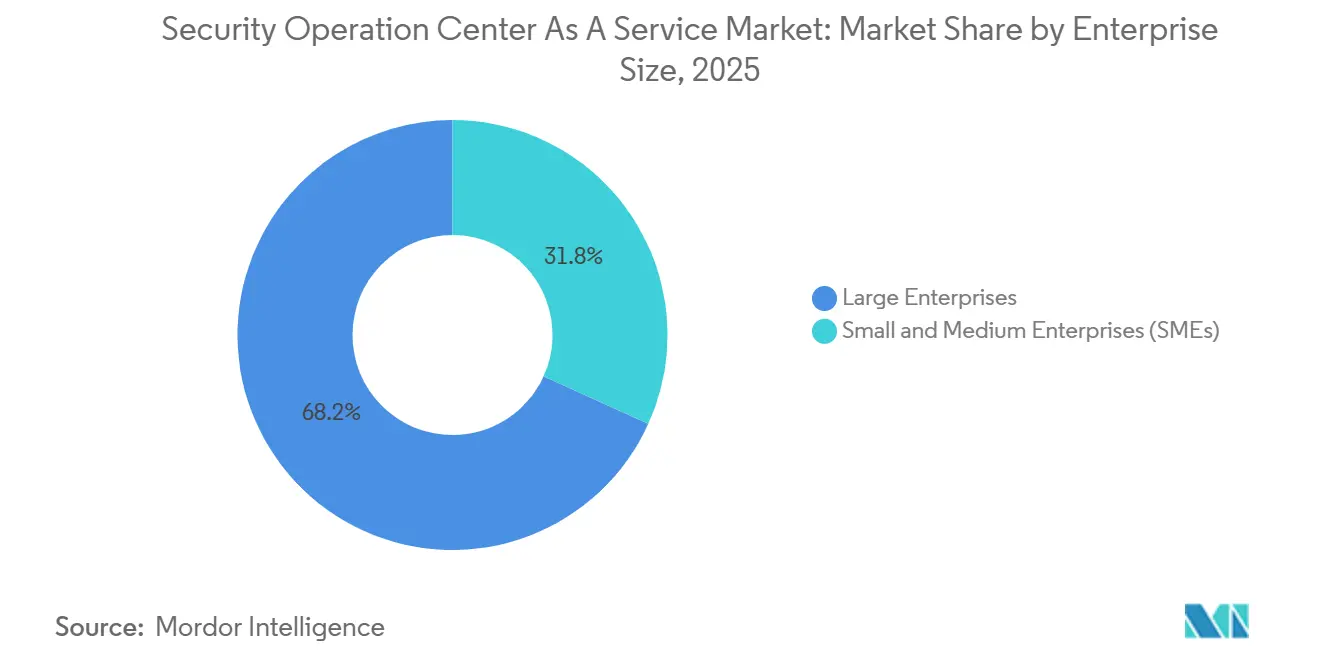
The large-enterprise tier accounted for 68.23% of 2025 revenue in the security operation center as a service market, reflecting the breadth of hybrid estates and stringent audit obligations. These buyers often keep tier-three threat hunting and in-house intelligence but outsource tier-one triage and tier-two investigation, retaining institutional context while gaining 24/7 coverage. The security operations center-as-a-service market for small and medium enterprises is growing faster, advancing at a 13.84% CAGR, because turnkey cloud subscriptions eliminate capital expenditure and scale with headcount growth. Programmatic channel sales by managed service providers further lower acquisition costs and make advanced detection affordable.
Small companies typically adopt standardized playbooks that bundle endpoint detection, security awareness training, and vulnerability scanning, while large organizations demand bespoke runbooks and sector-specific intelligence. As chief information security officers face persistent hiring gaps, even Fortune 500 firms are increasing the portion of alerts routed to external analysts. For smaller buyers, outsourcing is becoming the only viable path to regulatory compliance and cyber-insurance eligibility.


By Service Type: Proactive Threat Hunting Becomes the Differentiator
Managed detection and response captured 41.52% of security operation center as a service market share in 2025, underpinned by continuous monitoring and guided remediation. Incident response and threat hunting services are projected to post a 13.19% CAGR to 2031, outperforming passive log aggregation as enterprises recognize that adversaries can dwell undetected for weeks without proactive searches. The security operation center as a service market size for proactive hunting remains smaller today but commands premium pricing because it requires senior analysts versed in adversary tactics.
Legacy security monitoring is commoditizing as cloud data lakes decouple storage from analytics, prompting providers to integrate automation that suppresses false positives and focuses analysts on high-fidelity signals. Bundled orchestration capabilities and vulnerability management are also emerging as growth vectors, allowing vendors to consolidate toolsets and justify higher average revenue per customer. The unified approach reduces breach costs and simplifies procurement.
By Deployment Model: Hybrid Cloud Strikes a Compliance-Performance Balance
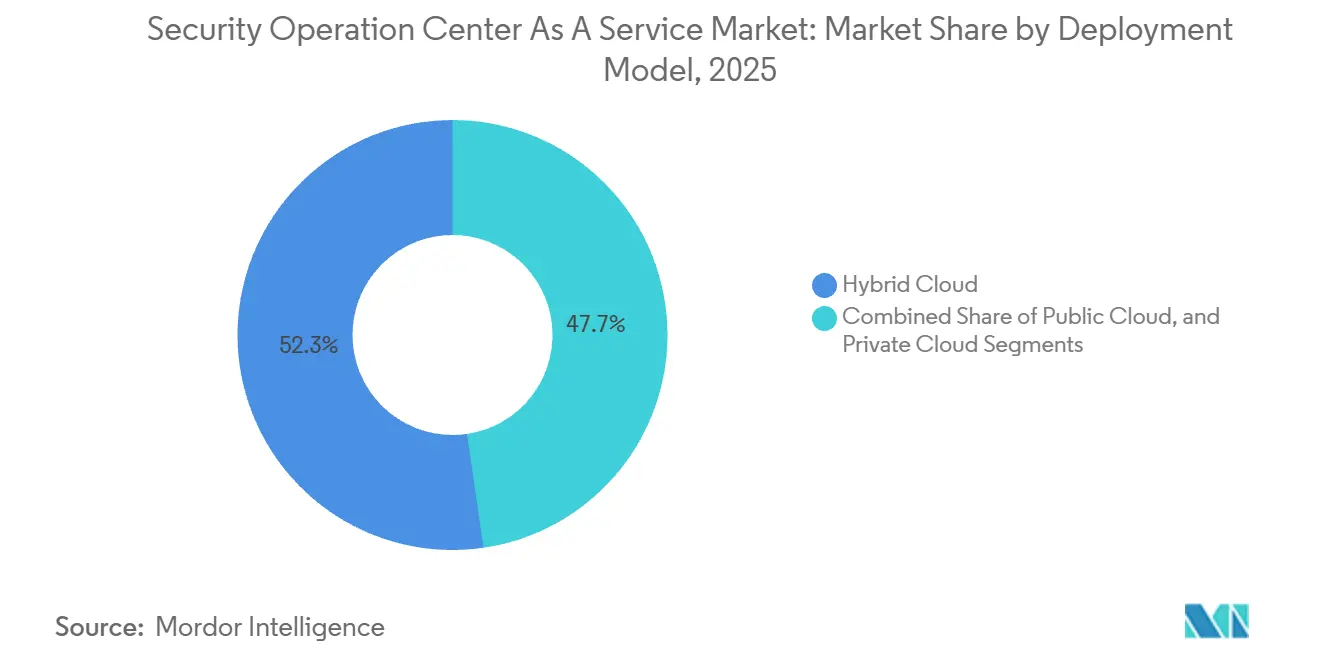
Hybrid architectures contributed 52.31% of 2025 revenue and are rising at a 14.28% CAGR, the highest among deployment models. Organizations forward summarized telemetry to cloud analytics while retaining raw logs with personally identifiable information on-premises, satisfying both latency and privacy mandates. Edge-processing nodes now execute first-stage analytics at customer sites, slashing bandwidth and egress fees.
Public cloud options appeal to digital natives and smaller firms seeking frictionless onboarding, whereas private cloud serves government and finance buyers that require dedicated infrastructure. The security operation center as a service industry continues to innovate with containerized analytics engines that deploy inside customer environments, extending provider visibility without violating residency laws. This flexibility is a decisive factor for multinational corporations juggling multiple regulatory frameworks.

By End-User Industry: Healthcare Growth Outpaces Long-Time BFSI Leader
The banking, financial services, and insurance segment retained its top position with 29.63% of 2025 revenue, thanks to payment security mandates and incident-reporting obligations. Healthcare, however, is set to log the fastest CAGR of 14.36%, driven by ransomware targeting electronic health records and connected medical devices. A 2024 American Hospital Association study showed a 32% year-over-year rise in attacks on healthcare delivery organizations.
Manufacturing adoption is accelerating as industrial control systems merge with Internet of Things devices, generating telemetry previously invisible to corporate security teams. Government agencies, hampered by staffing freezes, increasingly contract out tier-one and tier-two operations. Retail follows as payment fraud and credential-stuffing attacks pressure margins, making managed detection and response a cost-effective mitigation.
Geography Analysis
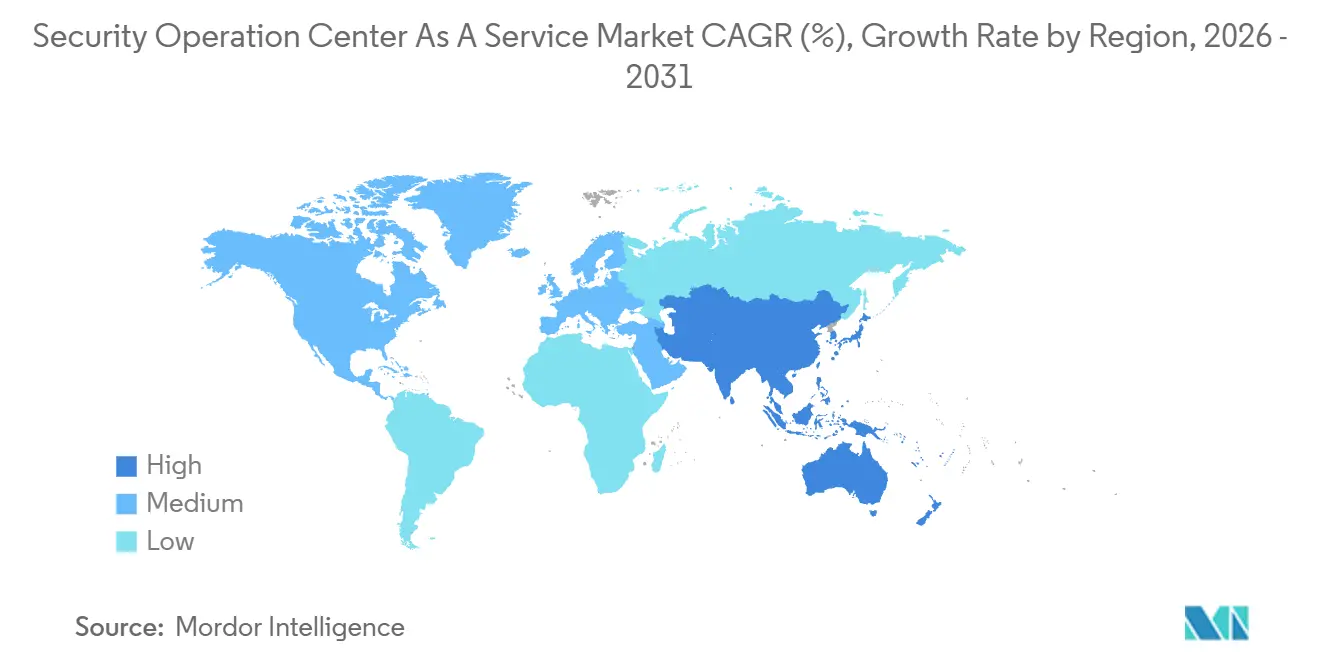
North America accounted for 43.81% of 2025 revenue, buoyed by the United States Securities and Exchange Commission’s disclosure rule, mature cyber-insurance markets, and a concentration of Fortune 500 enterprises. The region is witnessing the replacement of legacy on-premises security information and event management platforms with cloud-native managed detection and response solutions that lower the total cost of ownership. Canada’s breach-notification regime further supports demand, while nearshoring activity in Mexico exposes regional hubs to heightened cyber risk.
Europe claimed a roughly 28% share, anchored by the Network and Information Security Directive 2 that compels 24-hour reporting across essential and important entities. Germany, France, and the United Kingdom bolster adoption through national certifications that raise service-quality baselines. Nevertheless, General Data Protection Regulation residency provisions fragment the provider landscape, favoring vendors with in-country security operations centers.
Asia Pacific is projected to expand at a 15.27% CAGR, the fastest worldwide. India’s Digital Personal Data Protection Act requires local storage of security telemetry, prompting global providers to open Mumbai and Bengaluru facilities. Singapore’s six-hour incident-reporting rule for critical information infrastructure, Australia’s Critical Infrastructure Protection Act, and South Korea’s financial-sector guidelines all create compliance-driven demand. China remains dominated by domestic suppliers due to outbound-data restrictions, yet multinational firms often execute parallel contracts for subsidiaries to maintain group-wide visibility.
South America, the Middle East, and Africa contributed nearly 15% of 2025 revenue. Brazil’s central bank cybersecurity resolution and the United Arab Emirates’ managed security licensing scheme have stimulated regional growth. Saudi Arabia’s Essential Cybersecurity Controls compel critical infrastructure to implement 24/7 monitoring, and South Africa’s regulators are enforcing cyber-resilience guidelines despite macroeconomic headwinds.

Regulatory Landscape
Regulatory pressure continues to formalize SOCaaS requirements around incident disclosure, auditable controls, and provider oversight. In the United States, the SECs 2023 material cyber incident disclosure rule compresses response timelines, while CISA has continued engagement on the CIRCIA rulemaking, including virtual town halls held June 15-18, 2026 that keep incident reporting and evidence readiness in focus for covered entities and their security providers.
Outside the US, cross-border and in-country compliance requirements increasingly shape vendor selection and delivery models. In the EU, NIS2 reporting obligations and the Cyber Solidarity Act reinforce public-private SOC capacity building, and the European Commission proposed targeted NIS2 amendments on January 20, 2026 to improve legal clarity. Saudi Arabia's National Cybersecurity Authority enforces the Regulatory Framework for Licensing Managed Security Operations Center (MSOC) Services (RFMSOC-1:2024), introducing licensing expectations for MSOC providers, while the UK introduced the Cyber Security and Resilience (Network and Information Systems) Bill on November 12, 2025, expanding oversight toward managed service providers and data centers.
Value Chain Analysis
SOCaaS delivery starts with telemetry generation and collection across endpoints, identity, network, cloud, and OT/IoT, followed by ingestion into cloud and data infrastructure layers (public cloud and sovereign cloud options) that store and process high-volume logs. On top of these layers, security technology vendors provide SIEM, SOAR, EDR/XDR, threat intelligence, and increasingly AI-driven investigation tooling, which managed security service providers integrate into runbooks, case management, and 24/7 analyst operations. The final service is packaged into tiered subscriptions (monitoring, MDR, threat hunting, and incident response retainers) with onboarding, integrations, and continuous tuning typically delivered as professional services.
Partnership ecosystems are becoming a primary route to scale capabilities and regional reach, particularly for AI-enabled operations and compliance-driven delivery. Examples include expanded collaborations such as CrowdStrike with IBM to connect AI-assisted detection with SOC orchestration, and LevelBlue with SentinelOne to combine platform telemetry with threat-intelligence-led operations. Regulation and assurance frameworks influence procurement: Saudi Arabia's NCA RFMSOC-1:2024 pushes licensing and operational controls for MSOC providers serving regulated sectors, while ENISA work on an EU managed security services certification concept highlights a shift toward standardized service-quality baselines across member states. SOC maturity assessment frameworks such as SOC-CMM are used as a common benchmark in procurement, audits, and continuous improvement programs.
Competitive Landscape
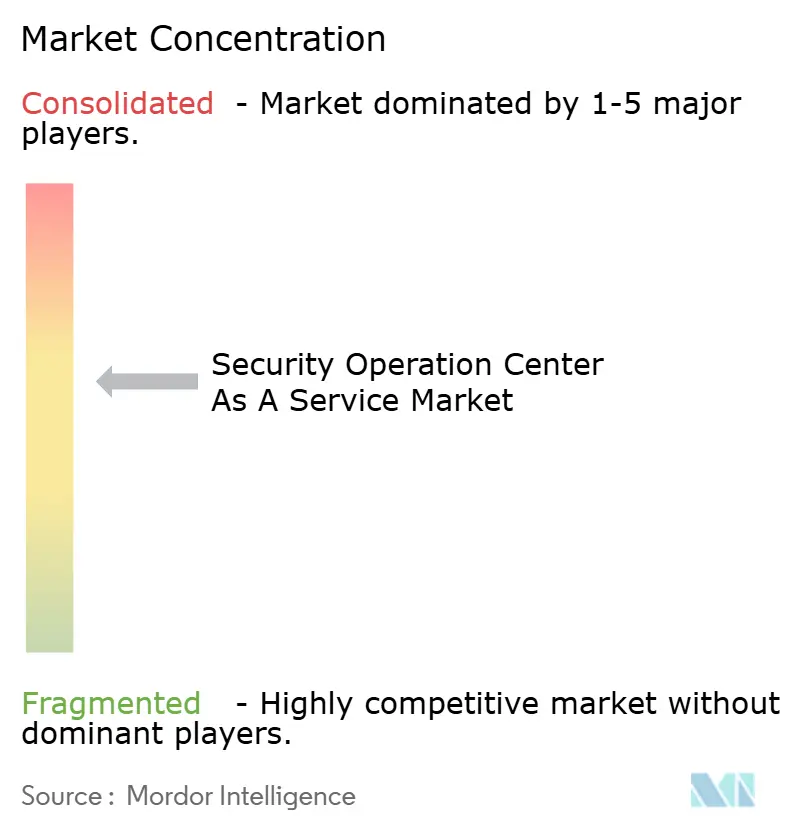
The top five providers hold an estimated 35-40% combined share, underscoring moderate fragmentation and leaving room for regional specialists and vertical-focused entrants. Incumbents such as SecureWorks, IBM Security, Arctic Wolf, AT&T Cybersecurity, and NTT pursue land-and-expand strategies, offering low-friction entry subscriptions that later upsell threat hunting and orchestration modules. Telecommunications carriers leverage connectivity contracts to cross-sell managed detection and response, bundling services with software-defined wide-area networks to deepen account stickiness.
Private-equity-backed roll-ups continue, acquiring regional managed security firms to gain local analyst talent and satisfy data-residency obligations. Artificial-intelligence-driven newcomers automate tier-one triage, lowering price points for small and medium enterprises and pressuring incumbents to match efficiency gains. Operational technology security remains a white-space opportunity where specialists like Dragos partner with generalist vendors to monitor supervisory control and data acquisition protocols.
Financial disclosures highlight the scale advantage of diversified technology vendors. IBM reported USD 2.8 billion in security-services revenue for 2025, enabling sustained investment in threat research.[3]IBM Corporation, “Form 10-Q for the Quarterly Period Ended September 30 2025,” SEC.GOV.
Security Operation Center As A Service Industry Leaders
SecureWorks Inc.
IBM Corporation
AT&T Inc.
Arctic Wolf Networks, Inc.
Trustwave Holdings, Inc.
- *Disclaimer: Major Players sorted in no particular order

Market Opportunities and Future Outlook
Compliance-linked demand is creating clear whitespace for SOCaaS offerings that operationalize reporting timelines, evidence preservation, and auditable response workflows across hybrid estates. Public procurement signals this shift: in 2026, the UK Financial Services Compensation Scheme issued a tender for an outsourced hybrid SOC requiring 24/7 MDR and DFIR, reinforcing demand for providers that can bundle continuous monitoring with forensics and incident response readiness. In parallel, data sovereignty and local oversight requirements (for example, Saudi Arabia's NCA licensing for MSOC services and residency-driven delivery patterns referenced across Europe and Asia) increase the value of in-region SOC footprints, sovereign cloud delivery options, and local partnerships.
Technology roadmaps centered on agentic AI and unified SOC consoles open opportunities to reduce integration burden and analyst workload while improving consistency of triage and response. Fortinet's June 2026 launch of FortiSOC, positioned as a unified cloud-delivered platform combining SIEM, SOAR, threat intelligence, and AI-driven correlation, illustrates vendor efforts to consolidate SOC workflows into fewer tools. Newer SOCaaS entrants and regional providers are also commercializing autonomous or AI-assisted SOC services for multi-cloud environments, widening choice for SMB and mid-market buyers that prioritize fast deployment and standardized playbooks. Across regulated sectors such as BFSI, healthcare, and critical infrastructure, providers that can demonstrate repeatable detection engineering, log retention controls, and forensic-ready processes are gaining a more defensible procurement position than monitoring-only services.
Recent Industry Developments
- July 2026: Bespin Global launched HelpNow AI SOC, an AI-based security operations center service built around autonomous agents for detection, analysis, and response across multi-cloud environments. The release highlights growing productization of SOCaaS in Asia with a focus on hybrid visibility and faster investigation cycles.
- June 2026: Fortinet announced the availability of FortiSOC, a cloud-delivered platform that unifies SIEM, SOAR, threat intelligence, and identity threat detection with agentic AI. By consolidating core SOC functions into a single console, the launch raises competitive pressure on MDR providers to differentiate through integrations, response workflows, and service depth.
- December 2025: Arctic Wolf acquired a European managed detection and response provider for USD 180 million to establish a Frankfurt security operations center aligned to NIS2 compliance needs. The deal strengthens in-region delivery and data residency posture for European customers while intensifying competition for local analyst talent.


Research Methodology Framework and Report Scope
Market Definition and Coverage
This market covers revenues earned from outsourced, subscription-based SOC capabilities that deliver continuous monitoring, alert triage, threat investigation, and guided response for customer environments, typically through cloud-enabled platforms and remote security teams.
Scope exclusions: one-off cybersecurity consulting, audits, and testing projects that do not include ongoing monitoring and incident handling are excluded.
Segmentation Overview
- By Enterprise Size
- Small and Medium Enterprises (SMEs)
- Large Enterprises
- By Service Type
- Managed Detection and Response (MDR)
- Incident Response and Threat Hunting
- Security Monitoring and Log Management
- Other Service Types
- By Deployment Model
- Public Cloud
- Private Cloud
- Hybrid Cloud
- By End-User Industry
- BFSI
- IT and Telecom
- Healthcare and Life Sciences
- Manufacturing
- Government and Public Sector
- Retail and E-Commerce
- By Geography
- North America
- United States
- Canada
- Mexico
- Europe
- Germany
- United Kingdom
- France
- Italy
- Spain
- Russia
- Rest of Europe
- Asia Pacific
- China
- Japan
- India
- South Korea
- ASEAN
- Australia and New Zealand
- Rest of Asia Pacific
- South America
- Brazil
- Argentina
- Rest of South America
- Middle East
- Saudi Arabia
- UAE
- Turkey
- Rest of Middle East
- Africa
- South Africa
- Nigeria
- Rest of Africa
- North America
Data Sources, Market Sizing, and Validation
Desk Research
Desk research started with public anchors that explain the real demand pool for SOCaaS, rather than general cybersecurity budgets. We used sources such as the NIST Cybersecurity Framework, CISA advisories, MITRE ATT&CK updates, and public incident reporting summaries to track how detection and response expectations are shifting.
We also reviewed government and regulator material, including SEC cyber disclosure guidance, ENISA threat landscape publications, and public procurement portals, to identify adoption patterns and budget signals by geography. Company filings, earnings call notes, and investor presentations were then used to cross-check how managed detection and response, SIEM operations, and 24/7 monitoring are packaged and priced. Where needed, we referenced paid company financial databases and patent data to check supplier coverage and product direction. These desk sources are illustrative, and we reviewed additional public documents to collect, validate, and clarify assumptions.
Primary Interviews and Surveys
Primary work focused on validating what is actually being sold as SOCaaS, how contracts are scoped, and which pricing units are most common across customer sizes. We spoke with service providers, channel partners, and enterprise security leaders across APAC, EMEA, and the Americas, then used follow-up checks to close gaps around co-managed models, service-level expectations, and renewal behavior.
Distribution of primary research fieldwork respondents
| Company type | Respondent position | Region |
|---|---|---|
| Top tier: 29% | CXOs: 12% | APAC: 42% |
| Mid tier: 51% | Functional/Unit leaders: 39% | EMEA: 34% |
| Smaller Players: 20% | Managers: 49% | Americas: 24% |
Market-Sizing & Forecasting
Market sizing was built using a top-down approach where cybersecurity and managed security services demand is reconstructed through enterprise IT spending signals, security outsourcing penetration, and the share that maps to continuous SOC monitoring and response. Once the demand pool was formed, we stress-tested it with selective bottom-up approximations, such as sampled contract values by customer size, the typical number of seats or endpoints monitored, and service-provider revenue disclosures where available.
Key inputs used in the model include observed growth in security alert volumes, adoption of 24/7 monitoring requirements driven by audit cycles, the shift from on-prem SIEM operations toward managed detection and response subscriptions, average contract length and renewal cycles, and the regional mix based on enterprise footprint and cloud adoption. When a bottom-up datapoint was missing for a country or segment, we used proxy indicators such as enterprise count bands, cloud workload growth, and security staffing scarcity, then normalized assumptions through interview feedback.
Forecasting relied on scenario analysis supported by trend checks on security incident intensity, regulation-driven compliance activity, and expected price progression for monitoring and response bundles. The final forecast was then adjusted where expert consensus indicated slower ramp in certain regulated sectors, or faster uptake where in-house SOC hiring is consistently constrained.
Data Validation & Update Cycle
Model outputs are checked against independent market signals, including managed security services growth, SOC analyst hiring trends, and published cyber incident frequency patterns, then variances are investigated before sign-off. If a region or year shows a sharp jump, we re-check currency timing, contract scope boundaries, and whether co-managed services were counted consistently.
Results go through multi-step analyst review, including peer checks on assumptions, sensitivity testing on pricing and penetration, and consistency checks across regions. Reports are refreshed annually, and interim updates are triggered when material events occur, such as major regulatory shifts, step-changes in breach activity, or a clear change in SOCaaS packaging. Before delivery, a fresh verification pass is completed so clients receive the most up-to-date view.
Mordor Intelligence's Security Operation Center As A Service Market Size Measured Against Other Published Estimates
Published numbers for SOCaaS can look far apart because the boundary between SOCaaS, broader managed security services, and adjacent tools is not drawn the same way, and because base years and currency timing also vary. Differences in what is treated as fully managed versus co-managed service, along with how provider revenues are allocated across regions, can also shift the total.
By tracking contract scope units such as monitored endpoints and log volume, and then refreshing shared assumptions with primary checks, Mordor Intelligence keeps SOCaaS revenue limited to continuous monitoring and incident response delivery rather than bundling stand-alone consulting or general cybersecurity outsourcing. Some studies start from older base-year values and then apply aggressive CAGR ranges, while others include wider categories like MDR platforms or general managed services, which can inflate totals. Pricing progression methods also differ, since some models assume a straight-line ASP increase, while our approach uses renewal cycles and service-level mix to adjust price movement more realistically.
Benchmark comparison
| Source | Market Size | Gaps in Research Methodology |
|---|---|---|
| Mordor Intelligence | USD 14.77 B (2026) | |
| Global Consultancy A | USD 8.42 B (2025) | Uses an earlier base year and a longer horizon, and the scope description is broad enough that it can capture platform-led security operations and adjacent managed security revenue that is not always tied to 24/7 SOC service delivery. |
| Industry Research Group B | USD 7.42 B (2024) | Starts from a smaller base year and applies growth from a different window, and the segmentation language mixes prevention and detection service bundles with SOCaaS, which can shift what is counted as SOC operations versus general security services. |
The spread in the table mainly comes from year selection, what is counted as SOC operations versus adjacent managed security bundles, and how pricing is moved forward through renewals. When the market is tied back to clear operating units and verified scope rules, the result is a more repeatable total that can be reconciled across regions and customer sizes.


Key Questions Answered in the Report
How large is the security operation center as a service market in 2026?
The market reached USD 14.77 billion in 2026, reflecting widespread migration from in-house monitoring to managed detection and response subscriptions.
What is the expected growth rate for the security operation center as a service market to 2031?
The sector is forecast to expand at a 12.77% CAGR, lifting total value to USD 26.93 billion by 2031.
Which deployment model is growing fastest?
Hybrid cloud implementations are registering a 14.28% CAGR because they satisfy latency and data-residency requirements while delivering cloud-scale analytics.
Why is healthcare adopting outsourced security operations so rapidly?
Ransomware attacks on electronic health records and connected medical devices are rising, pushing healthcare organizations to seek 24/7 managed detection and response coverage that internal teams cannot sustain.
How do data-sovereignty laws influence provider selection?
Regulations in the European Union, India, and China require local log processing, favoring vendors with in-country security operations centers or regional partnerships.
What differentiates incident response and threat hunting from basic managed detection?
Proactive threat hunting involves hypothesis-driven searches for hidden adversaries, while incident response retainers provide expert containment and forensics; both services command higher pricing but reduce breach costs.
Page last updated on:






