
Managed Security Services Market Size and Share
Market Overview
| Study Period | 2020 - 2031 |
|---|---|
| Market Size (2026) | USD 43.03 Billion |
| Market Size (2031) | USD 76.96 Billion |
| Growth Rate (2026 - 2031) | 12.33 % |
| Fastest Growing Market | Asia Pacific |
| Largest Market | North America |
| Market Concentration | Medium |
Major Players *Disclaimer: Major Players sorted in no particular order Image © Mordor Intelligence. Reuse requires attribution under CC BY 4.0. | |
Managed Security Services Market Analysis by Mordor Intelligence
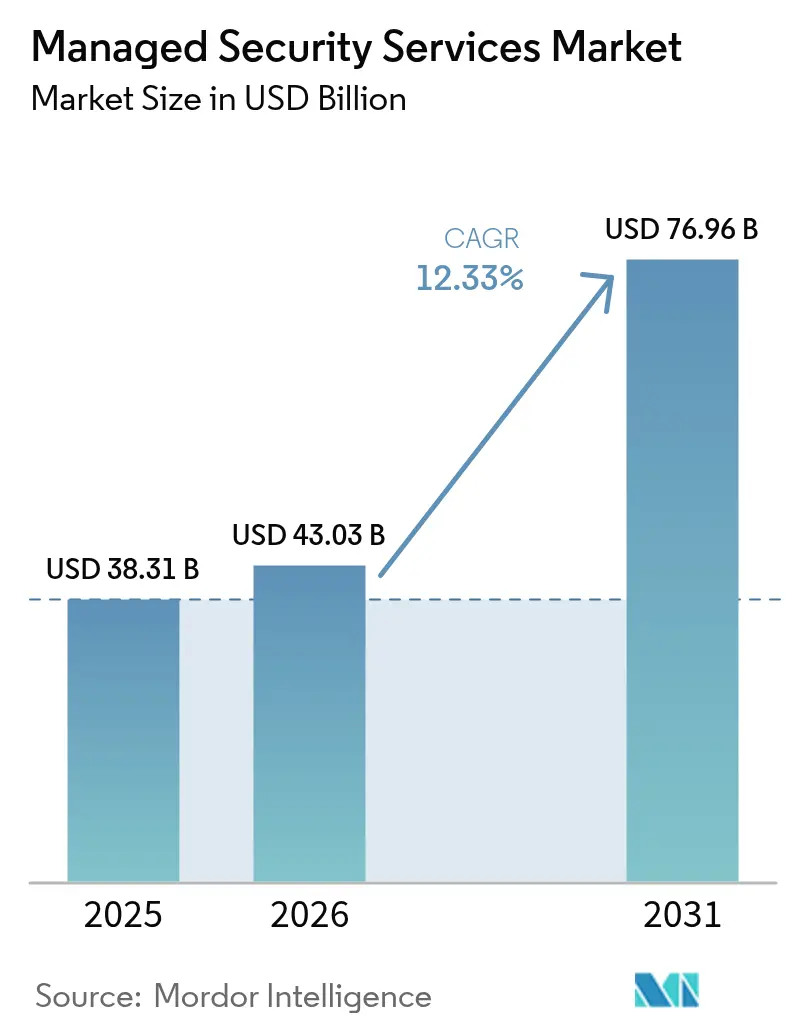
The Managed Security Services Market size is projected to expand from USD 38.31 billion in 2025 and USD 43.03 billion in 2026 to USD 76.96 billion by 2031, registering a CAGR of 12.33% between 2026 to 2031.
Heightened regulatory pressure, notably the European Union’s DORA and NIS2 directives, drives enterprises to embed security controls at the design stage rather than bolting them on later. Organizations are moving from reactive defenses to AI-enabled, predictive threat detection that scales across hybrid environments. Accelerated cloud migration, widening multi-cloud attack surfaces and an intensifying cyber-talent shortage further enlarge outsourcing demand. Competition is intensifying as cloud hyperscalers integrate security analytics into their platforms, forcing traditional providers to differentiate through vertical expertise and unified security architectures. Consolidation continues, with 2024’s USD 859 million Sophos-Secureworks deal showing providers’ urgency to acquire advanced analytics capabilities.
Key Report Takeaways
- By deployment model, cloud-based services led with 71.92% of managed security services market share in 2025; on-premises lags while cloud is growing at a 14.42% CAGR through 2031.
- By service type, Managed Detection and Response captured 27.05% of the managed security services market (MSSP) size in 2025 and is expanding at a 12.72% CAGR.
- By provider type, Security-Specialist MSSPs held 32.10% revenue share in 2025, whereas Cloud Hyperscaler MSSPs post the highest 13.98% CAGR to 2031.
- By end-user industry, BFSI led with 24.40% of the managed security services market share in 2025; healthcare is advancing fastest at a 13.22% CAGR.
- By geography, North America commanded 29.05% revenue share in 2025; Asia-Pacific is registering the highest 12.95% CAGR toward 2031.
Note: Market size and forecast figures in this report are generated using Mordor Intelligence’s proprietary estimation framework, updated with the latest available data and insights as of 2026.
Market Trends and Insights
Drivers Impact Analysis of Managed Security Services Market*
| Driver | (~) % Impact on CAGR Forecast | Geographic Relevance | Impact Timeline |
|---|---|---|---|
| AI-led SOC automation and XDR adoption surge | +2.1% | Global, with North America and EU leading | Medium term (2-4 years) |
| Escalating multi-cloud attack surface | +1.8% | Global, concentrated in Asia-Pacific and North America | Short term (≤ 2 years) |
| Compliance-by-design mandates (DORA, NIS2, SEC) | +2.3% | EU primary, North America secondary | Short term (≤ 2 years) |
| Cost and talent crunch pushing co-managed MSS | +1.9% | Global, acute in Asia-Pacific and MEA | Medium term (2-4 years) |
| Rise of usage-based pricing and MDR bundling | +1.2% | North America and EU core, expanding globally | Long term (≥ 4 years) |
| Quantum-resistant encryption urgency | +0.9% | Global, government and BFSI priority | Long term (≥ 4 years) |
| Source: Mordor Intelligence | |||
AI-led SOC automation and XDR adoption surge
Organizations are embedding artificial intelligence into security operations centers to shorten detection and response cycles and limit analyst fatigue. Microsoft’s Security Copilot integrated with Defender XDR cuts mean time to respond by 40% and slashes false positives by 60%, showcasing how generative AI speeds triage and improves fidelity. Palo Alto Networks’ Cortex XSIAM already processes 1 trillion daily events to surface hidden attack paths, enabling MSSPs to deliver outcome-based SLAs that justify premium pricing.[1]The approach also mitigates talent shortages, allowing 24/7 monitoring with smaller analyst teams. As AI-native competitors proliferate, traditional providers risk margin compression unless they embed autonomous investigation and response at scale. Over the medium term, successful MSSPs will fuse AI models with proprietary threat intelligence to anticipate attacks before initial compromise.
Escalating multi-cloud attack surface
Wide adoption of AWS, Azure and Google Cloud creates fragmented visibility, leaving security gaps that hackers exploit. CrowdStrike recorded a 75% year-over-year rise in cloud intrusions during 2024, driven by misconfigurations and over-privileged identities. Enterprises now juggle 3.2 security integrations per cloud, compounding alert noise. Google Cloud’s SecOps platform crunches 400 billion signals each day, illustrating the analytic horsepower needed to filter genuine threats.[2] MSSPs able to ingest telemetry from multiple clouds into a single analytics fabric gain share by simplifying operations and cutting tool overheads. In the short term, demand for cloud-native threat monitoring outpaces supply of qualified experts, fueling double-digit growth across the managed security services (MSSP) market.
Compliance-by-design mandates (DORA, NIS2, SEC)
Regulators now expect continuous monitoring and real-time breach notification. From January 2025, DORA enforces strict ICT risk controls across EU financial entities, with penalties up to 2% of global turnover. SEC rules oblige US-listed firms to disclose material cyber incidents within 4 business days, elevating board-level focus on breach preparedness. NIS2 widens scope to 18 critical sectors, introducing fines of EUR 10 million or more for lapses. MSSPs that deliver automated compliance dashboards and regulatory-ready reports command higher margins while reducing enterprise audit overhead. Over the next two years, compliance-by-design thinking influences every new security architecture decision, intensifying subscription renewals across the managed security services market.
Cost and talent crunch pushing co-managed MSS
An 18-month vacancy for senior cyber roles and 23% annual inflation in tool licensing costs are unsustainable for many CISOs. Co-managed arrangements let enterprises keep strategic oversight while outsourcing deep-dive threat hunting, vulnerability scanning and incident response. N-able research shows clients on co-managed contracts improve mean-time-to-detect by 34% and cut security incidents by 42%. Mid-market organizations adopt the model fastest as it balances trust and budget. Across APAC and MEA, shortages of certified analysts are acute, so providers offering flexible staffing and shared governance frameworks are winning multi-year deals. Over the medium term the co-managed archetype becomes the entry point for customers hesitant to relinquish full control.
Restraints Impact Analysis of Managed Security Services Market*
| Restraint | (~) % Impact on CAGR Forecast | Geographic Relevance | Impact Timeline |
|---|---|---|---|
| Persistent trust deficit in data-sovereignty | -1.4% | EU and Asia-Pacific primary, regulatory driven | Medium term (2-4 years) |
| Tool sprawl and integration complexity | -1.1% | Global, acute in large enterprises | Short term (≤ 2 years) |
| Escalating liability exposure for MSSPs | -0.8% | North America and EU, insurance driven | Long term (≥ 4 years) |
| Short supply of OT-security specialists | -0.9% | Global, critical in manufacturing and energy | Medium term (2-4 years) |
| Source: Mordor Intelligence | |||
Persistent trust deficit in data-sovereignty
European clients balk at shipping telemetry to SOCs outside EU borders even when providers boast GDPR clauses. India, China and Brazil enforce localization statutes that fragment global delivery models, raising provider overheads. The 2025 Marks & Spencer breach, traced back to a third-party vendor, cost EUR 300 million in lost sales and amplified concerns over extended supply chains.[3] To win contracts, MSSPs add domestic SOC footprints and guarantee residency for sensitive logs, but duplicating infrastructure erodes margins. Over the next three years, data-sovereignty constraints temper growth in heavily regulated verticals even as demand rises.
Tool sprawl and integration complexity
Enterprises run 45-60 disparate tools, creating alert fatigue and integration gaps that adversaries exploit. Kaspersky finds manufacturers deploy 12 separate OT-security products, complicating patch cycles and elevating risk. When MSSPs overlay their own tech stack, they face expensive API customization. Inefficiencies delay detection and raise service costs, narrowing the provider’s profitability window. Until unified platforms mature, large-scale deployments will experience onboarding friction that slows managed security services market expansion.
*Our forecasts treat driver/restraint impacts as directional, not additive. The impact forecasts reflect baseline growth, mix effects, and variable interactions.
Managed Security Services Market Segment Analysis
By Deployment Model:
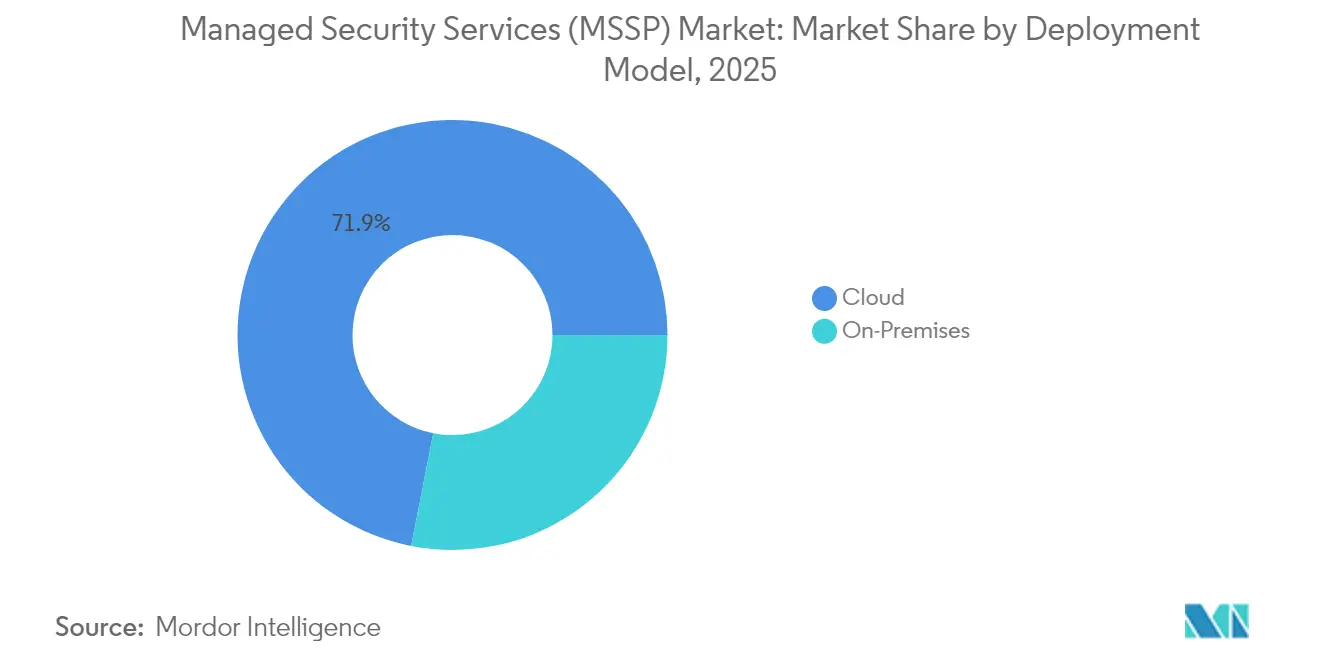
Cloud-Native Security DominatesCloud-based services accounted for 71.92% of the managed security services market in 2025 as enterprises re-platformed security controls alongside workloads. The segment is forecast to expand at a 14.42% CAGR through 2031, reflecting confidence in hyperscaler resilience and AI-infused analytics. Providers operate global PoPs that ingest logs at petabyte scale, then apply machine learning to spot lateral movement within minutes. Cost benefits compound adoption: CIOs report 45% lower total cost of ownership and 60% faster time-to-value compared with appliance-centric deployments. On-premises models persist in defense and highly classified environments where air-gap mandates override scalability concerns. Hybrid approaches emerge, with sensitive logs stored locally while non-classified telemetry streams to cloud SIEMs for aggregated analytics. The managed security services market size for cloud deployments is poised to widen its lead as 5G and edge compute push telemetry volumes higher. Meanwhile, providers redesign SLAs around latency and uptime guarantees to reassure regulated customers.
Second-generation cloud architectures emphasize API-level integration rather than lift-and-shift virtual appliances. Zscaler’s alliance with BT illustrates the model: BT funnels 400 billion daily sessions through Zscaler’s cloud to gain real-time risk scoring on every transaction. Such scale delivers threat intelligence inaccessible to siloed deployments, creating a feedback loop that continuously improves detection. Geopolitical tensions, however, force hyperscalers to build sovereign clouds, which may dilute centralization benefits. Nonetheless, with SaaS adoption in double digits, the managed security services (MSSP) market continues to pivot decisively toward cloud-first delivery.

By Service Type:
MDR Leads Threat Detection EvolutionManaged Detection and Response held 27.05% of the managed security services market share in 2025, posting a 12.72% CAGR as customers demand active containment rather than ticket-only monitoring. MDR fuses endpoint telemetry, network flow data and identity context to surface anomalous behavior. Providers couple 24/7 analyst eyes with automated response playbooks, isolating patient-zero hosts in seconds. Traditional firewall management faces commoditization, but remains necessary for compliance-driven perimeter controls. Identity-centric zero-trust services are rising, particularly among SaaS-heavy mid-size enterprises.
AI-enabled MDR platforms such as Red Canary’s Managed XSIAM harness log-correlation engines to cut dwell time and shrink breach impact. Increased pairing of MDR with vulnerability management supports continuous remediation loops. DDoS mitigation stays relevant for uptime assurance, while managed IAM services close privilege-escalation gaps. Overall, layered MDR bundles position providers as strategic partners, underpinning sticky three- to five-year contracts that swell the managed security services market size for outcome-focused offerings.
By Provider Type:
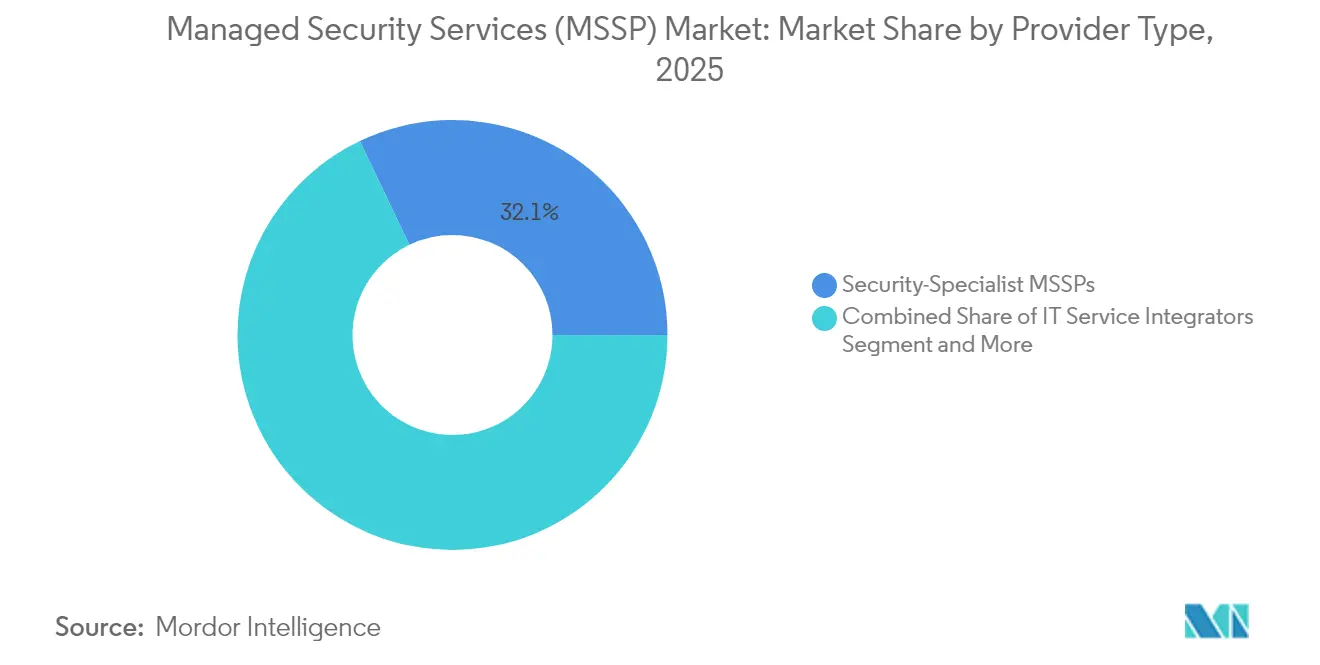
Specialists Face Hyperscaler ChallengeSecurity-specialist MSSPs captured 32.10% revenue in 2025 due to domain depth and curated threat feeds. Yet hyperscaler-aligned MSSPs are expanding at 13.98% CAGR, fueled by native telemetry access and AI tooling embedded in cloud consoles. Enterprises migrating workloads to public clouds view single-pane-of-glass security appealing, eroding loyalty to standalone providers. IT integrators and telecom carriers pivot by bundling secure connectivity with SOC services, chasing margin in value-added analytics rather than bandwidth.
AT&T Dynamic Defense merges network edge data with Palo Alto’s threat engine to differentiate on end-to-end visibility. Consulting-led cyber practices focus on governance, risk and compliance where advisory margins remain robust. Ongoing M&A USD 45.7 billion in 2024 accelerates convergence, prompting mid-tier players to form alliances or risk irrelevance. As hyperscalers emphasize turnkey security, specialists double down on vertical niches like OT or crypto-agility, sustaining diversity within the managed security services market.
By End-User Industry:
Healthcare Accelerates Past BFSIBFSI retained top spot with 24.40% share of the managed security services market in 2025, but growth is flattening relative to earlier years. Stringent DORA and SEC rules keep spending elevated, yet banks have matured SOC practices and negotiate aggressively on price. Healthcare, posting a 13.22% CAGR, now drives incremental expansion. Digitization of clinical workflows, proliferation of IoT medical devices and tighter privacy statutes push hospitals toward outsourced monitoring. BestSelf Behavioral Health’s adoption of 24/7 managed SOC exemplifies how providers mitigate patient data exposure while tapping MSSP regulatory playbooks. Government and defense entities value air-gapped SOCs, while manufacturing grapples with OT asset visibility gaps. Retail and eCommerce depend on card-holder data security and bot-defense, but seasonality shapes procurement cycles. Energy utilities prioritize NERC CIP and IEC 62443 adherence, demanding engineers conversant with SCADA protocols. These vertical nuances encourage MSSPs to spin industry-specific service lines, deepening segmentation across the managed security services market.
Geography Analysis
North America Managed Security Services Market
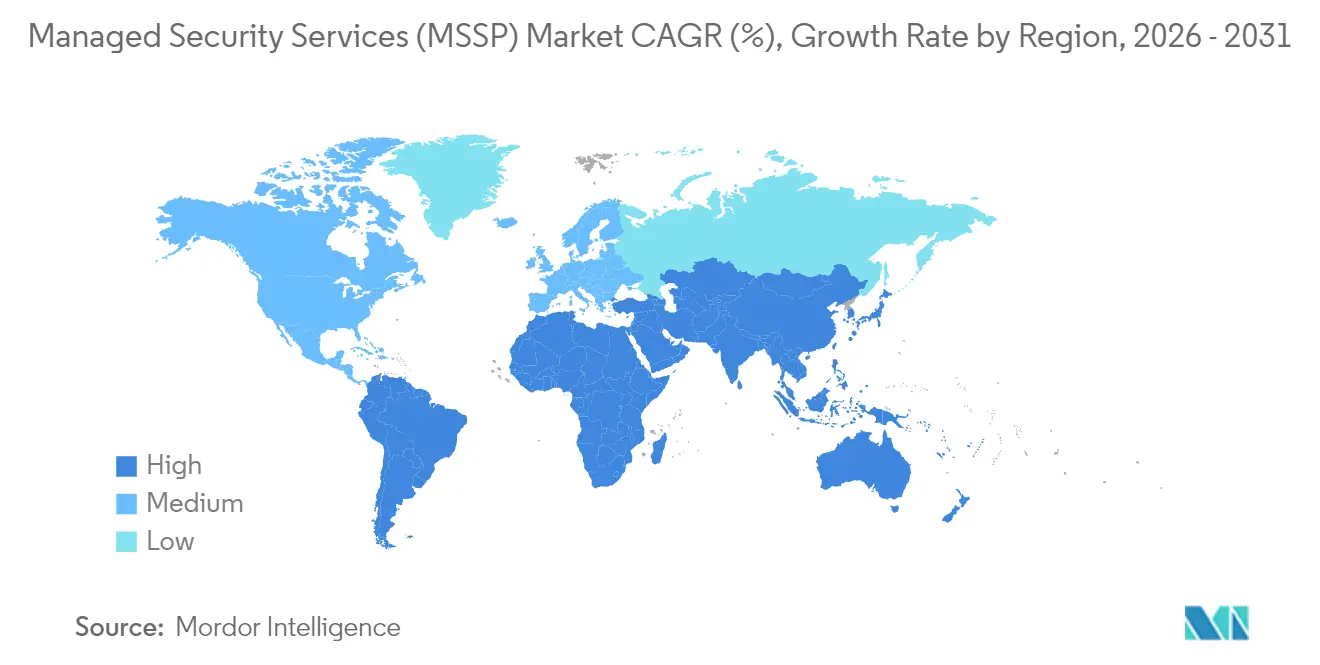
North America held 29.05% of global revenue in 2025, buoyed by stringent SEC disclosure rules and ready access to venture funding that fuels security innovation. US firms lead adoption of AI-driven SOCs and quantum-resistant pilots, whereas Canadian utilities focus on critical-infrastructure hardening aligned with C-SCRM guidance. Mexico’s automotive corridor embraces co-managed SOCs to offset talent deficits. Despite saturation at large enterprises, mid-market penetration remains underscored by ransomware’s financial impact, sustaining double-digit spend.
APAC Managed Security Services Market
Asia-Pacific is growing fastest at 12.95% CAGR through 2031. Japan’s manufacturers fortify OT assets after multiple supply-chain breaches; China emphasizes domestically developed SOC platforms under data-localization mandates; India’s small and mid-size firms outsource log monitoring to bridge skills shortfalls. ASEAN banks face digital-payments fraud surges, prodding regulators to raise breach-reporting fines that boost managed security services market demand. South Korea pioneers 5G-edge protection frameworks, positioning local MSSPs as exporters of MEC-centric threat analytics.
Europe Managed Security Services Market
Europe advances steadily due to DORA and NIS2. Germany invests in industrial-control defenses, the UK emphasizes financial-sector resilience post-Brexit, and France nurtures sovereign-cloud SOCs. Mediterranean SMEs turn to MDR subscriptions to meet insurance prerequisites. Data-residency stipulations favor regional SOC buildouts, compelling global providers to partner with domestic data-center operators. Collectively, regulatory harmonization and funding initiatives anchor a compliance-driven managed security services (MSSP) market across the continent.
Regulatory Landscape
Managed security services demand is being shaped by faster, more prescriptive cyber-resilience obligations that require continuous monitoring, evidence capture, and rapid incident reporting. In the European Union, DORA has applied since January 17, 2025 for financial entities, pushing ICT risk controls and operational-resilience testing into day-to-day security operations, while NIS2 expands accountability across 18 critical sectors and brings managed service providers and MSSPs into scope with heightened governance and enforcement expectations.
Policy and assurance frameworks are also moving from guidance to certification and harmonization. In January 2026, the European Commission issued COM(2026) 9 alongside a proposal often referred to as the Cybersecurity Act 2 (2026/PC0011), initiating updates to the European Cybersecurity Certification Framework; ENISA further advanced the EU Managed Security Services (MSS) Certification Scheme at its April 2026 Certification Conference, building on the amended Regulation (EU) 2025/37. In the United States, March 2026 policy direction in the Cyber Strategy for America emphasizes streamlining requirements and accelerating zero-trust adoption in federal environments, reinforcing procurement-driven security controls that flow into MSSP contracts and compliance reporting practices.
Competitive Landscape
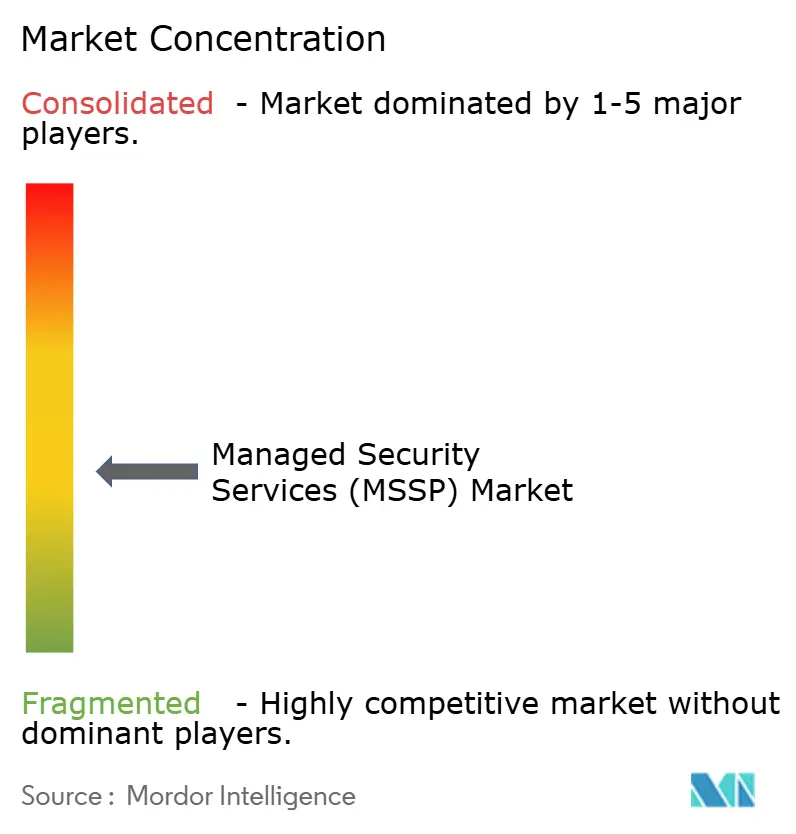
The market remains moderately fragmented as no single provider exceeds one-third of revenue. Security specialists, hyperscaler affiliates, telecom carriers and consulting practices jostle for wallet share. AI-first entrants tout faster MTTR, flooding prospects with benchmark statistics; incumbents respond by integrating XDR stacks and automating playbooks. Strategic alliances surge: Verizon pairs with Accenture for identity services, Kyndryl teams with Microsoft for data-security-posture management. Platform convergence underpins USD 45.7 billion of 2024 M&A, epitomized by Sophos acquiring Secureworks to couple endpoint and network telemetry.
White-space opportunities emerge around OT visibility, quantum-safe crypto migration and usage-based billing. Providers capturing unique telemetry—mobile networks, satellite links or industrial sensors—differentiate through proprietary threat intelligence. Still, liability exposure and insurance constraints deter smaller entrants. Over 2025-2028, expect more roll-ups as mid-cap MSSPs seek capital to fund sovereign SOC footprints required by local regulators. Competition, however, also broadens: cloud hyperscalers embed zero-trust and SIEM in subscription bundles, challenging independent SOC providers to justify incremental value.
Managed Security Services Industry Leaders
-
AT&T Inc.
-
Secureworks Corp.
-
Broadcom Inc.
-
Trustwave Holdings, Inc. (the Chertoff Group)
-
Fortra, Llc
- *Disclaimer: Major Players sorted in no particular order
Managed Security Services Market Companies Covered in this Report
- AT&T
- IBM
- Secureworks
- Verizon
- Broadcom (Symantec)
- Atos
- Lumen Technologies
- BAE Systems
- Capgemini
- Fujitsu
- Wipro
- Trustwave
- Fortra
- Deloitte
- NTT
- Accenture
- Palo Alto Networks
- BT Group
- Orange Cyberdefense
- Kyndryl
Market Opportunities and Future Outlook
Compliance-as-a-Service and evidence-ready managed operations represent a clear whitespace as regulators broaden who must report incidents and how quickly they must do so. EU NIS2 implementation and the associated implementing requirements around supply-chain and vulnerability handling, alongside US rulemaking momentum under CIRCIA for covered entities with federal exposure, are elevating demand for managed workflows that generate audit trails, vendor-risk artifacts, and regulator-ready incident documentation. This is reinforced by the market shift toward cloud delivery (cloud-based services held 71.92% share in 2025), where centralized telemetry, retention policies, and standardized reporting can be packaged into repeatable managed offerings.
Another opportunity is the commercialization of AI-enabled, platform-led SOC operations that compress triage and investigation time for under-resourced teams, aligning with MDR being the largest service line by share (27.05% in 2025). In 2026, buyers received concrete options across the stack: EY selected the CrowdStrike Falcon platform with NVIDIA AI infrastructure to power agentic SOC services, Grant Thornton Advisors standardized MSSP operations on CrowdStrike Falcon Complete, and Telefonica launched a managed cybersecurity solution for the mid-market in Spain incorporating CrowdStrike and its SOC capabilities. Partnerships that bundle secure access with managed operations are also expanding, such as Deloitte and Netskope broadening managed SASE delivery in EMEA, pointing to a growing managed layer around SASE, identity, and cloud controls where customers want one operational owner across policy, detection, and response.
Recent Industry Developments in Managed Security Services Market
- May 2026: AT&T expanded availability of AT&T Dynamic Defense to small and medium-sized business customers using AT&T Business Fiber, extending network-embedded cybersecurity beyond large enterprises. The move broadens the addressable mid-market for telecom-led MSSPs by packaging prevention and response capabilities with connectivity procurement and simplified onboarding.
- February 2025: Sophos completed its all-cash acquisition of Secureworks, consolidating MDR/XDR capabilities and bringing additional SOC scale and platform depth into Sophos-managed services. The transaction heightened competitive pressure on standalone MSSPs by combining endpoint, network, and managed detection operations under a single vendor portfolio.
- October 2024: Sophos announced its plan to acquire Secureworks to accelerate cybersecurity services and expand MDR offerings using Secureworks Taegis capabilities. The announcement signaled continued consolidation in managed security operations as providers pursue platform convergence and broader telemetry coverage to support unified detection and response.
Managed Security Services Market Report Scope and Research Methodology
Market Definition and Coverage
This market covers outsourced, recurring services where a provider continuously monitors, manages, and responds to cybersecurity risks for an organization, delivered through managed platforms and service teams, and billed as ongoing contracts in USD.
Scope exclusions: one-time hardware resale and pure product-only licensing are excluded unless they are bundled and priced as part of a managed service contract.
Segments Covered in This Report
- By Deployment Model
- On-Premise
- Cloud
- By Service Type
- Managed Detection and Response (MDR)
- Firewall and UTM Management
- Intrusion Detection/Prevention
- Managed IAM and Zero-Trust
- DDoS and Threat Prevention
- Vulnerability and Patch Management
- Others
- By Provider Type
- IT Service Integrators
- Security-Specialist MSSPs
- Telecom-Led MSSPs
- Cloud Hyperscaler MSSPs
- Consulting-Led Cyber Practices
- By End-user Industry
- BFSI
- Government and Defense
- Healthcare and Life Sciences
- Manufacturing and Industrial
- Retail and eCommerce
- IT and Telecom
- Energy and Utilities
- Geography
- North America
- United States
- Canada
- Mexico
- South America
- Brazil
- Argentina
- Rest of South America
- Europe
- Germany
- United Kingdom
- France
- Italy
- Spain
- Rest of Europe
- Asia-Pacific
- China
- Japan
- India
- South Korea
- Southeast Asia
- Rest of Asia-Pacific
- Middle East and Africa
- Middle East
- Saudi Arabia
- United Arab Emirates
- Turkey
- Rest of Middle East
- Africa
- South Africa
- Nigeria
- Egypt
- Rest of Africa
- Middle East
- North America
Data Sources, Market Sizing, and Validation
Desk Research
Desk work was used to map the demand and supply context before we modeled revenues. We relied on public and official references such as NIST publications, CISA advisories, FCC security-related releases, OECD digital economy indicators, and ITU cybersecurity statistics to align on terminology and adoption signals.
We also reviewed company annual reports, 10-K style filings, investor decks, reputable press, and association websites to understand how managed services are packaged (SOC monitoring, managed firewall, managed endpoint, managed IAM, and related bundles) and how contract pricing is moving. For cross-checking provider footprint and growth signals, we used paid subscriptions focused on company financials and intelligence, plus a patent database to spot where service capabilities are being built out. The sources listed here are illustrative only, and many other public references were used for data collection, validation, and clarification.
Primary Interviews and Surveys
Primary calls and surveys were used to validate the revenue logic behind managed security contracts and to close gaps left by public data. We spoke with service providers, channel partners, and enterprise buyers across major regions so assumptions on service attach rates, contract length, renewal behavior, and the cloud versus on-premise mix could be checked and adjusted before finalization.
Distribution of primary research fieldwork respondents
| Company type | Respondent position | Region |
|---|---|---|
| Top tier: 31% | CXOs: 14% | APAC: 45% |
| Mid tier: 52% | Functional/Unit leaders: 27% | EMEA: 31% |
| Smaller Players: 17% | Managers: 59% | Americas: 24% |
Market-Sizing & Forecasting
Sizing was built using a top-down and bottom-up approach, but the main spine is top-down. In practice, overall spend on security services was reconstructed by geography, then filtered using managed service penetration, cloud adoption mix, and the share of security operations that gets outsourced.
Once that envelope was set, it was corroborated through selective bottom-up approximations such as sampled provider revenue splits, channel checks for managed bundles, and an ASP times volume logic for common services like managed SIEM, managed firewall, and managed endpoint. Where provider disclosures were not clean, revenue was bridged using service headcount proxies, regional delivery mix, and typical contract values gathered in interviews, and then normalized to avoid double counting across partner-led delivery.
For forecasting, we mainly used scenario analysis supported by a light multivariate regression check, because demand moves with several drivers at the same time. Inputs we track include reported breach frequency and severity, regulatory compliance pressure in regulated industries, cloud workload migration rates, security talent shortage signals, and average contract duration and renewal rates, which together help explain why spending accelerates or slows.
Data Validation & Update Cycle
Validation was done through repeated cross-checks before sign-off, so the numbers do not depend on one assumption. Model outputs were compared against independent signals such as enterprise security spending direction, provider growth commentary, hiring trends in security operations, and regional cloud migration indicators.
Outliers were investigated, and if a variance could not be explained by scope or timing, assumptions were revisited. Where needed, primary respondents were re-contacted to confirm the change. Reports are refreshed annually, with interim updates when material events impact pricing, service packaging, or demand, and a final pre-delivery review is completed so clients receive the most current view.
Mordor Intelligence's Security Managed Services Market Size Versus Other Published Estimates
Published market sizes for security managed services can look different even when they use similar labels, because the service basket and revenue recognition rules are not always aligned. Differences usually come from what is counted as a managed contract versus adjacent professional services, plus how cloud security bundles and partner-delivered services are treated.
Some estimates fold in broader cybersecurity services, including one-time consulting and incident projects that do not recur like managed monitoring. In Mordor Intelligence's model, only recurring managed security service revenues are counted, and bundled product components are included only when they are priced inside an ongoing managed contract and validated through provider and buyer checks.
Benchmark comparison
| Source | Market Size | Gaps in Research Methodology |
|---|---|---|
| Mordor Intelligence | USD 38.31 B (2025) | |
| Industry Publisher A | USD 38.42 B (2025) | Uses a broader service taxonomy that can include hybrid delivery and adjacent security operations activities under managed labels, which can shift what is treated as managed revenue versus bundled tooling. |
| Industry Publisher B | USD 36.22 B (2024) | Different base year and price timing, plus a faster growth framing that may assume quicker outsourcing adoption and higher contract value uplift, which can compress the implied starting point. |
The spread in the table is mainly explained by scope edges, year selection, and how recurring contract value is separated from project work and product resale. By keeping the demand pool tied to managed contract revenues and then checking it against real-world renewal and mix inputs, the final number stays transparent and repeatable.
Key Questions Answered in the Report
What is the global managed security services market size in 2026?
The market is valued at USD 43.03 billion in 2026.
Which deployment model currently commands the largest share of the managed security services market?
Cloud-based delivery leads with a 71.92% share as of 2025.
Which geographic region is expected to grow fastest in managed security services?
Asia-Pacific is forecast to grow at a 12.95% CAGR through 2031.
What new regulation is accelerating managed security services adoption in Europe?
The Digital Operational Resilience Act (DORA) requires continuous ICT risk management for financial entities starting January 2025.