
Security Assessment Market Size and Share
Market Overview
| Study Period | 2020 - 2031 |
|---|---|
| Market Size (2026) | USD 5.15 Billion |
| Market Size (2031) | USD 6.83 Billion |
| Growth Rate (2026 - 2031) | 5.78 % |
| Fastest Growing Market | Asia Pacific |
| Largest Market | North America |
| Market Concentration | Low |
Major Players *Disclaimer: Major Players sorted in no particular order Image © Mordor Intelligence. Reuse requires attribution under CC BY 4.0. | |
Security Assessment Market Analysis by Mordor Intelligence
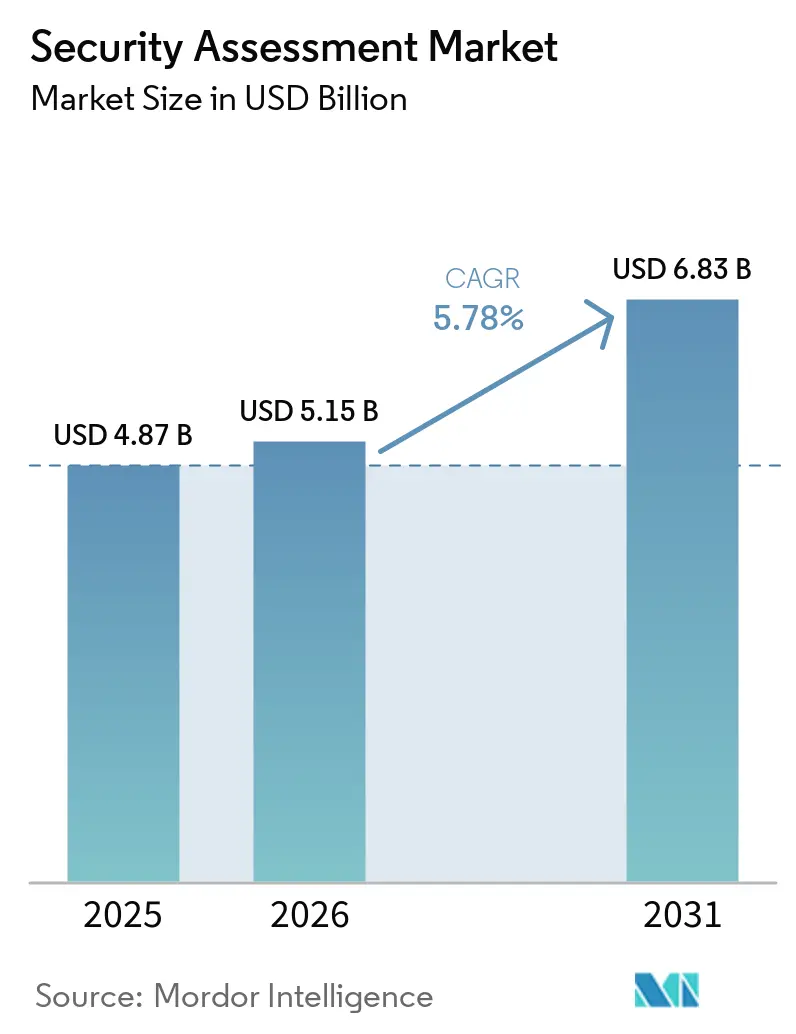
The security assessment market size is expected to grow from USD 4.87 billion in 2025 to USD 5.15 billion in 2026 and is forecast to reach USD 6.83 billion by 2031 at 5.78% CAGR over 2026-2031. Wider adoption stems from enterprises validating cyber-posture against ever-richer attack techniques and expanding regulatory rules. Automated, AI-enabled testing trims assessment cycle times and raises detection accuracy, prompting firms to shift from annual audits to continuous validation. Demand also benefits from cloud migration, DevSecOps integration, and a need to secure hybrid work architectures that blur traditional perimeter controls.
Key Report Takeaways
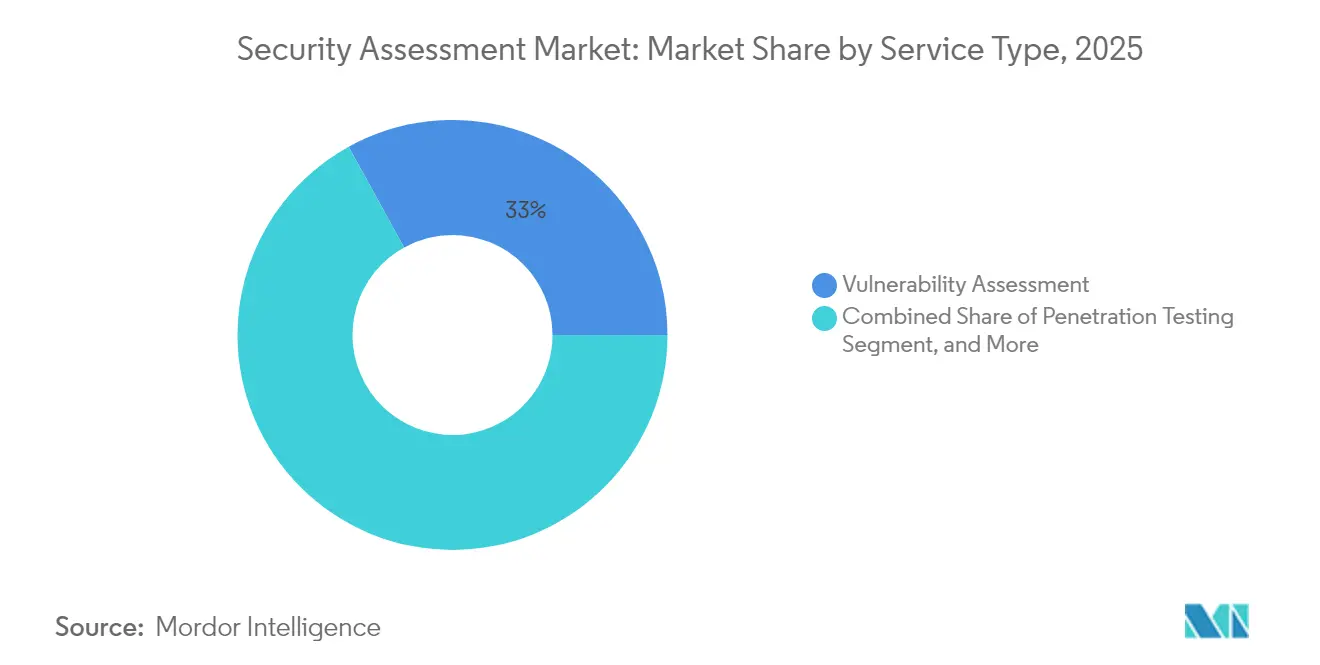
- By service type, vulnerability assessment captured 33.02% of the security assessment market share in 2025; PTaaS is forecast to expand at a 7.18% CAGR through 2031.
- By deployment model, on-premise retained 51.65% share of the security assessment market size in 2025, whereas cloud-based solutions will post an 7.97% CAGR to 2031.
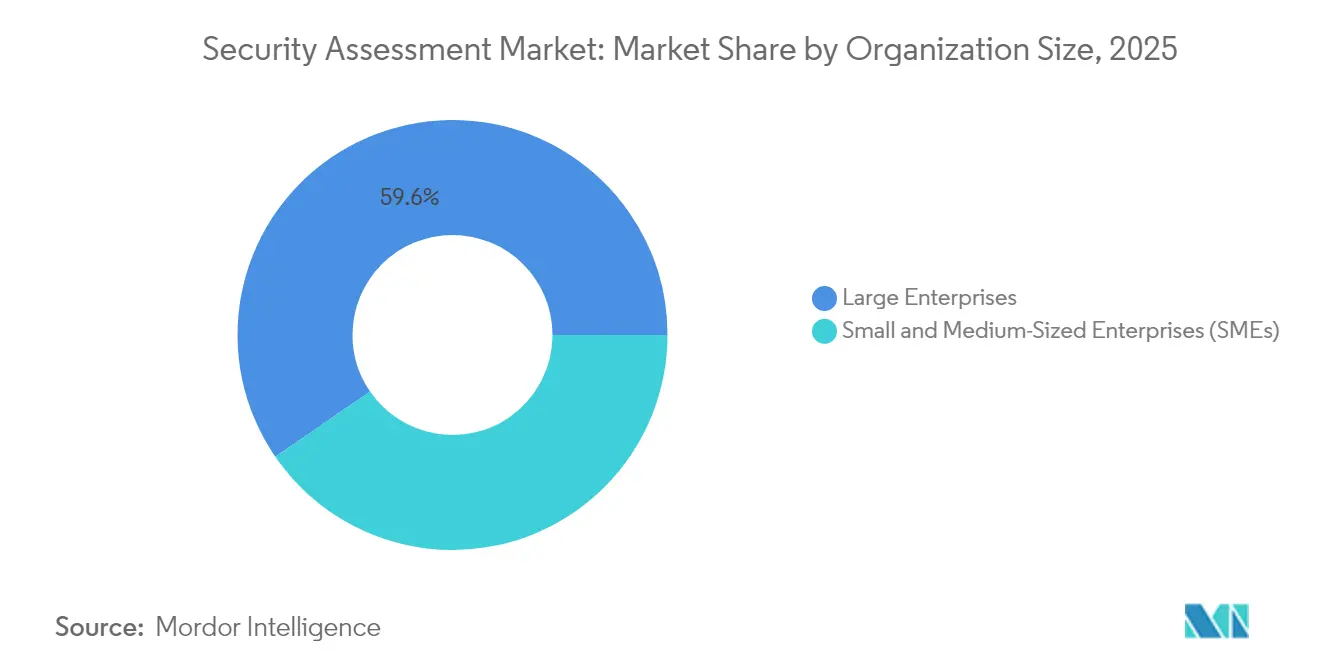
- By organization size, large enterprises commanded 59.58% revenue in 2025; SMEs register the highest expected CAGR at 6.63% for 2026-2031.
- By end-user industry, BFSI led with 27.85% revenue in 2025, while Healthcare and Life Sciences will record the fastest 5.92% CAGR through 2031.
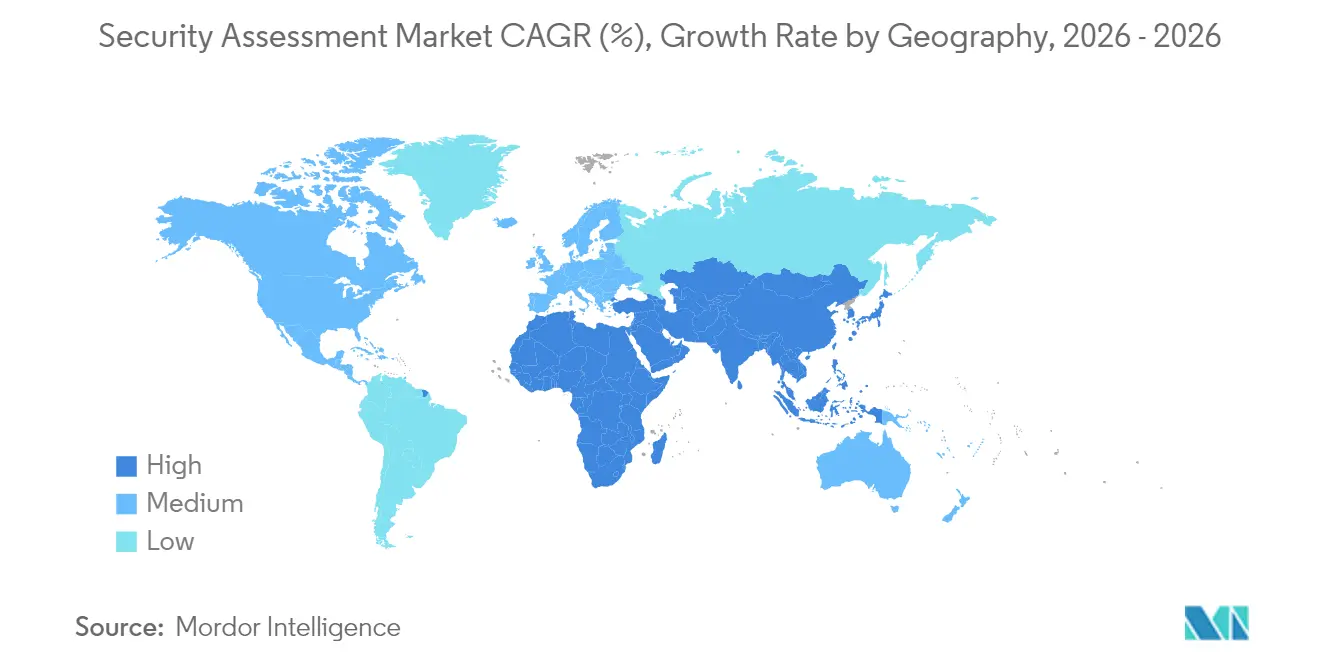
- By geography, North America contributed 40.88% revenue in 2025; Asia-Pacific is the fastest-expanding region with an 8.27% CAGR to 2031.
Note: Market size and forecast figures in this report are generated using Mordor Intelligence’s proprietary estimation framework, updated with the latest available data and insights as of 2026.
Market Trends and Insights
Drivers Impact Analysis of Security Assessment Market*
| Driver | (≈) % Impact on CAGR Forecast | Geographic Relevance | Impact Timeline |
|---|---|---|---|
| Growing volume and sophistication of phishing/malware attacks | +1.2% | Global | Short term (≤ 2 years) |
| Regulatory compliance mandates expanding to mid-market | +0.8% | North America & EU | Medium term (2-4 years) |
| Surging cloud migration creating demand for continuous validation | +0.6% | Global | Medium term (2-4 years) |
| AI-enabled automated testing platforms lowering cost and cycle time | +0.4% | North America & APAC | Long term (≥ 4 years) |
| Pen-Testing-as-a-Service uptake among SaaS vendors | +0.3% | Global | Medium term (2-4 years) |
| Convergence of DevSecOps with shift-left testing | +0.2% | North America & EU | Long term (≥ 4 years) |
| Source: Mordor Intelligence | |||
Growing Volume and Sophistication of Phishing/Malware Attacks
Ransomware strikes on healthcare providers jumped 137% within 18 months, compelling firms to rethink assessment methods beyond annual checklists. Attackers now pivot tactics within days of patch releases, so enterprises are deploying continuous breach simulation that mirrors adversary behavior instead of static scans. Asia-Pacific records the highest median dwell times globally, exposing response gaps that specialized assessment services must close. Providers delivering AI-backed threat emulation and red-team exercises see rising engagement as clients demand realistic validation over routine vulnerability sweeps. The vulnerability assessment services market size in Asia-Pacific is forecast to rise at a 10.8% CAGR through 2030, fuelled by rapid digitization, regulatory catch-up, and growing threat awareness.
Regulatory Compliance Mandates Expanding to Mid-Market
The Digital Operational Resilience Act, live since January 2025, obliges more than 22,000 EU financial firms to run regular resilience testing, extending obligations from major banks to mid-tier entities.[1] In the United States, regulators signal baseline resilience requirements that incorporate third-party risk programs, pushing fresh demand for assessment among regional banks. Proposed HIPAA security updates further require multi-factor authentication and yearly audits, projecting USD 9 billion first-year compliance costs.[2] These broadening mandates stabilize service demand by transforming compliance from episodic to ongoing.
Surging Cloud Migration Creating Demand for Continuous Validation
FedRAMP 20x streamlines U.S. federal cloud authorizations with infrastructure-as-code and nonstop monitoring, illustrating an industry move from point-in-time tests to ever-running assessment. The Cloud Security Alliance flags identity weaknesses as top cloud threats, pulling attention toward configuration assessment across AWS, Azure, and Google Cloud. Providers that embed assessments into DevOps pipelines thus gain competitive ground.
AI-Enabled Automated Testing Platforms Lowering Cost and Cycle Time
The National Security Agency’s autonomous penetration testing prototypes highlight how AI trims weeks-long engagements to hours.[3] Solutions such as Nebula automatically map vulnerabilities and generate exploits, democratizing advanced testing for organizations lacking deep internal resources. The Cloud Security Alliance emphasizes that AI augments human experts, freeing them for strategic analysis while automation handles repetitive discovery tasks.[4] Vendors pairing AI with expert validation address concerns over false positives and ethics.
Restraints Impact Analysis of Security Assessment Market*
| Restraint | (≈) % Impact on CAGR Forecast | Geographic Relevance | Impact Timeline |
|---|---|---|---|
| Budget constraints in SMB segment | –0.4% | Global; APAC & MEA | Short term (≤ 2 years) |
| Shortage of skilled red-team/pentest talent | –0.3% | Global | Medium term (2-4 years) |
| Tool sprawl creating assessment fatigue | –0.2% | North America & EU | Short term (≤ 2 years) |
| Accuracy concerns over Gen-AI assessment engines | –0.1% | Global | Medium term (2-4 years) |
| Source: Mordor Intelligence | |||
Budget Constraints in SMB Segment
Small firms devote near 4% of revenue to security yet face disproportionate breach rates, with 56% of Asia-Pacific SMEs reporting incidents and 75% suffering customer data loss. Full-spectrum testing often exceeds available budgets, pushing many toward basic scanners and leaving gaps in threat coverage. Affordability concerns therefore cap near-term expansion, but they also spur innovation in automated, subscription-priced platforms that lower delivery costs.
Shortage of Skilled Red-Team/Pentest Talent
Asia-Pacific alone requires 2.1 million additional cybersecurity professionals, and 64% of firms plan budget increases to attract talent. Scarcity inflates wages, elevates service pricing, and creates scheduling delays for advanced assessments. Providers respond by centralizing scarce expertise into managed services and augmenting analysts with AI to extend capacity, yet near-term supply shortfalls still temper growth.
*Our forecasts treat driver/restraint impacts as directional, not additive. The impact forecasts reflect baseline growth, mix effects, and variable interactions.
Security Assessment Market Segment Analysis
By Service Type:
Continuous Validation Recasts PrioritiesVulnerability assessment held 33.02% of 2025 revenue, underscoring its foundational role in compliance programs. PTaaS, however, will scale fastest at 7.18% CAGR, mirroring a market pivot to ongoing validation aligned with DevOps. Many enterprises transition from yearly pentests to monthly or sprint-driven exercises. Risk and compliance audits sustain steady uptake thanks to DORA and HIPAA revisions.
Demand for cloud configuration assessment is rising as multi-cloud estates proliferate. Vendors embedding APIs into CI/CD pipelines create durable advantage, replacing lengthy consulting cycles with real-time dashboards. Mainstream adoption of AI-assisted exploit generation further shifts buyer expectations toward speed over labor hours. Providers offering hybrid models-automated discovery plus analyst validation-balance efficiency and accuracy, appealing to risk-averse sectors like BFSI and healthcare.

By Deployment Model:
Cloud Momentum BuildsOn-premise testing environments, mandatory for certain financial and government clients, delivered 51.65% revenue in 2025. Nonetheless, cloud-delivered assessment platforms will post an 7.97% CAGR to 2031. Elastic scale, remote collaboration, and integration with cloud-native workloads drive uptake. The FedRAMP 20x roadmap shows public-sector appetite for continuous cloud monitoring, and private enterprises follow suit. Multi-tenant SaaS assessment reduces infrastructure overhead for clients and accelerates updates.
Providers differentiating through multi-cloud visibility and API openness secure longer-term contracts. Conversely, purely on-premise tools risk obsolescence as hybrid workforces and edge deployments expand. Where data-sovereignty regulations persist, vendors increasingly position sovereign SaaS regions rather than hard-air-gapped appliances to retain regulated customers.
By Organization Size:
SMEs Close the GapLarge enterprises contributed 59.58% revenue in 2025, reflecting complex estates requiring layered assessments. They commission red-team simulations, social-engineering tests, and regulatory audits in parallel, creating high average deal sizes. Yet SMEs are poised for 6.63% CAGR as cloud platforms flatten entry barriers. Automated SaaS assessment bundled with managed remediation guidance fits smaller IT teams. Vendors offering modular subscriptions rather than six-figure projects penetrate this segment.
Awareness is climbing as insurers tighten cyber-policy conditions, often mandating annual scans even for modest firms. Government grant programs in several countries subsidize SME security upgrades, indirectly bolstering demand for assessment services. These conditions gradually chip away at enterprise dominance, broadening the security assessment industry client base.
By End-User Industry:
Healthcare AcceleratesBFSI led with 27.85% revenue in 2025 owing to stringent reporting rules and high monetary stakes. DORA enforces continuous resilience testing, while US regulators eye similar baselines, ensuring steady spend. Telecommunications and IT services remain heavy users to protect backbone infrastructure. Healthcare and Life Sciences will rise fastest at 5.92% CAGR through 2031, propelled by HIPAA rule changes that impose multi-factor authentication and annual audits. Rising ransomware on hospitals magnifies urgency.
Retail, energy, and utilities also enlarge budgets as payment compliance and critical-infrastructure mandates evolve. Industrial control system testing emerges as a niche requiring domain-specific expertise, creating room for specialists. Collectively these verticals keep the security assessment market on a growth trajectory through the decade.
Geography Analysis
North America Security Assessment Market
North America produced 40.88% of 2025 revenue owing to deep budgets and far-reaching regulations. FedRAMP 20x and potential federal resilience baselines spur federal and banking sectors to adopt continuous monitoring. Canada aligns breach-notification rules with its USMCA partners, while Mexico’s 2024 data-protection statute elevates demand for standardized assessment across supply chains.
APAC Security Assessment Market
Asia-Pacific is the growth engine with an 8.27% CAGR through 2031. Rapid cloud adoption, e-commerce expansion, and heightened geopolitical tensions lift spending. Australia’s five-year cybersecurity accord with Microsoft and Japan’s defense-oriented cyber build-out illustrate capital infusion. The region’s 2.1 million talent gap and prolonged dwell times create appetite for managed and automated services that offset staffing deficits. SMEs particularly favor subscription-delivered testing platforms to close exposure gaps without heavy capex.
Europe Security Assessment Market
Europe remains sizable through sweeping legislation. DORA reaches thousands of financial entities, while NIS2 widens compulsory security controls across utilities and digital providers. The region’s strict data-sovereignty stance directs demand toward localized cloud nodes and encrypted data storage within assessments. United Kingdom operational-resilience rules converge with EU statutes, simplifying pan-European compliance roadmaps for multinational banks.
LATAM and MEA Security Assessment Market
Latin America, Middle East, and Africa show nascent yet accelerating uptake as cyber incidents escalate and governments draft national strategies. Gulf Cooperation Council states invest in sovereign cloud zones, driving local assessment demand. South American power utilities prioritize critical-infrastructure audits following headline ransomware incidents. Budget limitations still temper immediate revenue, but vendor partnerships with regional integrators lay groundwork for mid-term expansion.
Regulatory Landscape
Security assessment demand is increasingly anchored to enforceable cyber rules and standards that move organizations from point-in-time testing toward ongoing validation. In the European Union, DORA has been in effect since January 2025 and requires regular resilience testing across a broad set of financial entities. The Cyber Resilience Act (CRA), which entered into force in December 2024, extends obligations toward secure-by-design practices and incident and vulnerability reporting for digital products.
In 2026, regulators and standards bodies continued to tighten the compliance-to-assessment linkage. The European Commission published a January 2026 proposal to update the EU cybersecurity framework through a Cybersecurity Act review (often referred to as Cybersecurity Act 2), including targeted amendments linked to NIS2 clarity. ENISA also advanced implementation tooling through the Single Reporting Platform (SRP), which becomes mandatory for CRA incident reporting operations beginning September 2026. In the United States, NIST continued operational guidance around Cybersecurity Framework 2.0 with March 2026 quick-start guidance (SP 1308), reinforcing enterprise risk management and workforce alignment that assessment providers routinely map to in audit-ready deliverables.
Value Chain Analysis
The security assessment value chain begins with standards, threat intelligence, and testing research, and then moves through tooling and platform layers (vulnerability scanners, cloud configuration assessment, breach and attack simulation, PTaaS portals, and reporting workflows). Service delivery follows, typically through consulting-led assessments, managed continuous validation, and compliance audit programs. Inputs include vulnerability feeds, exploit and proof-of-concept research, attack-surface telemetry from cloud and endpoint ecosystems, and policy mappings, including NIST-aligned and EU regime mappings.
Delivery is carried out by a mix of global consultancies, specialist security firms, and SaaS platform vendors, and the outputs are consumed by enterprises via direct contracts or through channels such as cloud marketplaces, systems integrators, and insurers or brokers that reference assessment outcomes in underwriting workflows. Bottlenecks and control points increasingly sit in the software supply chain and CI/CD pipeline, where security assessment shifts left into build and deployment workflows. High-profile compromises in widely used developer components, such as the March 2025 compromise of the tj-actions/changed-files GitHub Action affecting over 23,000 organizations, and the September 2025 npm ecosystem compromise highlighted by CISA, reinforce demand for continuous assessment of dependencies, secrets handling, and release integrity. On the procurement side, public-sector guidance such as the April 2025 GSA C-SCRM acquisition guide and requirements framed by NIST SP 800-161 encourage buyers to integrate supply chain risk management into enterprise risk programs, expanding assessment scope beyond infrastructure and applications to include third-party products, open-source dependencies, and vendor assurance artifacts.
Competitive Landscape
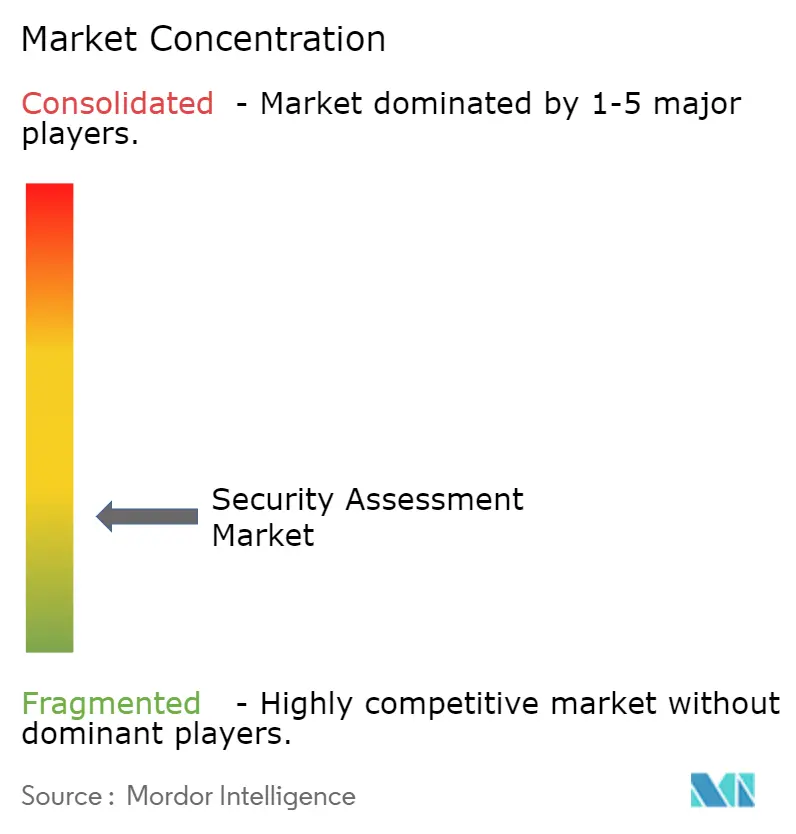
Market dynamics reflect fragmentated with consulting giants, security specialists, and AI start-ups vying for wallet share. IBM, Accenture, and Deloitte leverage broad client footprints and vertical expertise. CrowdStrike, Rapid7, and Qualys focus on cloud-based platforms offering integrated vulnerability, compliance, and threat-hunting modules. Consolidation accelerates: Cisco’s USD 28 billion Splunk buy and CyberArk’s USD 1.54 billion Venafi deal underline a platform race. Investment intensity is high-Accenture spent USD 6.6 billion on acquisitions and USD 1.2 billion on R&D in FY 2024.
Differentiation hinges on AI-driven automation, multi-cloud visibility, and DevSecOps workflow integration. Application Security Posture Management tools address alert fatigue by correlating findings and prioritizing fixes, an angle that appeals to over-tooled enterprises. PTaaS players disrupt traditional consulting by offering on-demand pentests via web portals with flat pricing. White-space exists in quantum-safe cryptography assessments, industrial control testing, and AI model security audits-areas with rising regulatory scrutiny yet scant service depth.
Strategic moves continue: Zscaler bought Red Canary in May 2025 to bolster AI-powered security operations. Palo Alto Networks’ plan to buy Protect AI and launch Cortex XSIAM 3.0 highlights email-security enhancement via AI CRN. Sophos closed an USD 859 million Secureworks purchase to build managed detection capacity. Arctic Wolf’s Cylance acquisition enriches endpoint coverage, and Mastercard’s Recorded Future deal shows non-security firms acquiring threat intelligence for core operations.
Overall, leading five vendors account for roughly 28% of global revenue, indicating a moderately fragmented environment that encourages continuous innovation and acquisition.
Security Assessment Industry Leaders
-
IBM Corporation
-
Qualys Inc
-
Trustwave Holdings, Inc (Singapore Telecommunications Limited)
-
AO Kaspersky Lab
-
Trellix
- *Disclaimer: Major Players sorted in no particular order
Security Assessment Market Companies Covered in this Report
- IBM Corporation
- Accenture PLC
- Cisco Systems Inc.
- Rapid7 Inc.
- Qualys Inc.
- Check Point Software Technologies Ltd.
- Trustwave (Singtel)
- Optiv Security Inc.
- Mandiant (Google Cloud)
- Secureworks Inc.
- Synopsys Inc.
- CrowdStrike Holdings Inc.
- Fortinet Inc.
- Palo Alto Networks Inc.
- Tenable Holdings Inc.
- Veracode
- Snyk Ltd.
- Absolute Software Corp.
- Holm Security
- Kaspersky Lab
- FireEye/Trellix
Market Opportunities and Future Outlook
Regulation-driven testing expansion and supply chain security obligations create visible whitespace for assessment offerings that package evidence, reporting, and remediation into repeatable programs instead of one-off projects. In the EU, the CRA (in force since December 2024) and ENISA-led implementation mechanisms such as the Single Reporting Platform (mandatory operations starting September 2026) increase the volume and structure of vulnerability and incident reporting workflows. This creates room for providers that can operationalize intake, triage, proof-of-exploitability, and audit-ready documentation across product and enterprise environments. The European Commission also advanced a January 2026 Cybersecurity Act review proposal that emphasizes certification modernization and ICT supply chain risk, which increases buyer demand for assessment artifacts that map to certification and supplier assurance requirements.
Technology shifts further support opportunities around continuous, automated validation tied to DevSecOps and security operations. As tool sprawl increases, buyer attention has moved toward exploit validation and exposure prioritization. IBM is commercializing AI-enabled capabilities through expanded security offerings aimed at agentic threats, while Qualys is connecting risk signals into broader operational ecosystems. Beyond traditional vulnerability scanning, emerging assessment categories include software supply chain assurance (SBOM-driven validation and dependency remediation), AI model and AI-enabled application security reviews, and post-quantum readiness assessments in regulated sectors that need documented migration plans and control evidence, supporting demand for specialized frameworks, repeatable testing playbooks, and managed services that address talent constraints.
Recent Industry Developments in Security Assessment Market
- July 2026: IBM and Red Hat expanded Lightwell with new commercial offerings, including Lightwell Network and Lightwell Clearinghouse Premier, targeting automated remediation of open-source software vulnerabilities. The update connects supply chain security assessment outputs to verified remediation workflows, tightening the loop between discovery, prioritization, and patching for dependency-heavy software stacks.
- June 2026: IBM joined the OpenAI Daybreak Cyber Partner Program and introduced a new application security service using OpenAI models to identify and validate software vulnerabilities. This broadens the toolset available for assessment teams to accelerate triage and validation while positioning AI-assisted application security as a mainstream, service-delivered capability.
- May 2025: Zscaler acquired Red Canary to advance AI-powered security operations capabilities. The acquisition reinforced platform consolidation, as buyers increasingly prefer providers that can combine assessment, detection, and response signals into unified workflows rather than managing disconnected point solutions.
Security Assessment Market Report Scope and Research Methodology
Market Definition and Coverage
For this study, the security assessment market is counted as the revenues earned from cyber security evaluation work that identifies weaknesses and checks controls, across on premise and cloud environments, before fixes are implemented.
Scope exclusions: We exclude security hardware and ongoing managed security operations that are delivered as continuous monitoring or outsourced day to day defense.
Segments Covered in This Report
- By Service Type
- Vulnerability Assessment
- Penetration Testing
- Risk and Compliance Audit
- Red-/Purple-Team Simulation
- Cloud Configuration Assessment
- By Deployment Model
- On-Premise
- Cloud
- By Organization Size
- Large Enterprises
- Small and Medium-Sized Enterprises (SMEs)
- By End-user Industry
- BFSI
- IT and Telecom
- Healthcare and Life Sciences
- Retail and eCommerce
- Energy and Utilities
- Government and Defense
- Others (Education, Media, etc.)
- By Geography
- North America
- United States
- Canada
- Mexico
- South America
- Brazil
- Argentina
- Rest of South America
- Europe
- Germany
- United Kingdom
- France
- Italy
- Spain
- Netherlands
- Russia
- Rest of Europe
- Asia-Pacific
- China
- Japan
- India
- South Korea
- South East Asia
- Australia and New Zealand
- Rest of Asia-Pacific
- Middle East and Africa
- Middle East
- Saudi Arabia
- United Arab Emirates
- Turkey
- Rest of Middle East
- Africa
- South Africa
- Nigeria
- Egypt
- Rest of Africa
- Middle East
- North America
Data Sources, Market Sizing, and Validation
Desk Research
Desk work starts by mapping what an assessment typically includes, how it is bought (project based or retainer), and which regulations and standards are pushing demand. We review open references such as NIST publications, ISO guidance notes, CISA advisories, and frameworks and reports from sources such as ENISA to keep terminology and control areas consistent.
To ground the demand side, we use indicators that show where assessment spend usually rises, such as reported breach patterns, cloud adoption signals, and compliance timelines. For this, we also scan public sources such as SEC cybersecurity disclosure guidance and filings, government cyber strategy updates, and select peer reviewed security journals for recurring risk themes. Alongside these, company annual reports, investor presentations, and reputable press coverage are used to understand service mix changes and pricing direction, and a paid subscription for company financials and news is used only to speed up cross checks. This list is not exhaustive, and many other sources were referred to for data collection, validation, and research clarification.
Primary Interviews and Surveys
Primary inputs come from interviews and short surveys with assessment service providers, enterprise security buyers, and channel and advisory participants who see procurement cycles. We use these conversations to confirm what is usually included in an assessment statement of work, how pricing is quoted (for example by scope, assets, or test days), and what changes when clients move workloads to cloud or adopt zero trust programs. Regional coverage is kept broad so assumptions on utilization, project size, and compliance led demand are not overfit to one geography.
Distribution of primary research fieldwork respondents
| Company type | Respondent position | Region |
|---|---|---|
| Top tier: 34% | CXOs: 13% | APAC: 42% |
| Mid tier: 51% | Functional/Unit leaders: 42% | EMEA: 32% |
| Smaller Players: 15% | Managers: 45% | Americas: 26% |
Market-Sizing & Forecasting
Sizing starts from a top-down build that reconstructs the addressable pool using security services spend signals and then filters it to assessment-only work through observed service mix and project frequency. Once that spine is built, we corroborate it with selective bottom-up checks, such as sampled price ranges multiplied by typical project volumes, and supplier roll ups for a practical subset of providers, and then the totals are adjusted when the ranges do not reconcile.
Key inputs used in the model include assessment frequency for regulated sectors, average assessment scope measured through typical asset or application counts, utilization patterns for testing teams, pricing movement by assessment type, and cloud migration pace that changes the mix between on premise and cloud reviews. Forecasts are built using scenario analysis, where baseline demand is linked to compliance timelines and breach driven urgency, and then stress tested with interview feedback on budget tightening or faster adoption of continuous testing. When bottom-up inputs are missing for smaller geographies or niche service lines, we fill the gaps using ratios observed in similar markets and validate the implied spend per enterprise against what practitioners describe as realistic.
Data Validation & Update Cycle
Outputs are checked through top-down and bottom-up consistency tests, followed by variance checks across regions and service types so the totals do not drift away from realistic buying patterns. We review anomalies like sudden price jumps or unusually high spend per employee, and those points are reworked or revalidated through follow up calls when needed.
Before sign off, another analyst reviews assumptions, math logic, and year over year movements, and only then are numbers finalized. Reports are refreshed annually, and interim updates are made when there are material events such as major regulation changes or sharp shifts in enterprise security spending. Right before delivery, we do a last pass to incorporate the most recent public disclosures and market signals.
Mordor Intelligence's Security Assessment Market Size Measured Against Other Published Estimates
Published market values for security assessment rarely match each other because groups define the service perimeter differently and they also make different calls on pricing, currency timing, and update cadence. The result is that two studies can use similar words, but they may be counting different revenue streams and different buying motions.
Some published figures appear to bundle broader cyber consulting or ongoing security operations into the same number. For Mordor Intelligence, only fee based assessment work is counted, and hardware sales and continuous managed defense are kept out, which tends to narrow the total and keeps it closer to repeatable project and retainer demand.
Benchmark comparison
| Source | Market Size | Gaps in Research Methodology |
|---|---|---|
| Mordor Intelligence | USD 4.87 B (2025) | |
| Industry Publisher A | USD 11.30 B (2025) | This estimate appears to treat security assessment as a wider umbrella that can include application security testing tool related revenues and adjacent security services, which lifts the addressable value beyond assessment fees alone. |
| Research Platform B | USD 6.50 B (2024) | This number is presented as assessment services, but the year and currency basis are not always aligned to a single global conversion point, and the scope can blend compliance audits and broader advisory packages without a clear separation of one time assessments. |
Taken together, the spread is mainly explained by how tightly assessment is separated from adjacent services, and by how consistently pricing and FX timing are applied for a single year. By keeping the model tied to observable assessment frequency, realistic project sizing, and cross checks from practitioner inputs, the market total stays transparent and easier to replicate.
Key Questions Answered in the Report
How is AI changing security assessment delivery?
AI-driven platforms cut testing time from weeks to hours, automate exploit generation, and enable continuous monitoring, while human experts remain essential for contextual validation.
What impact will DORA have on service demand in Europe?
The act mandates ongoing resilience testing for over 22,000 financial entities, creating long-term demand for operational resilience assessments and third-party risk reviews.
How large is the North American security assessment market today?
North America contributed 40.88% of 2025 global revenue, keeping the region in the lead thanks to stringent regulations and mature budgets.
Which industry segment will grow fastest through 2031?
Healthcare and Life Sciences is projected at a 5.92% CAGR as new HIPAA rules require annual audits, multi-factor authentication, and updated inventories.
Why are SMEs expected to increase spending despite budget constraints?
Cloud-delivered, automated platforms reduce entry costs, and insurers plus regulators now demand baseline assessments, driving a 6.63% CAGR in SME uptake.
How large is the Security Assessment market in 2026?
The security assessment market is expected to grow from USD 4.87 billion in 2025 to USD 5.15 billion in 2026 and is forecast to reach USD 6.83 billion by 2031 at 5.78% CAGR over 2026-2031.