
Sawn Wood Market Size and Share
Sawn Wood Market Analysis by Mordor Intelligence
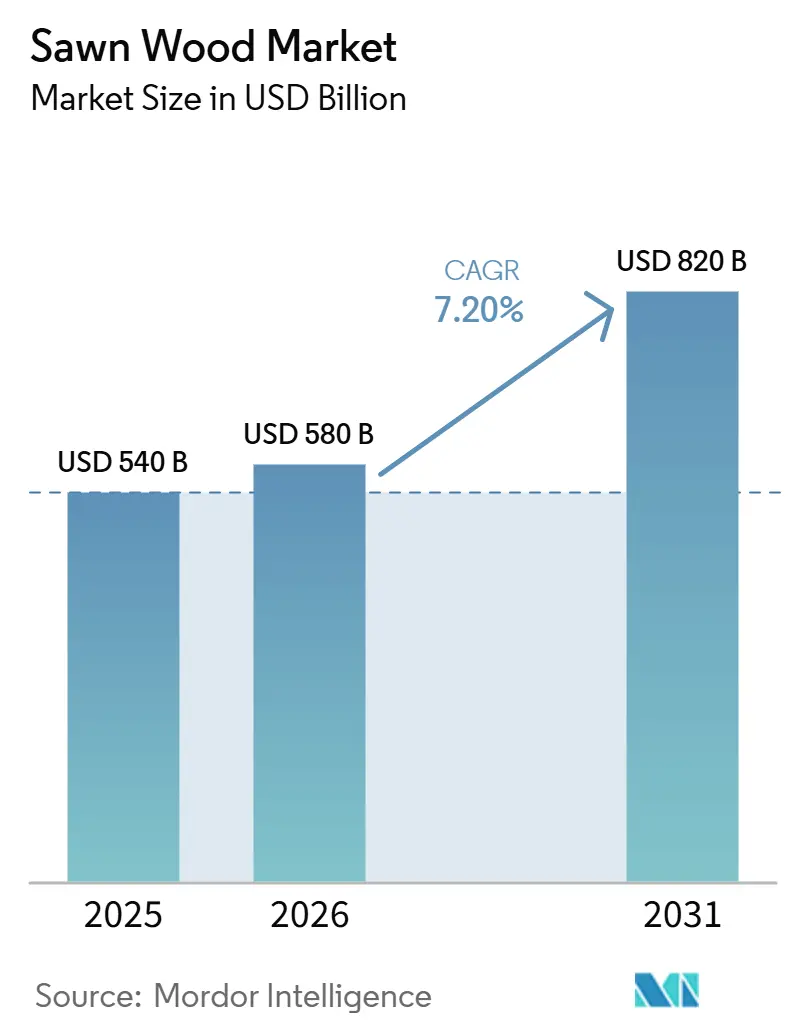
The sawn wood market size was valued at USD 540 billion in 2025 and is estimated to grow from USD 580 billion in 2026 to reach USD 820 billion by 2031, at a CAGR of 7.2% during 2026-2031. Demand is accelerating as developers substitute carbon-intensive steel and concrete with timber, governments tighten supply-chain scrutiny, and engineered-wood technologies cross the mainstream threshold. Tightening European Union Deforestation Regulation compliance deadlines are moving certification from a niche to a prerequisite, reshaping trade flows as mills with traceable output command premium pricing. Softwood maintained the largest share of the sawn wood market in 2025, owing to its lower plantation forestry costs. In comparison, hardwood is anticipated to have the fastest CAGR on premium furniture and luxury interior demand.
Key Report Takeaways
- By geography, Asia-Pacific held the largest share accounting for 38.5% share of the sawn wood market size in 2025, whereas Africa is projected to post the fastest 9.4% CAGR through 2026-2031.
Note: Market size and forecast figures in this report are generated using Mordor Intelligence’s proprietary estimation framework, updated with the latest available data and insights as of 2026.
Global Sawn Wood Market Trends and Insights
Drivers Impact Analysis*
| Driver | (~) % Impact on CAGR Forecast | Geographic Relevance | Impact Timeline |
|---|---|---|---|
| Surging residential and commercial construction in emerging economies | +1.8% | China, India, Vietnam, and Nigeria | Medium term (2-4 years) |
| Premium pricing for certified traceable sawn wood | +0.9% | Europe, North America, and Asia-Pacific | Long term (≥ 4 years) |
| Shift toward low-carbon mass-timber high-rise buildings | +1.3% | Austria, Sweden, Canada, United States, and Australia | Medium term (2-4 years) |
| Rapid adoption of modular off-site timber construction systems | +1.0% | Japan, Australia, the United Kingdom, Germany, and the United States | Short term (≤ 2 years) |
| Artificial intelligence-enabled sawmill optimization improves lumber recovery rates | +0.7% | Canada, Finland, the United States, and Brazil | Medium term (2-4 years) |
| Forest-carbon credit monetization is creating new revenue streams | +0.6% | The United States, Canada, Brazil, and Indonesia | Long term (≥ 4 years) |
| Source: Mordor Intelligence | |||
Surging Residential and Commercial Construction in Emerging Economies
Rapid urbanization across China, India, Vietnam, and Nigeria is driving demand for sawnwood used in structural framing, interior joinery, packaging, and pallet manufacturing. According to the United States Department of Agriculture Foreign Agricultural Service's 2024 report, India's annual imports of logs, lumber, and wood products increased from USD 630 million to USD 2.3 billion over the past two decades, reflecting rising demand driven by urbanization, residential construction, and the expansion of the furniture and hospitality sectors[1]Source: United States Department of Agriculture Foreign Agricultural Service, “Wood and Wood Products Update 2024,” apps.fas.usda.gov. Similar trends across emerging economies, supported by expanding infrastructure development, commercial construction, and industrial activity, continue to increase the consumption of construction-grade softwood and premium hardwood products. At the same time, Vietnam is strengthening its position as a global wood-processing hub serving the United States and European markets, while the transition from informal to regulated construction practices in Africa is anticipated to further accelerate sawnwood demand, reinforcing the region's long-term growth potential.
Premium pricing for certified traceable sawn wood
Timber certification is evolving from a voluntary practice to a market access requirement as deforestation regulations become more stringent across key importing regions. According to the Programme for the Endorsement of Forest Certification (PEFC) Global Statistics in March 2025, around 294 million hectares of forest area worldwide were certified under the PEFC system, reflecting the increasing adoption of sustainable forest management to comply with international timber legality and traceability requirements[2]Source: PEFC Global Statistics 2025, “PEFC Global Statistics,” cdn.pefc.org. The implementation of the amended European Union Deforestation Regulation (EUDR) is accelerating the adoption of certified forest management, digital traceability platforms, and chain-of-custody verification across major timber-exporting countries. Malaysia and Indonesia are strengthening national timber legality assurance systems with enhanced digital traceability capabilities, while Vietnam is expanding QR code-based wood traceability nationwide. Although certification increases compliance costs for producers, it improves access to premium international markets and strengthens buyer confidence in legally and sustainably sourced timber, thereby supporting long-term demand for certified sawnwood.
Shift Toward Low-Carbon Mass-Timber High-Rise Buildings
Whole-life carbon rules are turning timber into a competitive structural material. An Australian life-cycle study measured 260.4 kg CO₂-equivalent per square meter for timber modules versus 526.3 kg for reinforced concrete, validating a 50% emissions advantage. Projects such as the 18-story Brock Commons in Canada and the 85-meter HoHo Vienna show that engineered panels can safely reach mid-rise heights. The European Union’s Energy Performance of Buildings Directive and California’s Buy Clean Act mandate embodied-carbon disclosures, nudging architects toward mass-timber specifications. Faster assembly, lighter foundations, and superior thermal performance add cost-of-capital advantages, although insurance and fire-code hurdles still moderate adoption in some jurisdictions.
Forest-Carbon Credit Monetization Creating New Revenue Streams
Finite Carbon has routed over USD 1 billion to landowners by issuing 100 million verified offsets across 4 million acres, demonstrating scale viability. Brazil’s Forest Service tied a 17,000-hectare concession to a projected 6.5 million metric tons CO₂-equivalent sequestration over four decades[3].Source: United States Department of Agriculture Foreign Agricultural Service, “Wood and Wood Products Update 2024,” apps.fas.usda.govIndonesia's emerging carbon exchange has demonstrated the commercial potential of forest-based carbon trading despite the early-stage development of the market. Countries such as the United States and Canada are well positioned to benefit from established forest management frameworks and mature carbon project pipelines. However, high verification and auditing costs continue to limit participation among small landowners, encouraging the formation of aggregated forest projects that improve economies of scale and reduce compliance costs. As carbon markets continue to mature, integrating timber production with carbon credit generation is anticipated to enhance the economic viability of sustainable forest management and support long-term investment in the sawnwood industry.
Restraints Impact Analysis*
| Restraint | (~) % Impact on CAGR Forecast | Geographic Relevance | Impact Timeline |
|---|---|---|---|
| Tightening deforestation and land-use regulations | -1.2% | European Union, Asia-Pacific, and Africa | Short term (≤ 2 years) |
| Rising substitution by engineered wood and plastic composites | -0.8% | North America, Europe, and the Asia-Pacific | Medium term (2-4 years) |
| Volatile container freight rates are disrupting export margins | -0.6% | Global, especially long-haul routes | Short term (≤ 2 years) |
| Skilled-labor shortages in rural sawmilling clusters | -0.5% | Canada, Sweden, Finland, and Brazil | Medium term (2-4 years) |
| Source: Mordor Intelligence | |||
Tightening Deforestation and Land-Use Regulations
Tightening deforestation and land-use regulations are driving demand for sustainably sourced sawnwood by promoting responsible forest management and strengthening timber traceability requirements. Regulations such as the European Union Deforestation Regulation (EUDR) and other timber legality frameworks encourage the adoption of certified wood products and transparent supply chains, while restrictions on forest conversion and logging in natural forests are increasing reliance on plantation-grown timber. As producers invest in certification, digital traceability, and sustainable forestry practices to maintain access to international markets, these regulations are supporting the long-term growth of the global sawnwood market by enhancing consumer confidence and expanding demand for legally sourced and certified sawnwood.
Rising Substitution by Engineered Wood and Plastic Composites
Oriented strand board already covers more than 60% of North American roof and floor sheathing, undercutting commodity softwood planks on price stability and ease of installation. Wood-plastic composites dominate the United States decking market, as homeowners favor low maintenance and rot resistance. Laminated veneer lumber delivers higher load capacity per unit weight, enabling longer structural spans than solid beams. Premium hardwood niches remain insulated because grain aesthetics remain irreplaceable, yet commodity softwood faces an ongoing erosion of share. Mills are experimenting with hybrid mass-plywood and dowel-laminated timber to defend volume, but acceptance outside Europe is at an early stage.
*Our forecasts treat driver/restraint impacts as directional, not additive. The impact forecasts reflect baseline growth, mix effects, and variable interactions.
Geography Analysis
Asia-Pacific held the largest 38.5% share of global consumption in 2025 and is projected to expand at a rapid CAGR through 2031. China continues to drive regional demand for tropical timber through expanding residential construction, interior finishing, and furniture manufacturing activities. India's furniture sector reached USD 24 billion with an 11% growth outlook, underpinning record timber inflows. Vietnam continues to strengthen its position as a major global wood-processing and export hub, supported by a well-established manufacturing base and strong demand from international markets. Regulatory costs tied to the European Union Deforestation Regulation (EUDR) are raising export-grade lumber prices by USD 10–18 per cubic meter while accelerating traceability investments across Malaysia, Indonesia, and Vietnam.
Africa accounts for the fastest region, rising at 9.4% CAGR through 2026-2031. Nigeria’s shift to formal building codes and Ghana’s export-oriented sawmills both stimulate demand. Gabon took full control of Société Nationale des Bois du Gabon in 2025 to fast-track traceability, and Cameroon’s stricter concession oversight is eliminating illegal supply. Road and power deficits still keep logistics at 25-40% of delivered cost, yet new sawmills in Ghana and Côte d’Ivoire plan AI scanners to leapfrog legacy gaps.
North America and Europe are mature but innovative, growing at a significant CAGR through 2026 to 2031. Weyerhaeuser reported USD 1.708 billion in Q4 2024 revenue on the back of steadier lumber prices. Stora Enso exited 175,000 hectares of Swedish forestland for EUR 900 million (USD 945 million) in 2025 to fund engineered-wood expansion. Canfor closed several British Columbia mills, citing fiber scarcity worsened by beetle damage and regulation. South America’s prominent CAGR is underpinned by Arauco’s USD 4.6 billion Sucuriú mill, which will add 3.5 million metric tons of pulp capacity in 2027. The Middle East is advancing rapidly under Saudi Vision 2030, while Oceania’s growth is reflected with Australia’s modular uptick and New Zealand’s plantation maturity.
Regulatory Landscape
Regulation is increasingly focused on traceability and phytosanitary compliance across cross-border lumber flows. In the European Union, Regulation (EU) 2023/1115 (the EU Deforestation Regulation, EUDR) moves requirements from legality-based due diligence to deforestation-free, geo-referenced traceability, and it replaces the EU Timber Regulation framework. For exporters supplying the EU wood-products import market, this increases documentation and data-capture requirements.
In the United Kingdom, the UK Timber and Timber Products (Placing on the Market) Regulations 2013 (UKTR) continues to govern due diligence and enforcement reporting for timber placed on the UK market. In the United States, Lacey Act declaration requirements have expanded, raising the reporting burden for importers of plant and wood products, with operational compliance shaped by USDA APHIS systems. A key process change occurred in January 2026, when USDA APHIS discontinued acceptance of paper Lacey Act declarations (PPQ forms) and moved filing to electronic channels, tightening data discipline across import workflows. Separately, ISPM 15 remains the global baseline for wood packaging material used in lumber logistics, requiring approved heat treatment or fumigation and use of official certification marks, which can affect shipment release and reduce quarantine-pest risk in international movements.
Value Chain Analysis
The sawnwood value chain runs from forest management and harvesting (public and private timberlands, contractors, and log merchants) through primary conversion (sawmilling, debarking, sorting and grading, kiln drying, and remanufacturing) to secondary processing and end markets (construction, furniture, interiors, packaging, and mass-timber components). Traceability and certification programs such as FSC and PEFC chain-of-custody function as cross-cutting requirements, while phytosanitary compliance, including ISPM 15 for wood packaging, supports export logistics. Logistics resilience has also become a key midstream function, as mills and traders manage routing, warehousing, and port and rail constraints that can disrupt deliveries.
Downstream integration and by-product monetization are strengthening as mills look to maintain margins beyond commodity lumber. UPM-Kymmene and Versowood finalized a long-term partnership connected to the Korkeakoski sawmill transaction (asset transfer paired with supply and ownership alignment) to secure fiber and by-product flows, and Weyerhaeuser and Aymium formed TerraForge Biocarbon Solutions to convert wood fiber into metallurgical-grade biocarbon at Weyerhaeuser’s McComb, Mississippi lumber mill. In Japan, Sumitomo Forestry’s alliances to stabilize structural timber procurement also point to tighter coordination between demand planning, sourcing, and processing capacity among large builders and wood-product suppliers.
Competitive Landscape
Leading participants in the sawnwood market, including Weyerhaeuser Company, West Fraser Timber Co. Ltd., Canfor Corporation, Stora Enso Oyj, and Arauco, compete by strengthening their presence across the forestry value chain, from sustainable forest management and timber harvesting to sawmilling, wood processing, and distribution. Access to reliable timber resources, integrated supply chains, and extensive processing capacity remain the primary competitive advantages, enabling producers to secure raw material availability and maintain cost-efficient operations across domestic and export markets.
Major producers continue to optimize their manufacturing footprint through investments in modern sawmills, capacity expansion, and operational efficiency while rationalizing facilities in regions facing fiber constraints or rising production costs. Companies are also expanding downstream into engineered wood products, mass timber, wood panels, and prefabricated building materials to diversify revenue streams and capture higher-value opportunities across the wood products value chain. These investments reduce dependence on cyclical sawnwood prices while addressing growing demand from the construction and infrastructure sectors.
Sustainability and digitalization are becoming key competitive differentiators across the industry. Leading companies are investing in timber traceability systems, certified forest management, automation, and digital manufacturing technologies to improve lumber recovery, reduce production costs, and comply with evolving regulations such as the European Union Deforestation Regulation (EUDR). In addition, integrated forestry companies are increasingly participating in carbon credit initiatives and sustainable forest management programs, strengthening long-term resource security while enhancing access to premium export markets and supporting investments across the sawnwood value chain.
Market Opportunities and Future Outlook
Compliance-led traceability is creating opportunity for mills and traders that can provide verifiable origin data at scale, especially for shipments into the European Union under EUDR requirements and for U.S. imports under expanded Lacey Act declarations and electronic filing workflows. That shift has raised the value of digital chain-of-custody, geolocation capture, and audit-ready data exchange between forest owners, log yards, sawmills, traders, and downstream buyers. A concrete proof point is the April 2026 conclusion of the EU Horizon Europe DigiMedFor project, which validated a set of forest-wood digital tools, including RFID-based traceability and AI-driven log quality grading, reinforcing the move toward digitized compliance and higher transparency in the forest-to-mill pipeline.
Operational modernization and higher-value finishing capacity, including drying, planing, scanning, and optimization, are also an active opportunity track as producers aim to lift recovery rates and shift product mix toward specification-grade and value-added lumber. In 2026, European producers have pursued these upgrades, including SCA Bollstabruk commissioning AI-driven smart mill upgrades using MiCROTEC scanning and mill-management systems, Koskisen commissioning new channel kilns to expand drying capacity, and Holmen completing a SEK 500 million modernization at the Iggesund sawmill to raise output and expand planing capability. These investments align with a market where verified quality, reduced defects, and documented sustainability credentials increasingly differentiate suppliers in construction and industrial applications.
Recent Industry Developments
- July 2026: HS Timber Group completed the acquisition of Sweden-based Malå Såg AB and rebranded the business as Malå Timber. The deal strengthens HS Timber’s footprint in Northern Europe and adds regional processing capacity and sourcing access, supporting more coordinated supply into European lumber channels.
- January 2026: UPM and Versowood finalized their strategic partnership after regulatory approval, completing the transfer of UPM’s Korkeakoski sawmill to Versowood alongside a minority ownership link. The structure deepens alignment around wood sourcing and by-product flows, reinforcing supply continuity across integrated forest industry operations.
- January 2024: Boise Cascade expanded its Oakdale, Louisiana facility with a USD 75 million investment, lifting veneer capacity by 30% to 400 million square feet annually. The upgrade strengthens upstream material availability for wood product manufacturing and supports more stable supply into construction-driven demand cycles.


Research Methodology Framework and Report Scope
Market Definition and Coverage
For this study, the sawnwood market covers wood that has been sawn or chipped lengthwise from logs and sold as lumber for downstream uses such as construction, packaging, and furniture, across domestic supply and cross-border trade.
Scope exclusions: We exclude wood based panels, engineered wood products (like plywood and OSB), pulpwood, and logs that are not processed into sawn lumber.
Segmentation Overview
- By Geography
- North America
- United States
- Production Analysis (Production Volume)
- Consumption Analysis (Consumption Value and Volume)
- Import Market Analysis (Import Value, Volume, and Key Supplying Markets)
- Export Market Analysis (Export Value, Volume, and Key Destination Markets)
- Wholesale Price Trend Analysis and Forecast
- Regulatory Framework
- List of Key Players
- Logistics and Infrastructure
- Seasonality Analysis
- Canada
- Production Analysis (Production Volume)
- Consumption Analysis (Consumption Value and Volume)
- Import Market Analysis (Import Value, Volume, and Key Supplying Markets)
- Export Market Analysis (Export Value, Volume, and Key Destination Markets)
- Wholesale Price Trend Analysis and Forecast
- Regulatory Framework
- List of Key Players
- Logistics and Infrastructure
- Seasonality Analysis
- Mexico
- Production Analysis (Production Volume)
- Consumption Analysis (Consumption Value and Volume)
- Import Market Analysis (Import Value, Volume, and Key Supplying Markets)
- Export Market Analysis (Export Value, Volume, and Key Destination Markets)
- Wholesale Price Trend Analysis and Forecast
- Regulatory Framework
- List of Key Players
- Logistics and Infrastructure
- Seasonality Analysis
- United States
- Europe
- Russia
- Production Analysis (Production Volume)
- Consumption Analysis (Consumption Value and Volume)
- Import Market Analysis (Import Value, Volume, and Key Supplying Markets)
- Export Market Analysis (Export Value, Volume, and Key Destination Markets)
- Wholesale Price Trend Analysis and Forecast
- Regulatory Framework
- List of Key Players
- Logistics and Infrastructure
- Seasonality Analysis
- Germany
- Production Analysis (Production Volume)
- Consumption Analysis (Consumption Value and Volume)
- Import Market Analysis (Import Value, Volume, and Key Supplying Markets)
- Export Market Analysis (Export Value, Volume, and Key Destination Markets)
- Wholesale Price Trend Analysis and Forecast
- Regulatory Framework
- List of Key Players
- Logistics and Infrastructure
- Seasonality Analysis
- Sweden
- Production Analysis (Production Volume)
- Consumption Analysis (Consumption Value and Volume)
- Import Market Analysis (Import Value, Volume, and Key Supplying Markets)
- Export Market Analysis (Export Value, Volume, and Key Destination Markets)
- Wholesale Price Trend Analysis and Forecast
- Regulatory Framework
- List of Key Players
- Logistics and Infrastructure
- Seasonality Analysis
- Finland
- Production Analysis (Production Volume)
- Consumption Analysis (Consumption Value and Volume)
- Import Market Analysis (Import Value, Volume, and Key Supplying Markets)
- Export Market Analysis (Export Value, Volume, and Key Destination Markets)
- Wholesale Price Trend Analysis and Forecast
- Regulatory Framework
- List of Key Players
- Logistics and Infrastructure
- Seasonality Analysis
- Austria
- Production Analysis (Production Volume)
- Consumption Analysis (Consumption Value and Volume)
- Import Market Analysis (Import Value, Volume, and Key Supplying Markets)
- Export Market Analysis (Export Value, Volume, and Key Destination Markets)
- Wholesale Price Trend Analysis and Forecast
- Regulatory Framework
- List of Key Players
- Logistics and Infrastructure
- Seasonality Analysis
- Russia
- Asia-Pacific
- China
- Production Analysis (Production Volume)
- Consumption Analysis (Consumption Value and Volume)
- Import Market Analysis (Import Value, Volume, and Key Supplying Markets)
- Export Market Analysis (Export Value, Volume, and Key Destination Markets)
- Wholesale Price Trend Analysis and Forecast
- Regulatory Framework
- List of Key Players
- Logistics and Infrastructure
- Seasonality Analysis
- India
- Production Analysis (Production Volume)
- Consumption Analysis (Consumption Value and Volume)
- Import Market Analysis (Import Value, Volume, and Key Supplying Markets)
- Export Market Analysis (Export Value, Volume, and Key Destination Markets)
- Wholesale Price Trend Analysis and Forecast
- Regulatory Framework
- List of Key Players
- Logistics and Infrastructure
- Seasonality Analysis
- New Zealand
- Production Analysis (Production Volume)
- Consumption Analysis (Consumption Value and Volume)
- Import Market Analysis (Import Value, Volume, and Key Supplying Markets)
- Export Market Analysis (Export Value, Volume, and Key Destination Markets)
- Wholesale Price Trend Analysis and Forecast
- Regulatory Framework
- List of Key Players
- Logistics and Infrastructure
- Seasonality Analysis
- Australia
- Production Analysis (Production Volume)
- Consumption Analysis (Consumption Value and Volume)
- Import Market Analysis (Import Value, Volume, and Key Supplying Markets)
- Export Market Analysis (Export Value, Volume, and Key Destination Markets)
- Wholesale Price Trend Analysis and Forecast
- Regulatory Framework
- List of Key Players
- Logistics and Infrastructure
- Seasonality Analysis
- Vietnam
- Production Analysis (Production Volume)
- Consumption Analysis (Consumption Value and Volume)
- Import Market Analysis (Import Value, Volume, and Key Supplying Markets)
- Export Market Analysis (Export Value, Volume, and Key Destination Markets)
- Wholesale Price Trend Analysis and Forecast
- Regulatory Framework
- List of Key Players
- Logistics and Infrastructure
- Seasonality Analysis
- Japan
- Production Analysis (Production Volume)
- Consumption Analysis (Consumption Value and Volume)
- Import Market Analysis (Import Value, Volume, and Key Supplying Markets)
- Export Market Analysis (Export Value, Volume, and Key Destination Markets)
- Wholesale Price Trend Analysis and Forecast
- Regulatory Framework
- List of Key Players
- Logistics and Infrastructure
- Seasonality Analysis
- China
- South America
- Brazil
- Production Analysis (Production Volume)
- Consumption Analysis (Consumption Value and Volume)
- Import Market Analysis (Import Value, Volume, and Key Supplying Markets)
- Export Market Analysis (Export Value, Volume, and Key Destination Markets)
- Wholesale Price Trend Analysis and Forecast
- Regulatory Framework
- List of Key Players
- Logistics and Infrastructure
- Seasonality Analysis
- Argentina
- Production Analysis (Production Volume)
- Consumption Analysis (Consumption Value and Volume)
- Import Market Analysis (Import Value, Volume, and Key Supplying Markets)
- Export Market Analysis (Export Value, Volume, and Key Destination Markets)
- Wholesale Price Trend Analysis and Forecast
- Regulatory Framework
- List of Key Players
- Logistics and Infrastructure
- Seasonality Analysis
- Brazil
- Middle East
- Turkey
- Production Analysis (Production Volume)
- Consumption Analysis (Consumption Value and Volume)
- Import Market Analysis (Import Value, Volume, and Key Supplying Markets)
- Export Market Analysis (Export Value, Volume, and Key Destination Markets)
- Wholesale Price Trend Analysis and Forecast
- Regulatory Framework
- List of Key Players
- Logistics and Infrastructure
- Seasonality Analysis
- Saudi Arabia
- Production Analysis (Production Volume)
- Consumption Analysis (Consumption Value and Volume)
- Import Market Analysis (Import Value, Volume, and Key Supplying Markets)
- Export Market Analysis (Export Value, Volume, and Key Destination Markets)
- Wholesale Price Trend Analysis and Forecast
- Regulatory Framework
- List of Key Players
- Logistics and Infrastructure
- Seasonality Analysis
- Turkey
- Africa
- Egypt
- Production Analysis (Production Volume)
- Consumption Analysis (Consumption Value and Volume)
- Import Market Analysis (Import Value, Volume, and Key Supplying Markets)
- Export Market Analysis (Export Value, Volume, and Key Destination Markets)
- Wholesale Price Trend Analysis and Forecast
- Regulatory Framework
- List of Key Players
- Logistics and Infrastructure
- Seasonality Analysis
- Nigeria
- Production Analysis (Production Volume)
- Consumption Analysis (Consumption Value and Volume)
- Import Market Analysis (Import Value, Volume, and Key Supplying Markets)
- Export Market Analysis (Export Value, Volume, and Key Destination Markets)
- Wholesale Price Trend Analysis and Forecast
- Regulatory Framework
- List of Key Players
- Logistics and Infrastructure
- Seasonality Analysis
- Egypt
- North America
Data Sources, Market Sizing, and Validation
Desk Research
Desk research was used to build the factual base for supply, trade, and demand context before the market model was finalized. We relied on public forestry and wood products statistics and trade series, which help anchor production and import-export movements when country reporting styles differ.
Common references included sources such as FAO Forestry statistics, UN Comtrade and national customs dashboards, World Bank macro indicators, USGS and similar national resources where relevant for wood product context, and publications from forest product associations. We also reviewed company annual reports, investor presentations, and reputable industry press to understand pricing cycles and operating rate narratives. Where a gap existed for company level financial splits, we used a paid subscription for company financials and intelligence, and we also checked a paid patent database for directional innovation signals in sawmilling and drying. The desk sources named here are illustrative, and many other public documents were reviewed to collect, cross check, and clarify data points.
Primary Interviews and Surveys
Primary work focused on validating the practical market boundary and the assumptions that sit behind the value build, especially where public series lag or mix product groups. We spoke with a mix of sawmill operators, wood traders and importers, distributors, and large buyers in construction and furniture to confirm volume movement, grade mix, and typical price setting behavior.
Because the market is global, we checked inputs across major producing and consuming regions, and then adjusted for local trade patterns, currency effects, and differences in reported units.
Distribution of primary research fieldwork respondents
| Company type | Respondent position | Region |
|---|---|---|
| Top tier: 38% | CXOs: 12% | APAC: 50% |
| Mid tier: 45% | Functional/Unit leaders: 31% | EMEA: 31% |
| Smaller Players: 17% | Managers: 57% | Americas: 19% |
Market-Sizing & Forecasting
The sizing approach starts with a top-down reconstruction of sawnwood demand, where production and trade data are used to derive apparent consumption by region and then translated into value using representative price series. While doing this, we keep the model aligned to the same product definition across countries, so that exports, imports, and domestic output are not double counted.
To make the numbers realistic, we used a set of market fingerprints as inputs, such as reported sawnwood production and trade volumes, construction activity indicators (housing starts and permits where available), furniture and packaging output trends, capacity utilization discussions from industry commentary, and regional price trends for softwood and hardwood lumber. Forecasts were built using scenario analysis, where the demand path is adjusted based on expected construction cycles, trade policy changes, and normalization of lumber pricing, and then confirmed through expert views.
Selective bottom-up approximations were used as a check, such as sampled producer revenue splits and a volume times average selling price cross check in a few high share countries. When company disclosures were limited, we handled gaps by using regional averages and then rebalancing to match trade corrected consumption totals.
Data Validation & Update Cycle
Outputs were validated through multiple checks so results do not rely on any single data series. We compared implied consumption and pricing against independent signals like trade values, housing activity direction, and known industry cycle timing, and then investigated sharp swings before final sign off.
A second analyst reviews the key assumptions, the unit conversions, and the country roll ups, and questions outliers until the logic is consistent. The report is refreshed annually, and interim updates are triggered when material events occur, such as major trade restrictions, disruptions in log supply, or unusual price spikes. Before delivery, we run a final pass to ensure the latest public releases are reflected in the model.
Mordor Intelligence's Sawnwood Market Estimate Compared With Other Published Estimates
Published market values for sawnwood can look far apart because firms do not always count the same product boundary, time period, and price basis. They also vary in how they treat trade flows versus domestic supply.
The benchmark table shows a wide spread that mostly comes from what is included around the core lumber definition, and from whether the value is built using trade corrected consumption pricing or a broader revenue pool. In Mordor Intelligence's model, the value is tied to sawnwood production and apparent consumption with import export reconciliation, and it does not fold in engineered wood or adjacent wood based panels that can inflate totals.
Benchmark comparison
| Source | Market Size | Gaps in Research Methodology |
|---|---|---|
| Mordor Intelligence | USD 159.19 B (2026) | |
| Global Consultancy A | USD 612.36 B (2026) | Uses a wider timber and wood products revenue scope and mixes processed wood categories, which can pull in panels, builders wood products, or broader construction materials value. |
| Trade Journal B | USD 38.80 B (2025) | Represents export value only, so domestic consumption in large producing countries is not counted, and year to year movements are also driven by trade prices and currency timing. |
Taken together, the two external numbers sit on very different measuring sticks, one is a broad revenue pool and the other is only cross border shipments. By keeping the model steps traceable to production, trade, and a clear pricing basis, the final estimate stays repeatable and easier to explain in a client discussion.


Key Questions Answered in the Report
How big is the sawn wood market in 2026?
The sawn wood market size is anticipated to be valued at USD 580 billion in 2026, with a forecast to reach USD 820 billion by 2031.
Which segment holds the largest revenue share?
Softwood accounted for the largest share of global revenue in 2025, driven by its dominance in structural framing and packaging applications, according to Mordor Intelligence.
Which region is growing the fastest through 2031?
Africa is projected to record the fastest CAGR of 9.4% in 2026-2031, as infrastructure and urban housing accelerate timber demand.
How does the EU Deforestation Regulation affect suppliers?
The regulation mandates geolocation traceability from December 2026, adding USD 10-15 per cubic meter compliance cost but granting market access premiums for certified mills.
Page last updated on:


 Your data is secure and never sold or shared.


