
Market Overview
| Study Period | 2020 - 2031 |
|---|---|
| Forecast Data Period | 2026 - 2031 |
| Base Year Market Size (2025) | USD 218.20 Million |
| Market Size (2026) | USD 227.47 Million |
| Market Size (2031) | USD 269.38 Million |
| Growth Rate (2026 - 2031) | 3.44% CAGR |
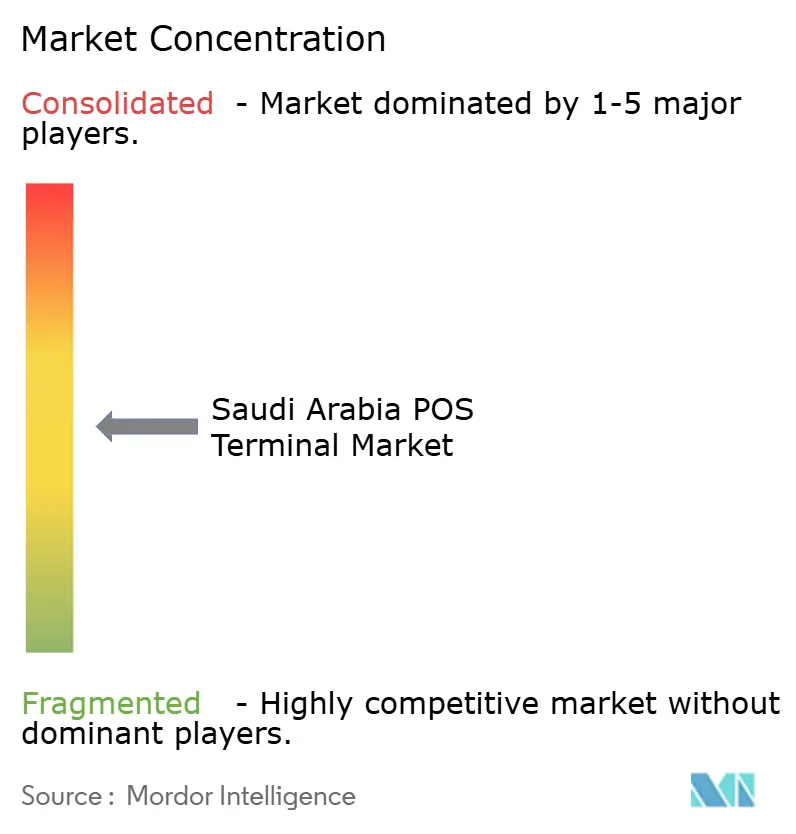
| Market Concentration | Medium |
Major Players *Disclaimer: Major Players sorted in no particular order Image © Mordor Intelligence. Reuse requires attribution under CC BY 4.0. | |
Saudi Arabia POS Terminal Market Analysis by Mordor Intelligence
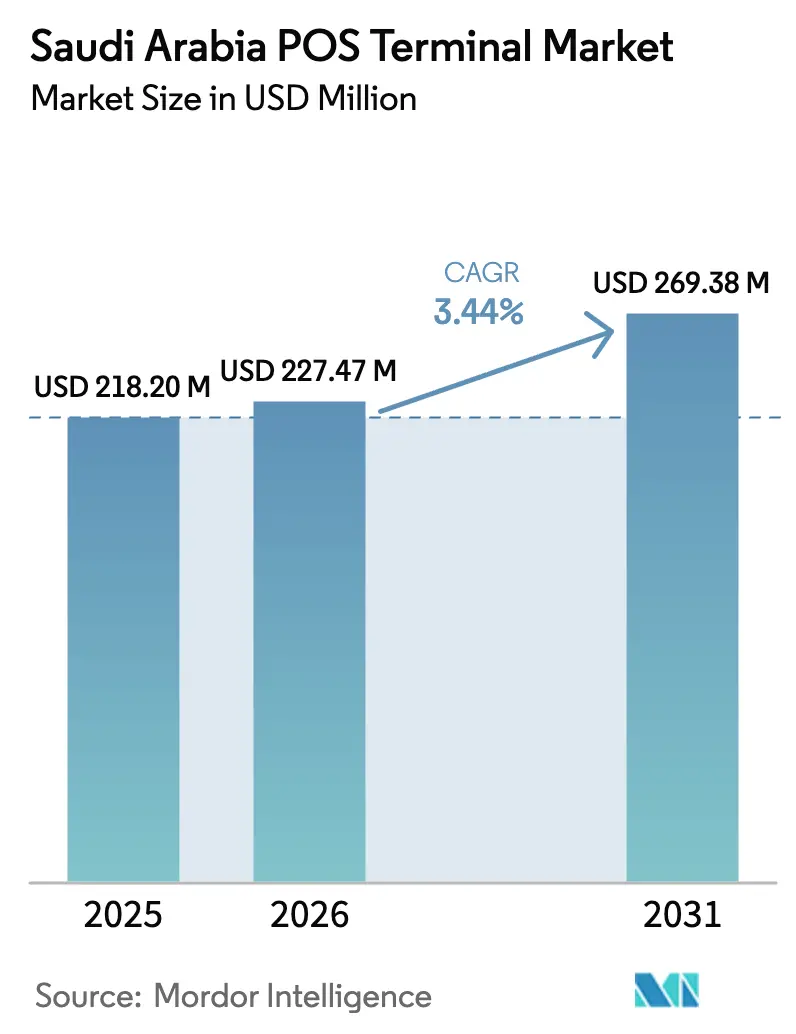
The Saudi Arabia POS terminal market size was valued at USD 218.20 million in 2025 and estimated to grow from USD 227.47 million in 2026 to reach USD 269.38 million by 2031, at a CAGR of 3.44% during the forecast period (2026-2031). The measured growth pace hides a structural shift as cash relinquishes dominance, electronic retail transactions reached 79% in 2024 and the installed terminal base climbed to 2.1 million units, signaling the market’s entry into a value-led rather than volume-led expansion cycle. High-value opportunities now cluster around contactless hardware, mobile POS form factors, and regulated verticals such as healthcare where mandatory e-invoicing and data-protection laws hasten system upgrades. Meanwhile, giga-projects like NEOM and Qiddiya are injecting fresh demand for omnichannel payment infrastructure able to handle IoT endpoints, renewable-power constraints, and bilingual invoicing. Competitive focus is therefore pivoting toward platform-as-a-service propositions that bundle loyalty, analytics, and embedded finance, allowing vendors to defend margins while the overall unit-deployment curve flattens.
Key Report Takeaways
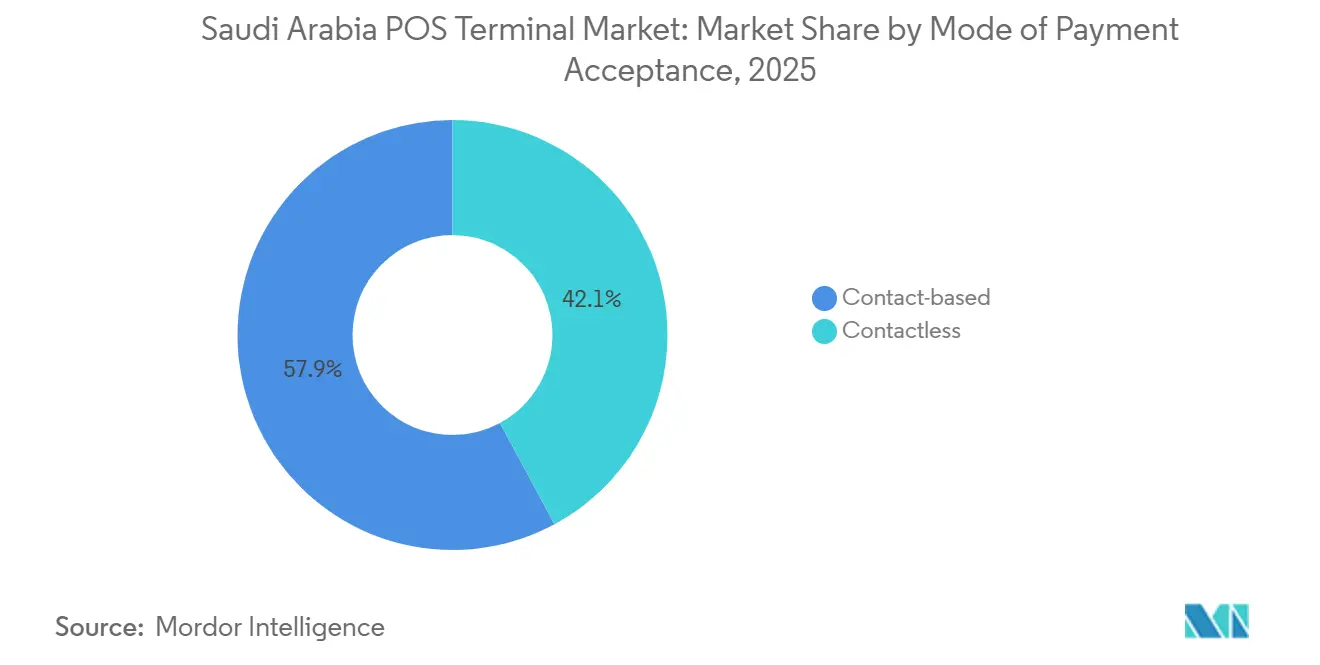
- By mode of payment acceptance, contact-based systems held 57.86% of the Saudi Arabia POS terminal market share in 2025, while contactless terminals are projected to expand at a 5.21% CAGR through 2031.
- By POS type, fixed terminals commanded 62.79% share of the Saudi Arabia POS terminal market size in 2025; mobile and portable devices are forecast to grow at a 4.54% CAGR between 2026-2031.
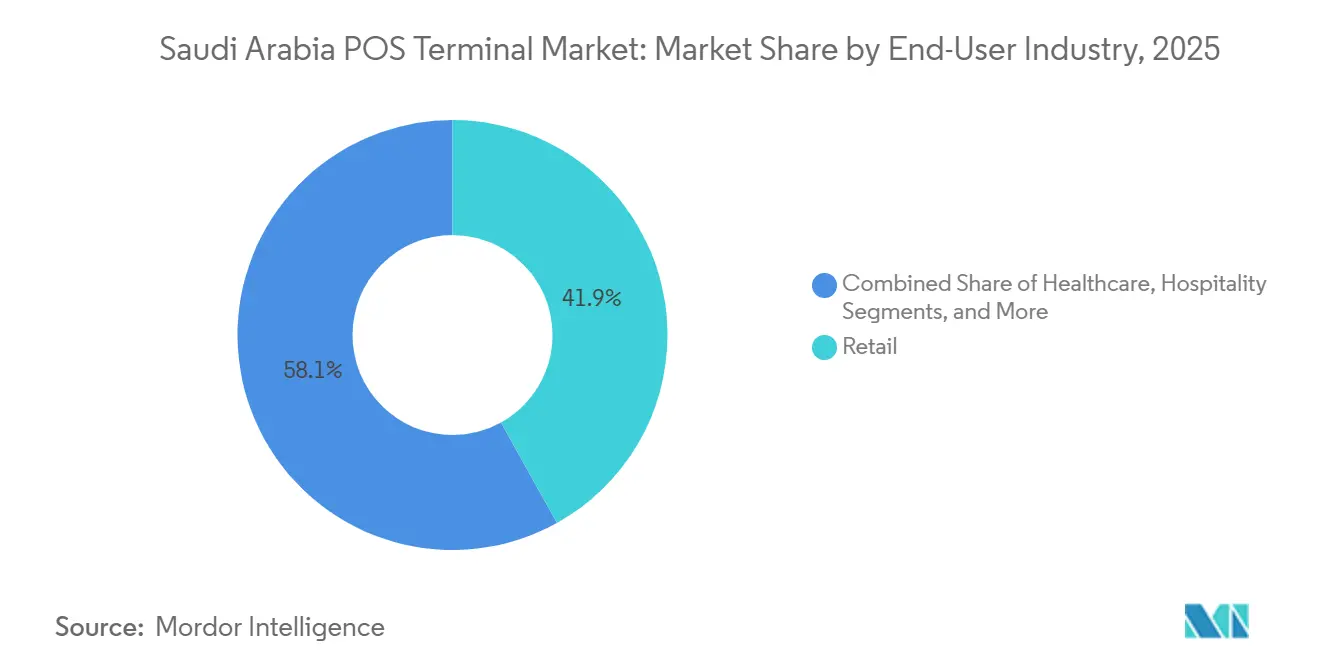
- By end-user industry, retail led with 41.92% revenue share in 2025, whereas healthcare is set to accelerate at a 6.13% CAGR to 2031.
Note: Market size and forecast figures in this report are generated using Mordor Intelligence’s proprietary estimation framework, updated with the latest available data and insights as of 2026.
Saudi Arabia POS Terminal Market Trends and Insights
Drivers Impact Analysis*
| Driver | (~) % Impact on CAGR Forecast | Geographic Relevance | Impact Timeline |
|---|---|---|---|
| Vision 2030 Cashless-Transaction Mandate | +1.2% | National, strongest in Riyadh, Jeddah, Eastern Province | Medium term (2-4 years) |
| Nationwide Roll-out of mada Contactless Network | +0.9% | National, 96% NFC penetration | Short term (≤ 2 years) |
| Retail Modernisation via Giga-Projects | +0.7% | Western Region, Central Region | Long term (≥ 4 years) |
| Mandatory e-Invoicing (Fatoora) Phase-II | +0.6% | National, staged by entity size | Short term (≤ 2 years) |
| Pilgrim Tourism Surge | +0.4% | Western Region seasonal peaks | Medium term (2-4 years) |
| Near-Universal NFC Transaction Penetration | +0.3% | Urban centers nationwide | Short term (≤ 2 years) |
| Source: Mordor Intelligence | |||
Vision 2030 Cashless-Transaction Mandate
Saudi Arabia’s Financial Sector Development Program is steering all commerce toward digital settlement, pushing electronic payments to 79% of retail transactions in 2024 and lifting weekly POS values in Riyadh to SAR 13.1 billion in May 2025.[1]Saudi Gazette Staff, “E-payments account for 79% of retail transactions in Saudi Arabia in 2024,” Saudi Gazette, saudigazette.com.sa The mandate compels merchants to upgrade hardware capable of loyalty integration, bilingual e-invoicing, and real-time reconciliation, creating a predictable multi-year replacement cycle.[2]Miguel Hadchity, “Saudi POS transactions surge 11% in late September to reach USD 3bn,” Arab News, arabnews.com Structural-break research pinpoints December 2023 as an inflection, when open-banking standards and Samsung Pay preparation triggered a higher equilibrium for transaction volumes.[3]Yazeed Alsuhaibany, “From cash to contactless: Structural break evidence from Saudi Arabia's POS transaction patterns,” Decision Science Letters, growingscience.com Vendors equipped with API-rich platforms are now favored because they shorten time-to-compliance for merchants tracking Vision 2030 KPIs. As a result, the cashless target acts less as a headline goal and more as a binding operational rulebook shaping product roadmaps across the Saudi Arabia POS terminal market.
Nationwide Roll-out of mada Contactless Network
Mada’s 96% NFC penetration eliminates the acceptance gap, turning contactless capability into a baseline expectation rather than a premium feature. February 2019 and December 2023 structural breaks, aligned with Apple Pay’s launch and subsequent Samsung Pay integration, correlate with steep jumps in the transaction mean, confirming network effects in action. Mastercard’s regional payment gateway, live since October 2024, adds another universal rail by processing 950 million transactions in 2023, thereby funneling additional traffic to NFC terminals. With ubiquity achieved, differentiation now hinges on biometric authentication, tokenization, and fraud analytics layered atop the contactless pipe. This pivot from hardware race to value extraction accelerates demand for cloud-managed, software-defined terminals across the Saudi Arabia POS terminal market.
Retail Modernization via Giga-Projects
The Public Investment Fund’s USD 1.3 trillion pipeline, NEOM, Red Sea, Qiddiya, adds 7.3 million m² of new retail space that must launch with integrated POS, e-invoicing, and omnichannel payment orchestration. NEOM’s automated port, Red Sea’s renewable-powered resorts, and Qiddiya’s mixed-reality attractions all require IoT-ready endpoints capable of high-density throughput and bilingual invoicing. PIF portfolio retailers such as Noon Minutes and Tamimi Markets are already piloting unified checkout and loyalty engines, proving the blueprint that other giga-project tenants are expected to follow.[4]Knight Frank Research, “Retail pipeline tied to PIF giga-projects,” Financial Times Partner Content, ft.com These greenfield developments convert today’s modest hardware sales into decade-long service contracts around data analytics and fraud detection. Consequently, the Saudi Arabia POS terminal market gains a durable tailwind even as urban penetration nears saturation.
Mandatory e-Invoicing (Fatoora) Phase-II Compliance
ZATCA now mandates real-time API connectivity, structured XML/UBL invoices, and bilingual output for every receipt, transforming POS devices into active compliance nodes. Large corporates began migrating in 2023, but the SME wave commencing in 2025 yields the steepest upgrade curve, rewarding turnkey vendors like stc whose Soft PoS bundles start at SAR 125.35 (USD 33.4) per month and ship ZATCA-certified cashier software. Smartphone-based SoftPOS providers such as Xpence and Paymob also capitalize because they deliver compliance without dedicated hardware. Hospitals, under the Ministry of Health’s parallel digital-billing push, are migrating to e-invoicing modules that synchronize with insurance portals, escalating healthcare’s demand for advanced POS. The regulation therefore enforces a minimum functionality layer that legacy terminals cannot meet, locking in an extended replacement wave across the Saudi Arabia POS terminal market.
Restraints Impact Analysis*
| Restraint | (~) % Impact on CAGR Forecast | Geographic Relevance | Impact Timeline |
|---|---|---|---|
| High MDR and Hardware Cost Sensitivity among SMEs | -0.8% | National, intensity higher in rural provinces | Medium term (2-4 years) |
| Escalating Cyber-Fraud and PCI-DSS Compliance Burden | -0.5% | Urban high-transaction corridors | Short term (≤ 2 years) |
| Patchy 4G/5G Coverage in Remote Provinces | -0.3% | Northern Borders, Al-Jouf, Tabuk | Long term (≥ 4 years) |
| Shortage of Certified POS Field Technicians | -0.2% | Cities beyond Riyadh, Jeddah, Dammam | Medium term (2-4 years) |
| Source: Mordor Intelligence | |||
High MDR and Hardware Cost Sensitivity among SMEs
Small merchants still balk at merchant discount rates and device prices, which erode thin grocery or quick-service margins. Geidea joined forces with Tarabut Gateway in November 2024 to layer open-banking lending atop POS data, directly tackling a SAR 300 billion (USD 80 billion) SME credit gap. Sub-USD 35 monthly SoftPOS bundles from stc and phone-based acceptance from Xpence-Paymob lower entry cost, yet Berg Insight counts fewer than 10 million smartphones globally running SoftPOS as of 2023, showing adoption remains nascent. Opaque MDR structures, despite 2016 interchange caps, continue to cloud ROI calculations for rural retailers. Until pricing transparency widens and handset-based acceptance scales, SME onboarding will lag, tempering the headline growth of the Saudi Arabia POS terminal market.
Escalating Cyber-Fraud and PCI-DSS Compliance Burden
Global card fraud is projected at USD 36 billion in 2024 and Middle East consumers already favor digital wallets 60% of the time, raising the stakes for compliance. Trend Micro logged 110 million cybersecurity threats in the Kingdom during 2022, and average breach costs in the region exceed USD 7 million, making annual PCI audits, penetration tests, and tokenization mandatory yet expensive. ACI Worldwide’s July 2025 pact with iNet, which processes 5 million transactions daily from two PCI-grade data centers, underlines the capex needed to maintain certification at scale. Smaller acquirers unable to amortize these investments risk margin compression or market exit. Compliance therefore acts as both a protective moat for incumbents and a drag on overall CAGR within the Saudi Arabia POS terminal market.
*Our forecasts treat driver/restraint impacts as directional, not additive. The impact forecasts reflect baseline growth, mix effects, and variable interactions.
Segment Analysis
By Mode of Payment Acceptance: Contactless Migration Accelerates Despite Contact-Based Dominance
Contact-based devices retained 57.86% of the Saudi Arabia POS terminal market share in 2025, but contactless terminals are charted for a 5.21% CAGR through 2031. The mada network’s 2.1 million NFC-ready terminals handled 12.6 billion electronic payments in 2024, a volume leap confirmed by structural-break analysis that recorded post-2023 segment means almost doubling earlier plateaus. Mastercard’s regional gateway and FIDO-based passkey service compound this trajectory by cutting fraud and checkout friction.
Despite faster growth, contactless expansion is not purely card-tap driven. The 60% regional preference for wallets signals a pivot to QR and token-based rails, favoring hybrid devices that process NFC, wallet push-payments, or dynamic QR alike. ZATCA compliance accelerates refresh cycles because cloud-managed contactless hardware can receive over-the-air invoice schema updates, whereas magnetic-stripe devices often require costly retrofits. Therefore, while contact-based units continue in segments demanding PIN authentication, merchant preference is tilting decisively toward multifunctional, contactless-first endpoints, reinforcing value migration inside the Saudi Arabia POS terminal market size.


By POS Type: Mobile and Portable Systems Outpace Fixed Installations in Service-Intensive Verticals
Fixed terminals held 62.79% share of the Saudi Arabia POS terminal market size in 2025 because grocery chains, pharmacies, and fuel stations rely on lane-based checkout and extensive peripherals. Yet mobile and portable devices are forecast to grow at a 4.54% CAGR through 2031 as hospitality, healthcare, and delivery operators adopt pay-at-table and curbside models. ENOC’s AI-driven POS rollout at 60 service stations and PetroApp’s USD 50 million funding round highlight how field mobility pairs with analytics to reshape fuel retail.
Android-based smart-POS now accounts for roughly 40% of global shipments, and units with built-in cellular represented 53% of 2023 deliveries, a pattern mirrored in Saudi adoption where 5G coverage already tops 55% in Riyadh. Mobile devices also ease Fatoora integration via cloud updates, reducing TCO for SMEs. However, remote provinces with patchy connectivity still favor fixed units capable of offline buffering. This urban-rural split ensures both form factors coexist, though incremental value accrues to portable terminals bundled with software subscriptions that lock in recurring revenue within the Saudi Arabia POS terminal market share.
By End-User Industry: Healthcare Leads Growth Vector While Retail Retains Scale
Retail contributed 41.92% of Saudi Arabia POS terminal market share in 2025, yet its expansion pace is tapering as penetration nears ceiling levels in hypermarkets and malls. In contrast, healthcare will post a 6.13% CAGR to 2031, spurred by NUPCO’s SAR 2.5 billion (USD 0.67 billion) supply-chain financing marketplace that mandates real-time digital billing and POS acceptance at pharmacies and clinics. Hospitals also confront PDPL requirements, prioritizing encrypted, tokenized POS that integrate with insurance gateways and e-invoicing APIs.
Hajj and Umrah pilgrim flows, totaling 86.16 million visitors in 2024, keep hospitality deployments robust in Makkah and Madinah. Transportation and logistics verticals mirror this momentum; PetroApp oversees payments for 500,000 vehicles, proving how fleet management intersects with embedded finance at the pump. Together these shifts illustrate how regulatory and sector-specific digitization tilt incremental opportunity away from saturated big-box retail toward healthcare and mobility services, forming the new demand frontier of the Saudi Arabia POS terminal market.

Geography Analysis
Riyadh captures 35% of weekly POS value, translating to SAR 4.6 billion (USD 1.2 billion) in May 2025, underpinned by government ministries and PIF-funded mega malls that will add 3 million square meter of retail floor space. Five-G consistency reaches 55.3% in the capital, enabling low-latency links to ZATCA for real-time invoice validation. Such bandwidth allows cloud-managed terminals to update firmware remotely, a critical feature as contactless acceptance becomes ubiquitous across the Saudi Arabia POS terminal market.
Jeddah follows with 14% share, benefitting from constant Umrah flow and serving as the logistics gateway to Makkah. Retail strips and waterfront developments amplify demand for high-throughput devices, while pilgrim peaks drive seasonal surges for mobile POS. Western Region giga-projects will add 4.3 million m² of new retail space, embedding payment orchestration from day one. Makkah and Madinah collectively endure bandwidth gaps, 5G consistency stands at 36.4%, thus merchants rely on hybrid devices that buffer transactions offline during pilgrimage hyper-peaks.
The Eastern Province houses industrial hubs where fleet POS and fuel payments proliferate. ENOC’s and PetroApp’s investments exemplify Khobar and Dammam’s role as test beds for AI-enabled terminals. In contrast, Northern Borders, Tabuk, and Al-Jouf face infrastructure deficits that limit deployment; Tabuk’s 23% year-on-year value jump to SAR 265.1 million (USD 70.7 million) in September 2024 shows latent appetite unleashed by incremental 4G upgrades. As nationwide 5G build-out continues past 2027, these secondary cities are expected to close the acceptance gap, injecting another layer of geographic diversification into the Saudi Arabia POS terminal market size.
Regulatory Landscape
Saudi Arabia's POS terminal ecosystem is regulated primarily by the Saudi Central Bank (SAMA) under the Law of Payments and Payment Services. Oversight centers on payment-system operators, payment service providers, and technical and security requirements for acceptance infrastructure. SAMA policy also requires retail sector activities to provide electronic payment methods, supporting nationwide merchant enablement and helping sustain terminal replacement cycles as acceptance becomes a baseline expectation.
In March 2026, SAMA issued an updated Oversight Framework of Payment Systems and Their Operators, extending and formalizing supervisory expectations in line with international practices and the expanding fintech footprint. Requirements such as upgrading POS devices to support at least 4G connectivity and adherence to security standards, including PCI-aligned controls, shape procurement, certification, and managed-services demand for terminals deployed across the Kingdom.
Value Chain Analysis
The Saudi Arabia POS terminal value chain starts with terminal OEMs and device software providers supplying fixed and mobile form factors. In-country distributors, integrators, and field-service networks follow, covering installation, peripheral integration, and lifecycle maintenance. Acquiring banks and licensed payment service providers sit at the center of deployment by onboarding merchants, assigning merchant category codes per SAMA requirements, and managing MDR structures. For larger merchants, the deployment layer often extends into value-added services such as loyalty, reconciliation, and integration into ERP and e-invoicing workflows.
Transaction processing and settlement flow through national and interoperable rails. mada provides core card acceptance infrastructure, while SAMA-operated systems such as sarie support instant payments based on ISO 20022, and SADAD supports broader digital payment flows. Security and compliance controls, including PCI-grade hosting and security operations, are embedded across the chain, pushing more processing, monitoring, and updates into cloud-managed platforms and data-center based switching that can support SoftPOS, QR, and wallet payments alongside card transactions.
Competitive Landscape
Geidea controls more than 75% of installed units, yet rivalry remains vigorous as international hardware leaders PAX, Ingenico, and VeriFone court enterprise merchants while regional fintechs such as NearPay and Network International woo SMEs. Geidea’s November 2024 tie-up with Tarabut Gateway layers credit on top of transaction data, exemplifying the pivot from hardware sales to embedded finance.
Payment orchestration is the new battleground. ACI Worldwide aligned with iNet in July 2025, adding two PCI-compliant data centers that already route 5 million transactions a day, and strengthening real-time switching for SoftPOS, QR, and wallet payments. Mastercard’s October 2024 payment gateway and its November 2024 biometric passkey expand card-network control of the authorization layer.
White-space attackers center their strategies on low-capex entry. stc launched a Soft PoS bundle at SAR 125.35 ( USD 33.4) per month bundling device, connectivity, and ZATCA certification. Xpence and Paymob enable phone-based acceptance targeting micro-merchants, while PetroApp captures fleet payments through AI analytics at the pump. Compliance requirements such as PCI-DSS and Fatoora create high fixed costs that favor scale players able to amortize security investments, hinting at further consolidation ahead in the Saudi Arabia POS terminal market.
Saudi Arabia POS Terminal Industry Leaders
VeriFone, Inc.
Ingenico (Worldline)
PAX Technology Limited
Geidea Ltd.
Urovo Technology Co. Ltd.
- *Disclaimer: Major Players sorted in no particular order

Market Opportunities and Future Outlook
Electronic payments reaching 85% of total retail payments in 2025 and the POS estate exceeding 2.3 million devices by end-October 2025 shift the focus toward upgrading the installed base toward software-defined terminals. Remote manageability for compliance and security becomes a key buying criterion, particularly beyond tier-1 cities where coverage constraints have previously made older fixed configurations more common. SAMA requirements for retail activities to provide electronic payment methods, alongside device connectivity rules such as 4G support, keep modernization tied to both procurement and service contracting.
Cross-border and wallet acceptance also creates additional revenue levers on top of existing POS footprints. SAMA and Ant International agreed to enable acceptance of Alipay+ payments via mada in 2026, which moves POS roadmaps toward multi-wallet routing and higher-throughput acceptance in tourism-heavy corridors. More than 280 licensed fintech companies operating in the Saudi payments ecosystem expand options for acquirers and POS providers to attach services such as embedded finance, fraud analytics, and alternative rails, including instant payments and account-to-account flows, through the terminal interface.
Recent Industry Developments
- January 2026: ACI Worldwide and iNet completed system integration, enabling live routing of real-time payments across two PCI-grade Saudi data centers. The integration strengthens real-time settlement capability and supports SoftPOS and QR payments, expanding POS terminal value-add services.
- December 2025: Geidea and Planet partnered to integrate currency conversion services across Geidea POS terminals in Saudi Arabia. This broadens the value proposition of POS deployments via embedded FX, enhancing merchant wallet and transaction features.
- November 2024: Geidea and Tarabut Gateway signed an MOU to explore SME financing solutions leveraging POS data. The arrangement signals a shift from hardware-only sales to embedded finance capabilities within POS ecosystems.


Research Methodology Framework and Report Scope
Market Definition and Coverage
For this study, the market is counted as the revenue generated from POS payment terminals deployed in Saudi Arabia for in-person payment acceptance, including new terminal sales and replacement demand across merchant locations.
Scope exclusions: We exclude purely software POS applications, back-end payment processing fees, and online payment gateway revenues that do not require a physical acceptance terminal.
Segmentation Overview
- By Mode of Payment Acceptance
- Contact-Based
- Contactless
- By POS Type
- Fixed Point-of-Sale Systems
- Mobile / Portable Point-of-Sale Systems
- By End-User Industry
- Retail
- Hospitality
- Healthcare
- Transportation and Logistics
- Other End-User Industries
Data Sources, Market Sizing, and Validation
Desk Research
Desk research was used to set the guardrails for the market model and to align definitions with how payments infrastructure is tracked in Saudi Arabia. We reviewed public data and policy signals that shape terminal deployment, such as cashless targets, card and contactless adoption, and merchant digitization programs.
To build and cross-check assumptions, we referred to non-paywalled sources such as central bank and national payments system publications, general authority and statistics releases on retail and SME activity, customs and trade statistics for relevant electronics categories, and standards and certification references tied to payment security. We also used company filings, investor presentations, association websites, and reputed business press to understand product mix shifts (for example, mobile terminals and contactless-enabled models) and expected replacement cycles. Where needed, analyst access to paid subscriptions for company financials and intelligence, news and financials, patent databases, and shipment-level trade data helped validate trends and fill gaps. The sources mentioned above are illustrative, and other references were also used to collect data, validate assumptions, and clarify unclear points.
Primary Interviews and Surveys
Primary work focused on validating how demand is formed in-country, which is mainly driven by acquirer-led rollouts, merchant onboarding pace, and upgrade cycles linked to compliance and functionality. We spoke with a mix of ecosystem participants, including acquiring-side stakeholders, payment infrastructure specialists, distributors, and merchant-side operations leaders, across major urban corridors and also secondary cities so the model did not overfit to a single channel.
Distribution of primary research fieldwork respondents
| Company type | Respondent position | Region |
|---|---|---|
| Top tier: 38% | CXOs: 16% | |
| Mid tier: 45% | Functional/Unit leaders: 25% | |
| Smaller Players: 17% | Managers: 59% |
Market-Sizing & Forecasting
Sizing was built using top-down and bottom-up checks, so the final value stayed consistent with observable payment adoption and with how hardware revenues are recognized. In the top-down pass, payments infrastructure indicators were used to reconstruct the addressable installed base and refresh demand, and then this was converted into value using realistic pricing bands by terminal type.
Key inputs included growth in card and contactless transaction usage, changes in merchant acceptance coverage, the installed POS terminal base and replacement timing, the mix shift toward mobile or portable terminals, and the average selling price trend after accounting for feature upgrades and localization needs (for example, bilingual receipts and connectivity requirements). Because public data can be uneven by year, we used selective bottom-up approximations to corroborate totals, such as sampled channel pricing, distributor feedback on shipment cadence, and supplier-side revenue splits tied to Saudi activity. Where data gaps existed, we used conservative assumptions that were then re-tested in interviews.
For forecasting, we relied on scenario analysis supported by a simple multivariate regression on stable drivers, including retail sales momentum, electronic payment penetration, and merchant onboarding activity. The final outlook was adjusted only after primary experts confirmed that the implied replacement cycle and price progression matched what they are seeing in-country.
Data Validation & Update Cycle
Validation was done through stepwise checks that compare model outputs against independent signals, and then any outliers were re-opened before sign-off. We tested year-to-year movements against changes in acceptance infrastructure, policy milestones, and observed shifts in terminal type mix so the model did not show growth that the ecosystem could not plausibly support.
If major variances appeared, assumptions were traced back to the driver level, followed by re-contacting relevant respondents to confirm what changed and when it started. Reports are refreshed annually, with interim updates triggered by material events such as regulatory changes, large-scale merchant rollouts, or abrupt pricing moves. Before delivery, a final analyst pass is completed so clients receive the latest updated view that still matches the stated market definition.
Mordor Intelligence's Saudi Arabia Pos Terminal Market Size Compared With Other Published Estimates
Published market sizes for POS terminals in Saudi Arabia can look far apart because the underlying scope is not always the same, and the pricing and replacement assumptions tend to be handled differently. In this market, even a small change in what gets counted as a terminal sale, and how mobile acceptance is treated, can move the total by a large margin.
Some external figures expand the scope to include broader POS systems or software-led acceptance, and that can inflate value by mixing in non-hardware revenues. For Mordor Intelligence, the total is limited to POS terminal hardware revenues in Saudi Arabia, and it is then cross-checked against installed base movement, upgrade timing, and realistic ASP bands by terminal form factor.
Benchmark comparison
| Source | Market Size | Gaps in Research Methodology |
|---|---|---|
| Mordor Intelligence | USD 218.20 M (2025) | |
| Industry Media Brief A | USD 1098.00 M (2024) | Uses a broader POS definition that can blend payment terminals with POS system stacks and adjacent merchant technology, and the pricing basis is not clearly tied to terminal-only ASP bands or refresh cycles. |
| Specialist Research Outlet B | USD 879.47 M (2025) | Appears to focus on smart payment terminals and premium feature sets, which can overstate average prices and may count higher-value device categories beyond standard merchant POS deployments. |
The spread mainly comes from product inclusions and from how price progression and replacement cadence are assumed over time. When the model sticks to terminal-only revenue and ties volumes to acceptance footprint changes, the output becomes easier to reconcile with real deployment signals and repeatable checks.


Key Questions Answered in the Report
How fast will contactless transactions grow in Saudi Arabia through 2031?
Contactless terminals are slated to expand at a 5.21% CAGR, outpacing the overall Saudi Arabia POS terminal market by 177 basis points.
Which vertical is set to be the quickest adopter of new POS technology?
Healthcare leads, with a projected 6.13% CAGR as e-invoicing and insurance-gateway integration become mandatory.
Why do giga-projects matter for payment vendors?
NEOM, Red Sea, and Qiddiya will add more than 7 million m² of retail space that demands IoT-ready, bilingual, and compliant payment infrastructure, securing long-term service contracts.
What cost barriers still hinder SME POS adoption?
High merchant discount rates and upfront hardware prices remain deterrents, although SoftPOS bundles starting near USD 33 per month are easing pressure.
How significant is cyber-security for Saudi POS providers?
With global card fraud at USD 36 billion for 2024 and PCI-DSS audits mandatory, non-compliance risks both fines and customer attrition, pushing vendors toward tokenization and biometric authentication.
Page last updated on:






