
Market Overview
| Study Period | 2021 - 2031 |
|---|---|
| Forecast Data Period | 2026 - 2031 |
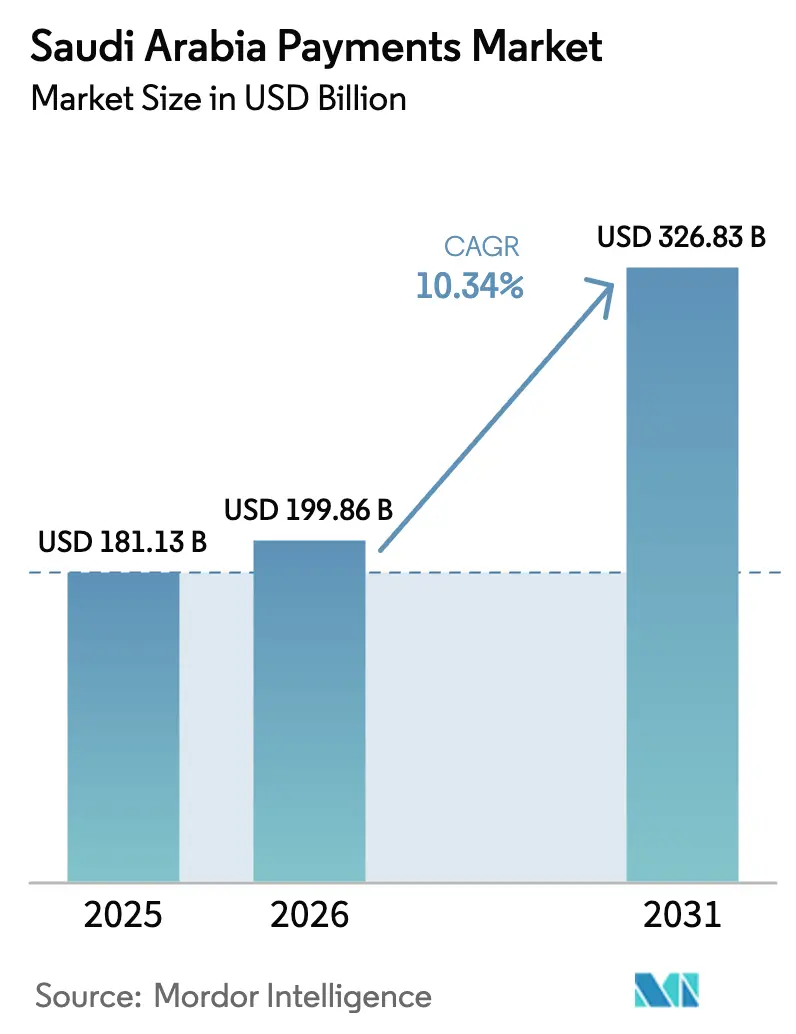
| Base Year Market Size (2025) | USD 181.13 Billion |
| Market Size (2026) | USD 199.86 Billion |
| Market Size (2031) | USD 326.83 Billion |
| Growth Rate (2026 - 2031) | 10.34% CAGR |
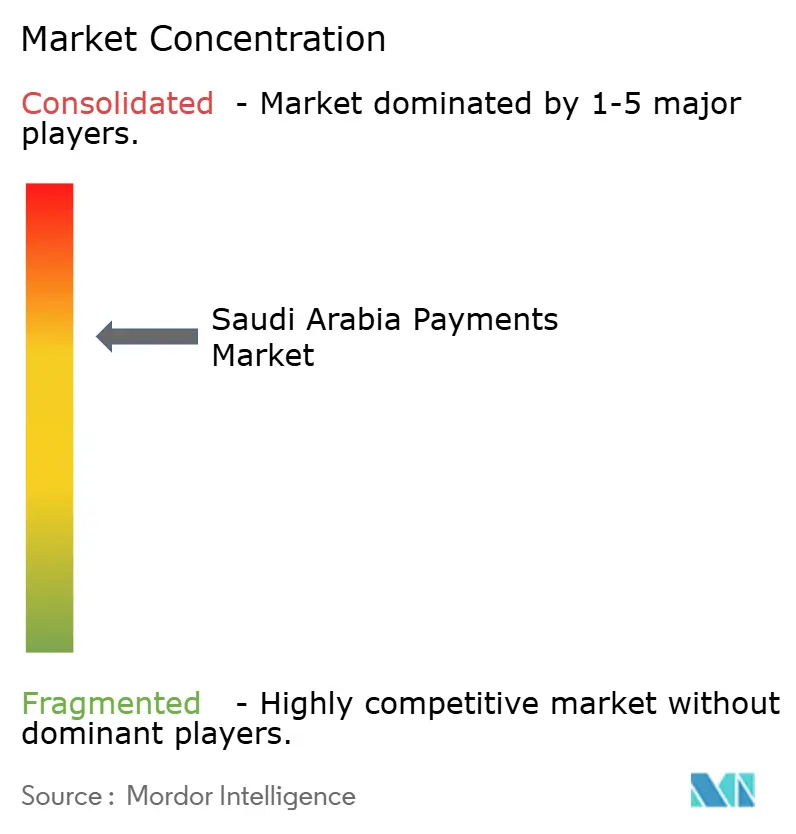
| Market Concentration | Medium |
Major Players *Disclaimer: Major Players sorted in no particular order Image © Mordor Intelligence. Reuse requires attribution under CC BY 4.0. | |
Saudi Arabia Payments Market Analysis by Mordor Intelligence
The Saudi Arabia payments market size was valued at USD 181.13 billion in 2025 and estimated to grow from USD 199.86 billion in 2026 to reach USD 326.83 billion by 2031, at a CAGR of 10.34% during the forecast period (2026-2031). Vision 2030’s cash-less objectives, real-time settlement rails, and open-banking standards continued to accelerate digital transaction volumes while encouraging competitive differentiation across service layers. Point-of-sale volumes still dominated value, yet e-commerce growth, account-to-account (A2A) rails, and tokenized pilgrim wallets elevated online channels. Regulatory clarity around payment initiation, central-bank-digital-currency (CBDC) pilots, and youth-driven buy-now-pay-later (BNPL) adoption further stimulated the Saudi Arabia payments market, positioning it as the Gulf’s most dynamic digital finance hub.[1]Adam Jones, “Redefining Digital Financial Services in Saudi Arabia,” Mastercard Perspectives, mastercard.comIntensifying cross-border trade, industrial digitization in Eastern Province, and religious tourism innovations created adjacent revenue pools that incumbent banks and fintech startups raced to capture.
Key Report Takeaways
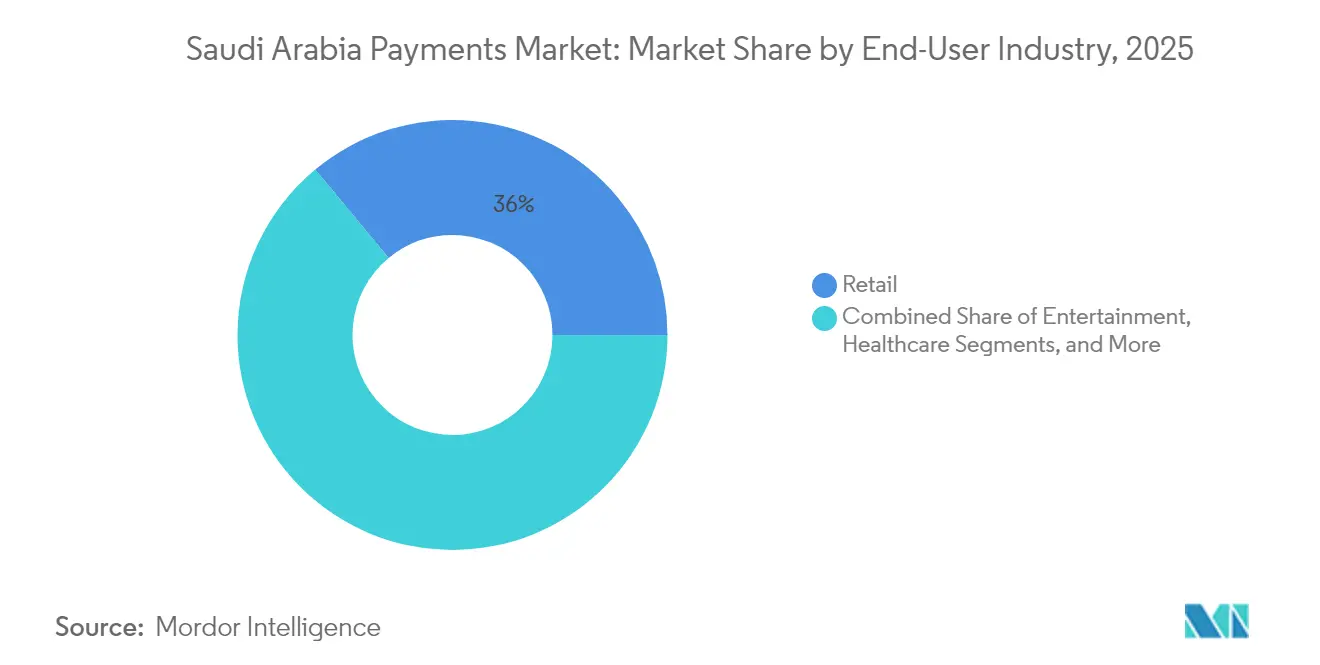
- By mode of payment, point-of-sale transactions held 66.62% of the Saudi Arabia payments market share in 2025, whereas online payments are advancing at an 11.48% CAGR to 2031.
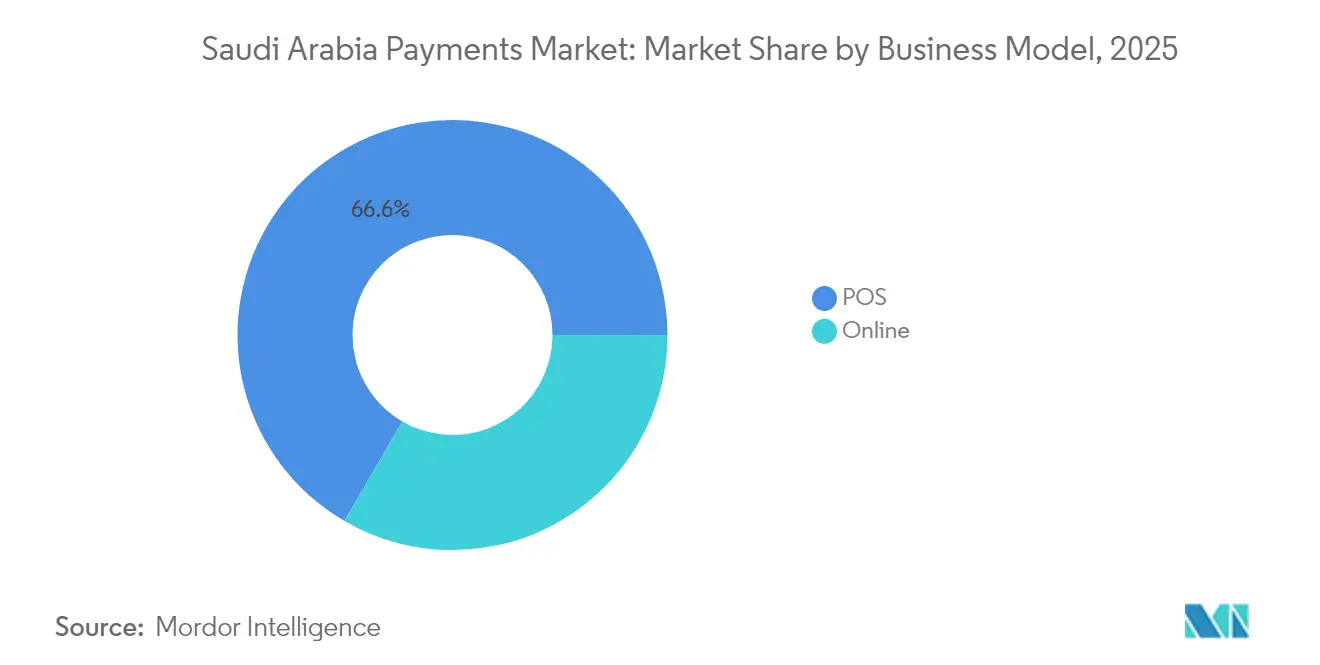
- By end-user industry, retail commanded 36.02% share of the Saudi Arabia payments market size in 2025, while entertainment is forecast to expand at an 11.83% CAGR through 2031.
- By geography, Riyadh contributed 35.02% of 2025 transaction value, while Eastern Province is projected to grow at an 11.21% CAGR between 2026-2031.
Note: Market size and forecast figures in this report are generated using Mordor Intelligence’s proprietary estimation framework, updated with the latest available data and insights as of 2026.
Saudi Arabia Payments Market Trends and Insights
Drivers Impact Analysis*
| Driver | (~) % Impact on CAGR Forecast | Geographic Relevance | Impact Timeline |
|---|---|---|---|
| Escalating e-commerce penetration | +2.1% | National | Medium term (2-4 years) |
| Cashless 2030 targets and instant payments | +2.8% | National | Long term (≥ 4 years) |
| Open-banking framework rollout | +1.7% | National / GCC | Medium term (2-4 years) |
| BNPL surge among youth | +1.9% | Urban centers | Short term (≤ 2 years) |
| Tokenized pilgrim wearables | +0.8% | Makkah and Madinah | Short term (≤ 2 years) |
| Digital Riyal pilots | +1.2% | National | Long term (≥ 4 years) |
| Source: Mordor Intelligence | |||
Cashless 2030 Targets and Instant Payments Infrastructure
SARIE processed transactions worth SAR 2.5 trillion in 2024, delivering sub-second settlement between banks and lowering liquidity costs, which reinforced confidence in the Saudi Arabia payments market.[2]Saudi Central Bank, “Implementation Progress of SARIE & AFAQ,” sama.gov.sa AFAQ complemented SARIE by handling high-volume, low-value government and utility transfers, letting agencies automate disbursements at minimal marginal cost. Private firms leveraged the dual rail architecture to deploy just-in-time supplier payouts, unlocking working-capital efficiencies in manufacturing and petrochemicals. Banks integrated SARIE APIs into corporate cash-management portals, which compressed receivable cycles for exporters shipping to Asian buyers. The real-time rails therefore served as a platform for new revenue streams-from instant payroll to micro-savings products-while building resilience against cross-border correspondent-bank fees.
BNPL Surge Among Youth
Tamara achieved unicorn status at a USD 1 billion valuation in 2024 after raising USD 340 million, illustrating how alternative credit addressed historic gaps in revolving credit access for the Kingdom’s under-35 majority. Tabby shifted its regional headquarters to Riyadh and reached a USD 3.3 billion valuation, signaling the pull of the Saudi Arabia payments market for BNPL pioneers. Summer 2024 BNPL volumes tripled year-on-year as merchants observed a 30% rise in average order values, sparking adoption by offline grocers, electronics chains, and automotive parts retailers.[3]Staff Writer, “Summer 2024 Sees a Boom in Digital Payments,” checkout.com Regulatory sandboxes allowed rapid product iteration while ensuring consumer-protection caps on late-fees, bolstering trust. Fintech lenders simultaneously embedded Sharia-compliant financing logic, widening acceptance among conservative shoppers.
Open-Banking Framework Rollout
Phase 2 of SAMA’s open-banking plan introduced Payment Initiation Services in 2024, permitting licensed third parties to pull funds directly from customer accounts and bypass card networks. Participating banks reported a 15% drop in checkout abandonment on merchant sites that switched to direct-debit rails, highlighting the cost and latency advantages. Fintech newcomers packaged account aggregation with budgeting, payroll, and automated VAT reconciliation, deepening client stickiness. Alignment with international API standards facilitated partnerships with EU and Singaporean providers eager to export technology to the Saudi Arabia payments market. Early adopters witnessed a 25% lift in daily active users across digital channels, confirming open-banking’s role in sustaining engagement beyond basic balance queries.
Tokenized Pilgrim Wearables
Nusuk deployed contactless bracelets for 2 million Hajj pilgrims in 2024, enabling 85% of on-site retail transactions to clear digitally, freeing visitors from cash handling and exchange-rate uncertainties. The wearables used near-field communication linked to multi-currency wallets, settling in real time over SARIE rails. Retailers inside the holy sites saw a 20% reduction in queue times, improving crowd management and compliance with safety protocols. Post-event analytics allowed merchants to tailor inventory for Umrah seasons, illustrating data monetization potential. The initiative showcased how specialized vertical solutions can scale nationally and abroad, reinforcing the competitive appeal of the Saudi Arabia payments market to event-economy innovators.
Restraints Impact Analysis*
| Restraint | (~) % Impact on CAGR Forecast | Geographic Relevance | Impact Timeline |
|---|---|---|---|
| High merchant MDR for cross-border cards | -1.4% | National / border cities | Medium term (2-4 years) |
| Cyber-fraud and data-privacy fears | -0.9% | National | Short term (≤ 2 years) |
| Patchy rural acceptance infrastructure | -1.1% | Rural and secondary cities | Long term (≥ 4 years) |
| Consumer inertia among >55 demographic | -0.7% | National | Long term (≥ 4 years) |
| Source: Mordor Intelligence | |||
High Merchant MDR for Cross-Border Cards
Average fees ranging from 6-12% on international card payments squeezed exporter margins and deterred small retailers from serving overseas tourists. Multi-leg correspondent-bank chains introduced double-FX spreads and delayed settlement, compounding cash-flow constraints. The Saudi Arabia payments market saw fintech entrants pitch corridor-specific solutions that netted 20-40 bps savings by routing remittances through regional hubs. SAMA’s bilateral CBDC experiments with UAE signaled intent to dismantle these cost layers, although production timelines extended beyond 2027. Meanwhile, e-commerce merchants increasingly promoted A2A pay-by-link options for GCC shoppers, circumventing card rails and shifting chargeback risk to issuers.
Cyber-Fraud and Data-Privacy Fears
Payment-related fraud losses totaled USD 140 million in 2024, fueling a 7.52% CAGR cybersecurity spend that reached USD 2.4 billion. Data-localization mandates forced global processors to deploy in-country nodes, raising capex yet enhancing incident-response speeds. Heightened anti-money-laundering checks slowed onboarding for high-risk merchants such as crypto brokers, tempering digital uptake. Consumer surveys highlighted phishing as the top fear, prompting both banks and fintechs to roll out biometric-login, tokenized PAN, and AI-powered anomaly detection. Sustained fraud-education campaigns remain vital to nurturing confidence in the Saudi Arabia payments market.
*Our forecasts treat driver/restraint impacts as directional, not additive. The impact forecasts reflect baseline growth, mix effects, and variable interactions.
Segment Analysis
By Mode of Payment: Digital Channels Redefine Value Creation
Point-of-sale terminals retained 66.62% share in 2025, underscoring the lingering weight of physical commerce within the Saudi Arabia payments market. However, online payments recorded an 11.48% CAGR forecast through 2031 and are capturing incremental value from rapid e-commerce penetration, which grew 9.4% in Q3 2024 alone. The structural pivot reflects changing consumer behavior, deeper logistics reach, and superior mobile-wallet experiences. Retailers embedded mada, Apple Pay, Google Pay, and STC Pay buttons at checkout, minimizing friction. The integration of SARIE APIs into gateway stacks trimmed acquiring fees by up to 30 bps for high-ticket electronics merchants.
A2A transactions gained further traction as corporates adopted real-time salary disbursements, boosting worker liquidity. Digital wallets-such as urpay, which served 5 million customers-extended reach to 180 countries through Mastercard Move rails, consolidating foreign-currency remittances into the Saudi Arabia payments market. Cash-on-delivery contracted as logistics firms bundled QR-code pay-on-arrival options, bringing rural buyers into the formal ecosystem. Contactless penetration surged above 94% of card transactions in urban centers, reflecting pandemic-period behavioral shifts that persisted into 2025. Merchants deployed value-added modules-installments, e-invoicing, e-receipt archiving-to differentiate beyond price, evidencing maturation of service-layer competition.


By End-User Industry: Entertainment Outpaces Retail
Retail payments controlled 36.02% of 2025 transaction value, supported by hypermarkets, convenience stores, and mall clusters that rapidly integrated omni-channel checkout journeys. Yet entertainment transactions are projected to grow at an 11.83% CAGR to 2031 as Vision 2030 investments pour into cinemas, theme parks, and esports arenas. PayOne’s 2025 agreement with SaudiCo equipped hospitality operators with fully reconciled payment stacks, reducing chargebacks by 15% and elevating guest satisfaction. Sports venues adopted facial-recognition ticketing linked to stored-value wallets, enhancing stadium throughput while capturing granular fan-spend analytics.
Healthcare digitization accelerated after Bupa Arabia’s no-pre-approval network served 200 000 members by March 2025, demonstrating frictionless settlement potential in insurance claims. Telemedicine platforms integrated tokenized billing that auto-releases payment upon doctor verification, averting disputed charges. Education providers embraced subscription-style tuition plans billed via open-banking rails, smoothing cashflow for households. The Saudi Arabia payments market therefore diversified from retail dependence toward experience-centric verticals that reward contextual, embedded payment flows. Providers able to tailor sector-specific risk, settlement, and compliance modules secured stickier revenue-reinforcing the competitive premium on specialization.
Geography Analysis
Riyadh accounted for 35.02% of 2025 transaction value, anchored by government payrolls, corporate treasuries, and a concentration of fintech headquarters. The capital’s high smartphone penetration continued to foster early adoption of biometric and IoT payments. Eastern Province’s 11.21% CAGR outlook between 2026-2031 stemmed from petrochemical diversification, port-linked free-trade zones, and cross-border commerce with Bahrain and Kuwait, which together elevated high-value B2B flows that now settle in real time via SARIE. Investors funneled USD 330 billion into industrial and logistics megaprojects, driving demand for treasury, procurement-financing, and supplier-payment automation.
Makkah’s unique religious-tourism economy accelerated digital-wallet penetration through Nusuk’s contactless solution, which processed 85% of retail spend inside holy sites during the 2024 Hajj season. Visa-on-arrival pilgrims used multi-currency wallets, cutting FX leakage and queuing. Secondary cities such as Tabuk, Abha, and Al-Ahsa lagged infrastructure readiness yet benefited from mobile-network rollouts and agent-bank programs that seeded QR acceptance in convenience stores. The Rest-of-Saudi cohort nevertheless represented a vital inclusion frontier: 4.2 million migrant workers remitted wages each month, suggesting a material untapped slice of the Saudi Arabia payments market awaiting low-cost wallet-to-wallet corridors.
Regulatory Landscape
Saudi Arabia's payments sector is anchored by the Law of Payments and Payment Services (Royal Decree M/26, 2021) and the 2023 Implementing Regulations, with the Saudi Central Bank (SAMA) acting as the primary regulator for payment systems, operators, and payment service providers. In March 2026, SAMA issued an updated Oversight Framework of the Payment Systems and Their Operators, replacing the 2021 version and tightening supervisory expectations for domestic rails and the entities that run or connect into them.
Adjacent rulebooks shape operating requirements for digital commerce and data handling. The E-Commerce Law (Royal Decree M/126, 2019) continues to govern online commercial transactions, including registration obligations for online stores, while the Digital Government Authority provides overarching digital governance frameworks that affect data management and interoperability expectations across public-facing digital services. SAMA circulars across 2024 to 2025 also updated compliance requirements for activities such as electronic wallets and e-commerce payment service and support providers, tightening market-entry and ongoing-control expectations for both banks and fintechs.
Value Chain Analysis
The Saudi Arabia payments value chain begins with scheme and rail operators, led by Saudi Payments (mada) for domestic card interoperability and national acceptance, and real-time and batch settlement infrastructure used by banks and other payment participants. Issuer and acquirer banks sit on top of these rails, supported by SAMA licensing and oversight under the Law of Payments and Payment Services, with compliance requirements reinforced by updates such as SAMA's March 2026 Oversight Framework. The acceptance layer includes payment gateways, payment technical service providers for e-commerce enablement, POS/ATM deployers, and merchant aggregators that integrate mada and wallet options into checkout across physical and digital channels.
On the demand side, merchants (retail, hospitality, entertainment, and government-related collections and disbursements) drive transaction volume, while consumer-facing apps and wallets package authentication, tokenization, and value-added features such as installments and loyalty (for example, STC Pay moving into stc Bank, and global wallets such as Apple Pay). Enablers include KYC and identity services, fraud and cybersecurity vendors, and orchestration platforms that unify multiple acquirers and gateways for large merchants. Key bottlenecks and control points in the chain remain SAMA licensing and governance, mandatory interoperability with national infrastructure (especially mada acceptance norms), and data governance requirements that shape processor deployment and operating models.
Competitive Landscape
The Saudi Arabia payments market displayed a moderate concentration level, with mada rails underpinning every card transaction but competition flourishing in overlay services. Geidea captured 75% of the national ATM fleet and equipped 150 000 merchants with omnichannel gateways, illustrating scale advantages in hardware-as-a-service. International schemes deepened roots: Visa opened an Innovation Center in Riyadh in 2024, while Mastercard launched local processing infrastructure to meet data-residency mandates. Meanwhile, STC Pay leveraged its 10-million-user base to spin off stc Bank, securing SAMA approval in January 2025 with SAR 2.5 billion capitalization and broadening competition into digital banking.
Strategic alliances multiplied. Telr partnered with Bank AlJazira in February 2025 to bundle BNPL, fraud, and e-invoice modules for SME merchants. Al Rajhi Bank integrated its Makafaa rewards scheme into 60 000 Salla e-stores, pushing closed-loop loyalty across the Saudi Arabia payments market. Cross-border corridors remained white space: UnionPay’s July 2024 tie-up with Saudi Awwal Bank aimed to lure Asian tourists by expanding acceptance, while banks contemplated blockchain-based corridors to slash sender fees. Competitive intensity therefore shifted from basic acquiring to data analytics, embedded finance, and ecosystem partnerships, signaling a marketplace where technological agility outranked legacy scale.
Saudi Arabia Payments Industry Leaders
Saudi Payments Company (mada network)
STC Bank (STC Pay Wallet)
Visa Inc.
Mastercard Inc.
Hyperpay Inc.
- *Disclaimer: Major Players sorted in no particular order

Market Opportunities and Future Outlook
White space is forming in regulated account-to-account and bank-connected commerce flows as SAMA's open-banking direction (including payment initiation) and the broader Law of Payments and Payment Services framework shift checkout value away from pure card-based routing. Merchants are adopting lower-friction, direct-debit style alternatives in e-commerce, creating room for payment service providers and gateways to build differentiated stacks around reconciliation, refunds, chargeback avoidance, and fraud controls that fit local rails (mada, SARIE, and government-linked transfer use cases). The government-led Financial Sector Development Program (Vision 2030) provides a clear demand signal for digital payments expansion, supported by the FinTech Strategy targeting 525 fintech companies by 2030 and prioritizing areas such as KYC digitalization and the use of AI in financial services.
Infrastructure modernization and licensing also create opportunities for specialized providers across the acceptance and enablement layers. Electronic payments reached 85% of total retail payments in 2025, up from 79% in 2024, supporting continued merchant investment in omnichannel acceptance, wallet buttons, and orchestrated routing that can reduce decline rates and operating complexity. At the same time, SAMA's expanding perimeter for licensed activities (including PTSP-style e-commerce enablement and regulated consumer finance models for installments and BNPL) supports compliant entrants serving SMEs with packaged solutions such as gateway plus invoicing plus risk tools, while established acquirers add higher-margin services beyond transaction processing.
Recent Industry Developments
- July 2026: TotalPay received Saudi Central Bank (SAMA) approval to operate as an Ecommerce Payment Technical Service Provider (PTSP) in the Kingdom. The authorization expands the licensed supplier base for merchant-facing payment infrastructure and supports faster onboarding and integration for online sellers that need compliant payment enablement.
- June 2026: Tabby secured consumer finance and SME finance licenses from SAMA, broadening the set of regulated installment and financing products it can offer through merchant checkouts. The move strengthens licensed BNPL-style propositions in Saudi Arabia and increases competitive pressure on banks and fintechs offering short-tenor credit at the point of sale.
- September 2025: Mastercard collaborated with HyperPay to advance business payments capabilities across the region, strengthening HyperPay's card-network alignment for merchant and enterprise use cases. The partnership supports broader acceptance and value-added service rollout for merchants operating across online and in-store channels.


Research Methodology Framework and Report Scope
Market Definition and Coverage
For this study, the Saudi Arabia payments market is defined as the value of consumer and business payments made inside the Kingdom through point-of-sale and online or e-commerce channels, covering card payments, digital wallets, cash, and other noncash instruments used to complete a purchase.
Scope exclusions: Online purchases of motor vehicles, real estate, utility bills, mortgages, loans, credit-card bill payments, and securities (shares and bonds) are excluded from the e-commerce boundary.
Segmentation Overview
- By Payment Mode
- Point-of-Sale (POS)
- Debit Card Payments
- Credit Card Payments
- A2A Payments
- Digital Wallet
- Cash
- Other Point- of-Sale (POS) Payment Modes
- Online (E-commerce and In-app)
- Debit Card Payments
- Credit Card Payments
- A2A Payments
- Digital Wallet
- Cash-on-Delivery
- Other Online Sale Payment Modes
- Point-of-Sale (POS)
- By End-User Industry
- Retail
- Entertainment
- Healthcare
- Hospitality
- Other End-User Industries
Data Sources, Market Sizing, and Validation
Desk Research
We start by mapping the payments ecosystem in Saudi Arabia and the main rails that move transaction value across POS and online channels, then we line up consistent public data series for the same time window. In practice, desk work relies on sources such as Saudi Central Bank (SAMA) statistical releases, Ministry of Communications and Information Technology digital economy updates, General Authority for Statistics publications, and official payments and fintech policy documents linked to Vision 2030. We also review central bank circulars and licensing announcements, plus audited company filings, investor presentations, and reputable press coverage to understand channel shifts and product updates that can distort year-to-year comparisons.
To reduce the risk of model inputs being driven by a single document type, we cross-check totals using comparable indicators like POS transaction value, e-commerce card spend, terminal deployment trends, and consumer cashless share statistics that are publicly discussed. Where needed, we use paid subscriptions for company financial intelligence, news and financials, and patent databases to validate operating footprints and product timelines, especially when public disclosures are limited. The desk sources listed above are illustrative and not exhaustive, and many other references were used for data collection, validation, and research clarification.
Primary Interviews and Surveys
Next, we validate the desk findings with structured interviews and surveys with payment processors, acquiring-side stakeholders, banks and fintech operators, large merchants, and sector specialists who track retail and online checkout behavior. Because this is a country-specific market, we prioritized coverage across major commercial hubs and merchant categories, then used the discussions to confirm adoption drivers (such as contactless use and wallet routing), fill gaps on instrument mix, and sanity-check the implied averages behind the value model.
Distribution of primary research fieldwork respondents
| Company type | Respondent position | Region |
|---|---|---|
| Top tier: 25% | CXOs: 13% | |
| Mid tier: 61% | Functional/Unit leaders: 43% | |
| Smaller Players: 14% | Managers: 44% |
Market-Sizing & Forecasting
Market sizing is built using a top-down and bottom-up approach, where national payment activity is reconstructed from channel-level signals and then reconciled with practical supplier and merchant checkpoints. On the top-down side, we translate Saudi Arabia POS and e-commerce activity into a consistent value pool by aligning what is counted as a purchase transaction, then applying filters that separate included commerce from excluded bill payments and financial transfers.
To keep the model grounded, a short set of market fingerprints is tracked and refreshed through the time series, such as POS transaction value trends, e-commerce spending growth for domestic card rails, cashless share in retail transactions, changes in acceptance infrastructure (for example, the installed POS base), and shifts in wallet usage for everyday purchases. These inputs help explain why value moves even when transaction counts do not, and they also reduce the risk of double-counting when consumers use mixed methods like cash-on-delivery alongside digital checkout steps.
For forecasting, we mainly use scenario analysis supported by trend smoothing on the key variables, since policy targets and adoption curves can change the slope quickly in payments. Assumptions on channel mix, average ticket movement, and online penetration are stress-tested with primary feedback. Where bottom-up checks are incomplete, we use sampled ASP-to-volume logic for representative merchant groups before scaling totals to match the top-down envelope.
Data Validation & Update Cycle
We validate the modeled market values by triangulating outputs against independent signals such as publicly reported POS values, e-commerce card spend markers, and the observed cashless share trend, then we investigate variances that do not follow the direction of these indicators. When outliers appear, the assumptions are rechecked, and follow-up calls are triggered to confirm whether the change is real (for example, a regulatory shift) or a timing and definition issue.
Before sign-off, a multi-step analyst review is done to confirm that scope rules were applied consistently and that the time series does not contain breaks caused by methodology changes in source reporting. The report is refreshed annually, and interim updates are made when material events occur, such as major rule changes, new payment licensing updates, or step-changes in e-commerce behavior. Right before delivery, a final freshness pass is completed so clients receive the latest updated view based on newly available releases.
Mordor Intelligence's Saudi Arabia Payments Market Size Measured Against Other Published Estimates
Published market sizes for Saudi Arabia payments can look far apart because authors do not always count the same transaction boundaries, and the line between commerce payments and bill or transfer activity is treated differently. Differences also show up when one estimate focuses mainly on card value, while another mixes card, wallet, and cash measures without a single reconciliation rule.
By tracking POS and e-commerce value checks and refreshing exclusions for non-commerce items, Mordor Intelligence keeps the estimate tied to purchase payments rather than broader money movement, which is a common source of overstatement. The spread is also influenced by how currency conversion timing is handled, whether cash-on-delivery is treated as part of online commerce, and how aggressively future digital adoption is assumed under Vision 2030 targets.
Benchmark comparison
| Source | Market Size | Gaps in Research Methodology |
|---|---|---|
| Mordor Intelligence | USD 181.13 B (2025) | |
| Trade Journal A | USD 178.18 B (2024) | Uses POS transaction value reporting as a primary anchor for one year, which can under-represent total payments when online card and wallet flows are not fully consolidated into the same market boundary. |
| Data Provider Brief B | USD 146.80 B (2024) | Centers the estimate on card payments only, so wallet-routed payments and cash components are not captured, and the scope can also exclude certain merchant payment types treated as non-card transfers. |
Overall, the comparisons point to scope and instrument coverage as the biggest drivers of variance, followed by differences in year selection and how fast digital mix is assumed to shift. Our approach stays repeatable because it ties the value model to observable channel indicators, applies consistent inclusion rules, and then validates the totals through targeted expert checks before finalizing the market size.


Key Questions Answered in the Report
How large was the Saudi Arabia payments market in 2026?
USD 199.86 billion in 2026.
What CAGR is forecast for transaction value through 2031?
Aggregate value is projected to rise at a 10.34% CAGR, taking total volume to USD 326.83 billion by 2031
Which payment segment is growing fastest?
Online payments are forecast to post an 11.48% CAGR as e-commerce penetration deepens and A2A rails bypass card fees.
Why is Eastern Province considered a high-growth region?
Industrial digitization, port-centric trade, and cross-border links to Bahrain and Kuwait are driving an 11.21% CAGR outlook.
How is BNPL reshaping consumer spending?
BNPL providers like Tamara and Tabby enable flexible checkouts, boosting average order values and widening credit access for the under-35 demographic.
What role do SARIE and AFAQ play in market development?
They provide instant and batch settlement rails, cut liquidity costs, and underpin new use-cases such as instant payroll and pilgrim wallets.
Page last updated on:


