
Market Overview
| Study Period | 2020 - 2031 |
|---|---|
| Forecast Data Period | 2026 - 2031 |
| Historical Data Period | 2020 - 2024 |
| Market Size (2026) | USD 29.02 Billion |
| Market Size (2031) | USD 50.80 Billion |
| Growth Rate (2026 - 2031) | 11.86 % |
| Market Concentration | Medium |
Major Players *Disclaimer: Major Players sorted in no particular order Image © Mordor Intelligence. Reuse requires attribution under CC BY 4.0. | |
Saudi Arabia Mobile Payments Market Analysis by Mordor Intelligence
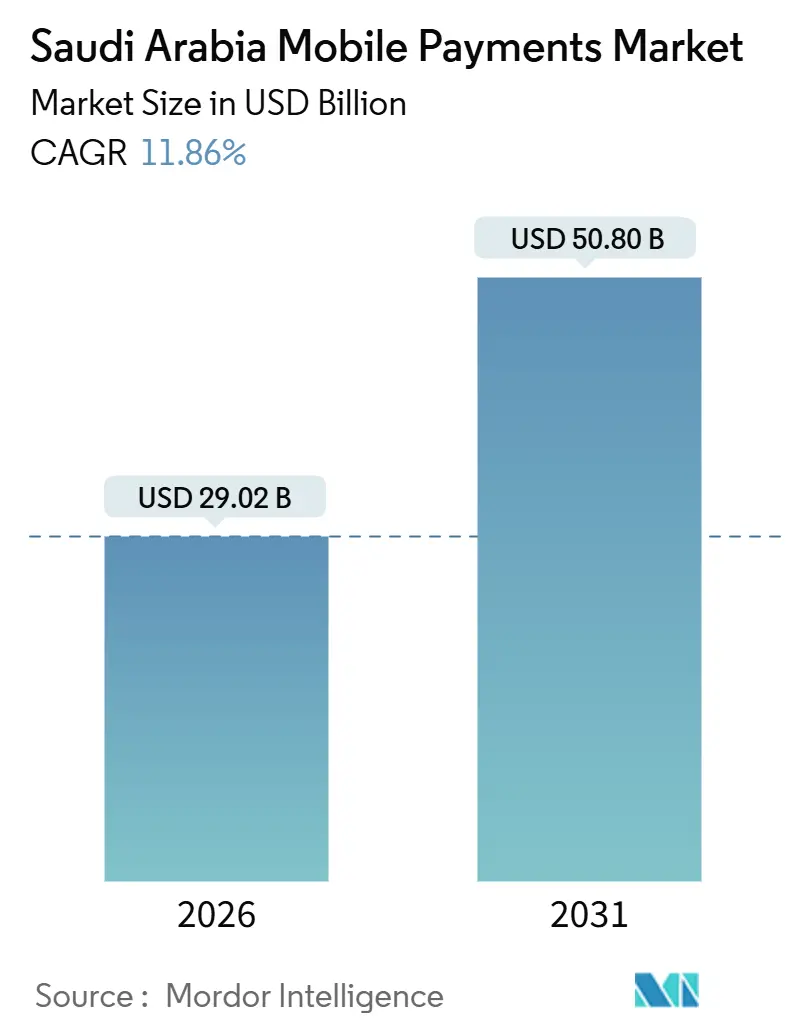
The Saudi Arabia mobile payments market size was valued at USD 29.02 billion in 2026 to reach USD 50.8 billion by 2031, at a CAGR of 11.86% during the forecast period (2026-2031). This headline growth traces directly to Vision 2030’s cash-lite mandate, which pushed electronic payments to 79% of all retail transactions in 2024. Mandatory integration with SAMA’s Sarie rails, the world-leading 5G coverage that now reaches more than 90% of residents, and a tech-savvy consumer base have combined to propel the Saudi Arabia mobile payments market ahead of most emerging peers. Proximity payments still dominate everyday commerce, yet remote payments are scaling faster as e-commerce volumes climb. Competitive intensity is building rapidly: 224 licensed fintechs were active by mid-2024, and SAMA targets 525 entities by 2030.1 While fraud concerns and QR-code fragmentation create friction, the medium-term outlook remains strongly positive because regulators, telcos, and payment providers are strategically aligned on a digital-first payment future.
Key Report Takeaways
- By payment type: Proximity payments led with 57.45% of Saudi Arabia mobile payments market share in 2025; remote payments are on pace for a 15.05% CAGR through 2031.
- By transaction type: In-store POS maintained 45.30% share of the Saudi Arabia mobile payments market size in 2025, while peer-to-peer transfers post the fastest 15.85% CAGR through 2031.
- By application: Retail and e-commerce represented 38.40% of the Saudi Arabia mobile payments market size in 2025; government and public-sector payments are accelerating at a 14.35% CAGR to 2031.
- By end-user: Personal users accounted for 83.25% of the Saudi Arabia mobile payments market share in 2025, yet the business segment is growing at 17.05% CAGR.
Note: Market size and forecast figures in this report are generated using Mordor Intelligence’s proprietary estimation framework, updated with the latest available data and insights as of 2026.
Saudi Arabia Mobile Payments Market Trends and Insights
Drivers Impact Analysis*
| Driver | (~) % Impact on CAGR Forecast | Geographic Relevance | Impact Timeline |
|---|---|---|---|
| Mandatory adoption of SAMA's Sarie instant-payments rails | + 3.2% | National, with concentration in Riyadh, Jeddah, Dammam | Medium term (2-4 years) |
| 5G-enabled smartphone ubiquity | +2.8% | National, with early gains in major cities | Short term (≤ 2 years) |
| Vision 2030 cash-lite targets & fiscal incentives | +2.1% | National, government-led initiatives | Long term (≥ 4 years) |
| Pilgrim-service digital wallets (Hajj & Umrah) | +1.9% | Mecca, Medina, with international pilgrim impact | Medium term (2-4 years) |
| Real-time payroll disbursement via WPS mobile channels | +1.6% | National, with SME sector focus | Short term (≤ 2 years) |
| Source: Mordor Intelligence | |||
Mandatory Adoption of SAMA’s Sarie Instant-Payments Rails
Sarie processed 10.8 billion real-time transactions in 2024, a 24% annual surge that reset consumer expectations for always-on, sub-second settlement.[2] Settlement fees below SAR 1 encourage merchants to reroute small-ticket sales through Sarie, trimming card costs and freeing liquidity in the banking system. The alias-based address scheme, which lets payers use a mobile number rather than an IBAN, removed the friction that previously deterred unbanked users. Local banks now prioritize Sarie rails for both retail and treasury flows, shrinking dependence on global correspondent networks and giving domestic providers a speed and cost advantage over foreign rivals.
5G-Enabled Smartphone Ubiquity
GCC markets already lead the world in 5G adoption, and Saudi Arabia contributes the bulk of that penetration with 73% of mobile subscriptions expected to be 5G by 2026.[3] Average smartphone traffic exceeded 18 GB per month in 2024, unlocking biometric, augmented-reality, and AI-embedded payment use cases. Apple’s Express Mode roll-out on Riyadh Metro exemplifies frictionless contactless transit and reinforces mass-market familiarity with mobile wallets. Ultralow latency also enables in-app fraud scoring in milliseconds, a prerequisite for Sarie-speed settlement. Collectively, network readiness closes the gap between experimental pilots and mainstream deployment.
Vision 2030 Cash-Lite Targets & Fiscal Incentives
The Financial Sector Development Program stipulates that non-cash instruments must represent 80% of retail volume by 2030, only one point above the 79% already reached in 2024.[4] Ministries now pay suppliers solely through electronic rails, nudging micro-merchants to acquire POS or softPOS solutions or risk losing public contracts. A sandbox regime fast-tracks licensing for novel payment products, compressing time-to-market and crowding the field with agile entrants. Tax offsets for digital receipts and penalties for excess cash use create a financial bias that merchants cannot ignore. As acceptance rises, the Saudi Arabia mobile payments market experiences reinforcing network effects between consumers and merchants.
Pilgrim-Service Digital Wallets (Hajj & Umrah)
Nusuk Wallet, introduced by Saudi National Bank and the Ministry of Hajj, processed pilgrim payments for more than 2 million visitors in its inaugural season. Biometric onboarding sidesteps local KYC constraints for foreign visitors, while AI-powered controls curb fraud in peak weeks. Concentrated seasonal volumes provide a stress-test for scale; success signals to global investors that Saudi payment infrastructure can handle cross-border flows. Regulatory learnings from this niche extend to wider cross-border remittance innovation, anchoring Saudi Arabia’s ambition to become a regional payment hub.
Restraints Impact Analysis*
| Restraint | (~) % Impact on CAGR Forecast | Geographic Relevance | Impact Timeline |
|---|---|---|---|
| Fraud & cyber-security concerns | -1.8% | National, with higher impact in rural areas | Short term (≤ 2 years) |
| Low acceptance by micro-merchants outside tier-1 cities | -1.4% | Secondary cities, rural areas | Medium term (2-4 years) |
| Fragmented QR standards slowing interoperability | -1.1% | National, with concentration in retail sectors | Medium term (2-4 years) |
| Data-localisation hurdles for foreign wallet providers | -0.9% | National, affecting international players | Long term (≥ 4 years) |
| Source: Mordor Intelligence | |||
Fraud & Cyber-Security Concerns
A recent user study showed 39% of Saudis dissatisfied with payment security, while 35% remain wary of transaction traceability. SAMA’s Counter-Fraud Framework obliges providers to invest heavily in prevention, detection, and response, stretching the budgets of start-ups that already face intense customer-acquisition costs. AI-based scoring reduces chargebacks but occasionally blocks legitimate transfers, harming user trust. The attack surface expands as payment volumes soar, making continuous security upgrades non-negotiable for providers seeking scale.
Low Acceptance by Micro-Merchants Outside Tier-1 Cities
For merchants in secondary cities, terminal acquisition costs, patchy broadband, and limited digital literacy still deter POS deployment. Customers in rural regions cling to cash due to banking gaps, dampening merchant incentives to invest in acceptance technology. The resulting geographic divide slows inclusive market penetration and leaves untapped volume on the table for ambitious providers that can craft ultra-low-cost, offline-capable solutions.
*Our forecasts treat driver/restraint impacts as directional, not additive. The impact forecasts reflect baseline growth, mix effects, and variable interactions.
Segment Analysis
By Payment Type: Remote Surge Challenges Proximity Dominance
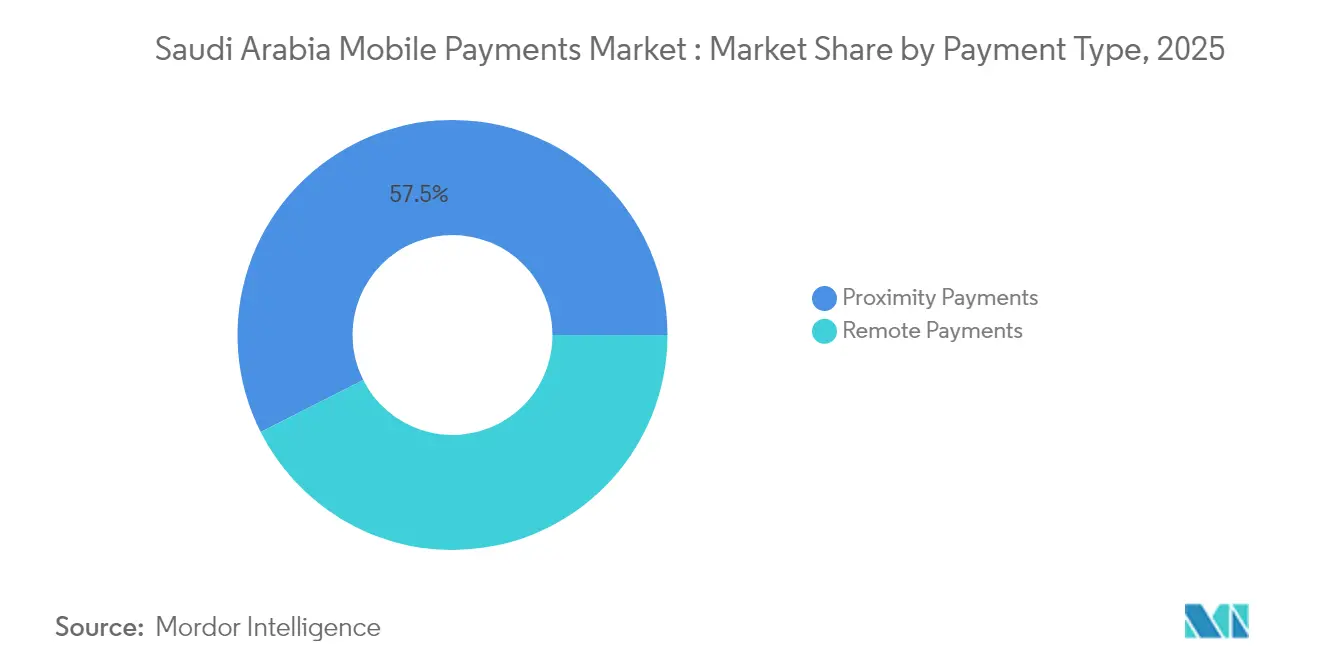
Proximity payments accounted for 57.45% of Saudi Arabia mobile payments market share in 2025, supported by more than 1 million POS terminals. Yet remote payments are climbing at a 15.05% CAGR to 2031 as e-commerce sales and government e-service fees migrate online. Contactless readiness is wide-spread—94% of card holders tapped in 2024—signaling comfort with device-based payments. Driven by 5G speed, remote channels integrate AR shopping and voice checkout that play to Saudi consumers’ high mobile data appetite.
In-app government payments via Absher, covering more than 700 services, create recurring remote volumes that deprioritize cash. Apple Pay’s transit launch validates proximity use cases, while the Ministry of Communications authorizes non-banks to embed payments in consumer apps, widening the provider pool. Providers that master omnichannel orchestration will secure mindshare as shoppers blend remote browsing with in-store pickup, gradually shifting wallet share away from plastic cards and towards the Saudi Arabia mobile payments market.

By Transaction Type: P2P Growth Outpaces Traditional Commerce
In-store POS preserved 45.30% of Saudi Arabia mobile payments market size in 2025, reflecting high foot-traffic retail and food-service spending. P2P transfers, however, post a brisk 15.85% CAGR as real-time payroll and remittance flows migrate to wallets. Mada card e-commerce spending hit SAR 197.42 billion (USD 52.6 billion) in 2024, underscoring a sizable person-to-merchant pool. Bill-pay and fee collection segments register steady but less dramatic gains.
Momentum in P2P stems from eight-million-strong STC Pay users sending salaries, allowances, and micro-loans in seconds. International remittances are also digitalizing, eroding money-transfer agents’ share. Diversified use cases hedge providers against cyclical retail spending and distribute profit streams across multiple verticals.
By Application: Government Sector Acceleration Reshapes Market Dynamics
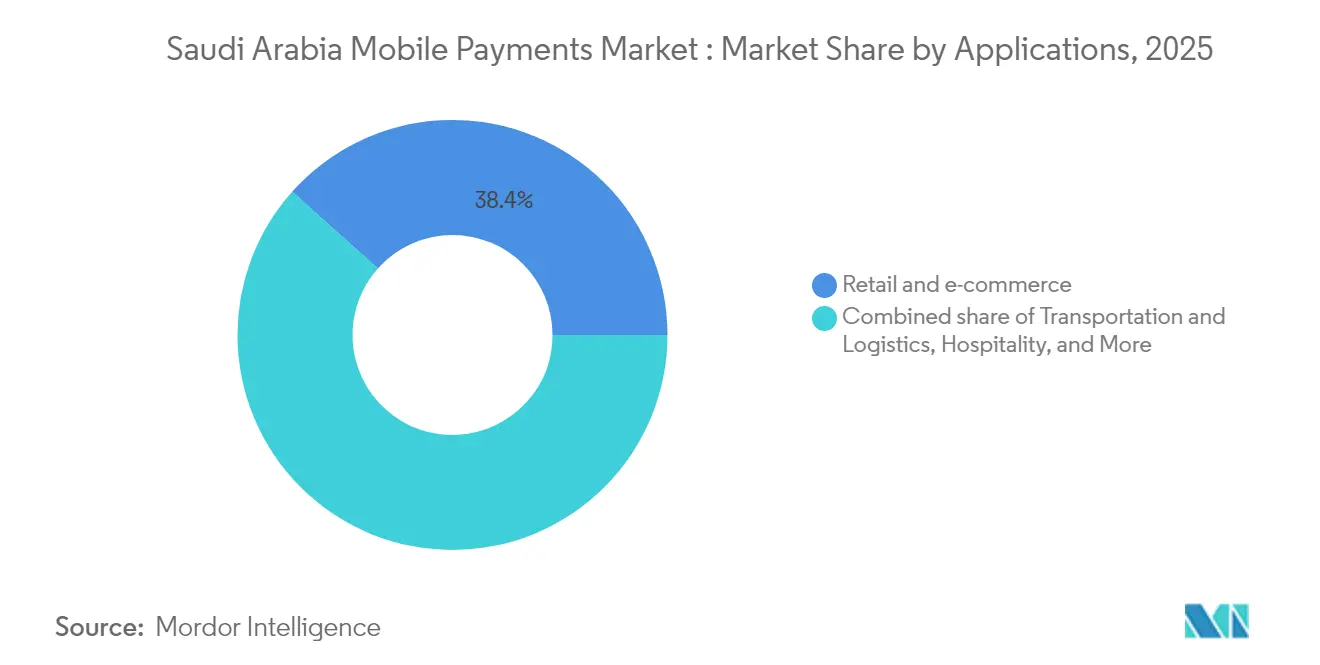
Retail and e-commerce maintained 38.40% of Saudi Arabia mobile payments market size in 2025, fueled by consumer spending and high smartphone engagement. Government applications clock the fastest 14.35% CAGR as Absher completed 430 million e-transactions in 2024. Transportation payments ride Apple Pay’s metro rollout, while hospitality leverages growing tourism demand.
Education payments through SADAD reached SAR 1 billion (USD 267 million) in 2024, a 4.3% uptick on digital tuition settlement. Healthcare remains small but shows promise, with eHealth–Fintech pilots forecasting transaction values of USD 87.14 billion by 2028. Application diversification spreads risk and opens tailored solution lanes, such as pilgrim wallets and sector-specific APIs, across the Saudi Arabia mobile payments market.
By End-User: Business Segment Momentum Signals Enterprise Digitization
Personal wallets still dominate with 83.25% share, but enterprise payments are scaling at 17.05% CAGR. SMEs embrace mobile interfaces to pay suppliers, settle utility bills, and reimburse staff, aligning with Vision 2030’s SME empowerment agenda. The fintech workforce passed 7,000 employees in 2024, supplying domain talent that codes B2B workflows into consumer-grade app designs.
Enterprise adoption rises on the back of Sharia-compliant digital products, Arabic interfaces, and seamless ERP plugins. As firms swap checks for Sarie rails and audit-friendly wallets, the Saudi Arabia mobile payments market shifts from consumer novelty to core corporate infrastructure, presenting white-space for providers skilled in treasury-grade security and complex approvals.
Geography Analysis
Major metropolitan corridors—Riyadh, Jeddah, and Dammam—collectively host more than 95% 5G penetration and the densest POS networks, underpinning 79% national e-payment adoption in 2024. Riyadh anchors fintech headquarters and early Open-Banking pilots, giving capital-region consumers first access to cutting-edge wallet features. The Eastern Province channels industrial B2B payments through Sarie, while the Western Province caters to pilgrim wallets during peak religious seasons.
Mecca and Medina process concentrated seasonal volumes as over 2 million pilgrims transact through the Nusuk Wallet each year, spurring infrastructure investment that can be repurposed for local commerce outside pilgrimage windows. Secondary cities such as Abha and Tabuk lag due to patchy broadband and lower merchant readiness, yet government programs targeting 80% cash-less payments by 2030 incentivize banks to deploy softPOS and QR-code schemes tailored for smaller merchants. Rural areas remain cash-centric, though mobile connectivity expansion gradually widens the addressable user base.
SAMA’s national framework allows regional sandboxes; hence fintechs run geo-targeted pilots—e.g., agriculture wallet trials in Al-Qassim—before scaling nationwide. Cross-border functionality clusters in commercial hubs, but Nusuk’s success suggests broader potential for specialized foreign-exchange wallets. Providers must reconcile a patchwork of urban sophistication and rural constraints as they plot roll-out roadmaps across the Saudi Arabia mobile payments market.
Regulatory Landscape
The Saudi Central Bank (SAMA) is the primary regulator and supervisor for payment systems and payment service providers in Saudi Arabia, with the Law of Payments and Payment Services (Royal Decree No. M/26, 2021) and its Implementing Regulations (June 2023) forming the core legal framework. Under this regime, payment providers are licensed into categories such as Major Payment Institution (Major PI) and Micro Payment Institution (Micro PI), which shape capital, governance, and activity scope for wallet, acceptance, and transfer propositions.
SAMA rulebook requirements also anchor operational compliance for mobile payments, including technical and security expectations such as PCI-DSS alignment, data governance, and interoperability rules across payment systems. Supervisory updates are communicated through SAMA circulars, including a March 2026 update related to oversight of payment system operators, which reinforces the compliance burden for wallet providers, acquirers, and payment platforms integrating with national rails.
Competitive Landscape
The Saudi Arabia mobile payments market features 224 licensed fintechs plus global brands, yielding a moderately fragmented competitive field. Domestic leader STC Pay enjoys an 8-million-strong customer base, while Mada Pay leverages the national card switch and Al Rajhi Wallet differentiates on Sharia compliance. Apple Pay commands over 20% wallet usage on Saudi web checkouts, the highest share worldwide. Strategic differentiation hinges on regulatory mastery, local partnerships, and vertical specialization.
Players allocate capital toward SAMA’s Counter-Fraud compliance, Open-Banking APIs, and merchant acquisition campaigns. For example, Mastercard’s data-localization project and Amazon Payment Services’ gateway partnership broaden acquirer choice for thousands of merchants. Telr’s alliance with Saudi Awwal Bank adds BNPL, QR, and payment-link features for SMEs, plugging acceptance gaps outside tier-1 cities.
Emerging disruptors deploy AI fraud analytics, blockchain settlement, and biometric authentication to capture niches such as cross-border micro-remittances and healthcare wallets. Incumbent banks counter with ecosystem plays, embedding payments into super-apps that bundle savings, credit, and lifestyle offers. Competitive intensity is poised to heighten as SAMA targets 525 licensed fintechs by 2030, forcing consolidation or strategic alliances to achieve scale within the Saudi Arabia mobile payments market.
Saudi Arabia Mobile Payments Industry Leaders
-
BayanPay (Bayan Payments Ltd.)
-
Alinma Pay (Alinma Bank))
-
Apple Pay (Apple Inc.)
-
Saudi Digital Payments Co.
-
Mada Pay (Saudi Payments)
- *Disclaimer: Major Players sorted in no particular order

Market Opportunities and Future Outlook
The most immediate whitespace remains merchant digitization outside tier-1 cities, where low-cost acceptance tools (softPOS, QR, and payment links) can reduce reliance on terminal-heavy rollouts while fitting the Kingdom's cash-lite direction. Government digital services also provide a workable onboarding channel for remote payments, with platforms such as Absher already generating large transaction volumes that normalize in-app payments across fees and renewals.
Cross-border and seasonal inbound use cases offer a second differentiation lane for mobile-payment propositions. Pilgrimage-linked wallets already demonstrate high-throughput onboarding and payment processing during Hajj and Umrah, and that operating experience can carry into broader FX and remittance offers for visitors and residents. On the B2B side, SMEs and enterprises are digitizing payroll and spend workflows, which supports demand for wallet-linked payouts, prepaid instruments, and controls built on top of domestic instant-payment rails and regulated payment-initiation capabilities under SAMA frameworks.
Recent Industry Developments
- January 2026: STC Bank collaborated with Mastercard to integrate Mastercard Move for cross-border remittances from Saudi Arabia to 120 countries. This expands cross-border remittance capability and improves international payout reach within the mobile payments landscape.
- September 2025: Alinma Bank signed a strategic memorandum of understanding with KamelPay to provide automated payroll solutions and prepaid cards for employees. The move expands SME payroll services and corporate spend capabilities within the Saudi mobile payments ecosystem.
- September 2025: Alinma Bank announced a strategic investment and partnership with corporate spend management platform Qashio. The collaboration strengthens SME and corporate spend analytics and control across the market.
Research Methodology Framework and Report Scope
Market Definition and Coverage
This market covers the value of payments initiated on a mobile device in Saudi Arabia, across in-store proximity transactions and remote digital payments. It includes consumer and business use cases where the payment instruction is completed through a mobile wallet, banking app, or a similar mobile interface.
Scope exclusions: Excludes pure cash transactions, and also excludes backend-only processing revenue where no mobile-initiated payment is made by the end user.
Segmentation Overview
- By Payment Type
- Proximity Payments
- Remote Payments
- By Transaction Type
- Peer-to-Peer (P2P)
- In-store Point-of-Sale (POS)
- Person-to-Merchant (P2M/Checkout)
- Other Transaction Types
- By Application
- Retail and eCommerce
- Transportation and Logistics
- Hospitality and Food-Service
- Government and Public Sector
- Other Applications (Education, Healthcare)
- By End-user
- Personal
- Business
Data Sources, Market Sizing, and Validation
Desk Research
Desk work started with mapping the payments context for Saudi Arabia, and then tightening it to what is truly mobile-initiated. We relied on public, non-paywalled sources such as Saudi Central Bank (SAMA) publications, Saudi Payments and mada ecosystem updates, General Authority for Statistics (GASTAT) datasets, Communications, Space and Technology Commission (CST) indicators on connectivity, and Ministry of Communications and Information Technology (MCIT) digital economy materials. These inputs help ground the model in shifts in transaction behavior, acceptance infrastructure, and digital access.
To make the desk model usable, we also reviewed annual reports, investor presentations, and press releases from payment ecosystem participants, then checked reputed business press coverage for rollout timing and regulation changes. In parallel, we used paid subscriptions for company financials and for news and financials to cross-check entity activity and avoid missing structural events. The source list above is illustrative only, and additional public sources were used for data collection, validation, and research clarification.
Primary Interviews and Surveys
Primary discussions were used to translate desk signals into adoption and value assumptions, especially where public reporting is not consistent across payment types. We spoke with a mix of issuers, acquirers, wallet operators, merchants, and enabling service providers so our assumptions on use case mix, fee pass-through, and growth drivers could be confirmed and adjusted.
Since this is a single-country market, fieldwork emphasized coverage across major metro demand centers and secondary cities, and then it was balanced with inputs from retail, e-commerce, transport, and hospitality merchants to avoid over-indexing on one channel.
Distribution of primary research fieldwork respondents
| Company type | Respondent position |
|---|---|
| Top tier: 25% | CXOs: 16% |
| Mid tier: 59% | Functional/Unit leaders: 30% |
| Smaller Players: 16% | Managers: 54% |
Market-Sizing & Forecasting
Sizing was built by reconstructing the addressable payment value pool using country-level electronic payment signals, and then filtering that pool with mobile-usage and channel indicators so only mobile-initiated transactions remain. We keep the top-down and bottom-up logic together because the model is corrected at each step, but the starting point is top-down using payments-system and retail transaction series.
Next, selective bottom-up approximations were applied to keep totals realistic, using sampled checks such as active wallet base times observed use frequency, and average ticket size by use case, which is then compared with merchant acceptance patterns. Where data is sparse for smaller use cases, we used conservative penetration bands and validated them through interviews so gaps do not inflate the total.
Key inputs (illustrative) included the share of non-cash retail transactions, smartphone and mobile broadband penetration, contactless POS readiness and wallet tokenization availability, e-commerce order value trends, and the split between proximity and remote payments. For forecasting, scenario analysis was used around regulation and adoption (for example, merchant acceptance mandates and wallet interoperability), and then the yearly path was smoothed using time-series techniques on the most stable indicators so the trajectory does not overreact to one-off spikes.
Data Validation & Update Cycle
Outputs were checked against independent signals before sign-off, including consistency between mobile payment growth and broader electronic transaction growth, as well as logical ranges for use case mixes and average transaction sizes. When an anomaly showed up, the underlying driver was re-tested, and follow-up calls were triggered if the variance could not be explained by seasonality or a known policy change.
A multi-step internal review was completed so assumptions, calculations, and unit conversions could be verified. Reports are refreshed annually, and interim updates are made when material events occur such as rule changes, major platform launches, or sudden shifts in reported electronic payment shares. Before delivery, we do a final pass to ensure the latest public releases and news are reflected in the narrative and the model.
Mordor Intelligence's Saudi Arabia Mobile Payments Market Size Compared Against Other Published Estimates
It is normal to see different market values for mobile payments because publishers do not always count the same payment actions, and the reporting year and currency timing can also shift the final number. Differences often come from whether the estimate is built from payment-rail totals, merchant sales proxies, or wallet-only tracking, which then changes what is counted as mobile.
Card-present transactions that are merely processed on standard POS terminals, without a mobile wallet or banking-app initiation, sit outside Mordor Intelligence's scope. This is why some broader digital payments figures can look larger for the same country and year.
Benchmark comparison
| Source | Market Size | Gaps in Research Methodology |
|---|---|---|
| Mordor Intelligence | USD 29.02 B (2026) | |
| Trade Journal A | USD 27.90 B (2025) | Uses a wallet-led definition and may exclude mobile banking-initiated remote payments, which lowers the addressable pool even if overall digital payment usage is rising. |
| Regional Consultancy B | USD 31.35 B (2026) | Often rolls up a wider digital payments bucket and can include non-mobile card spending proxied from retail sales, which increases totals when mobile attribution is not cleanly separated. |
The spread in the table is mainly explained by what is treated as a mobile-initiated payment versus a broader digital payment activity. By keeping the inclusion rules tied to initiation method and then re-checking the path using adoption and acceptance indicators, we end up with a number that can be traced back to clear inputs and repeated year after year.
Key Questions Answered in the Report
What is the current size of the Saudi Arabia mobile payments market?
The market is worth USD 29.02 billion in 2026 and is on track to reach USD 50.8 billion by 2031.
Which segment is growing fastest within the market?
Remote payments and peer-to-peer transfers lead with CAGRs of 15.05% and 15.85% respectively, buoyed by e-commerce and real-time payroll flows.
How significant is government influence on market growth?
Vision 2030’s target of 80% non-cash transactions and mandatory Sarie rail adoption add roughly 3.2 percentage points to market CAGR.
What role do international players such as Apple Pay have?
Apple Pay already captures over 20% of Saudi online wallet checkouts, and new Express Mode transit deployments further entrench its footprint.
What are the main challenges to wider adoption outside major cities?
Fraud concerns and low micro-merchant acceptance due to device costs and patchy connectivity remain key barriers in secondary cities and rural areas.
How competitive is the provider landscape?
The field is moderately concentrated: five leading providers hold slightly more than 60% share, leaving room for niche entrants but also driving consolidation pressure.