
Market Overview
| Study Period | 2021 - 2031 |
|---|---|
| Forecast Data Period | 2026 - 2031 |
| Base Year Market Size (2025) | USD 0.82 Billion |
| Market Size (2026) | USD 0.86 Billion |
| Market Size (2031) | USD 1.1 Billion |
| Growth Rate (2026 - 2031) | 5.03 % |
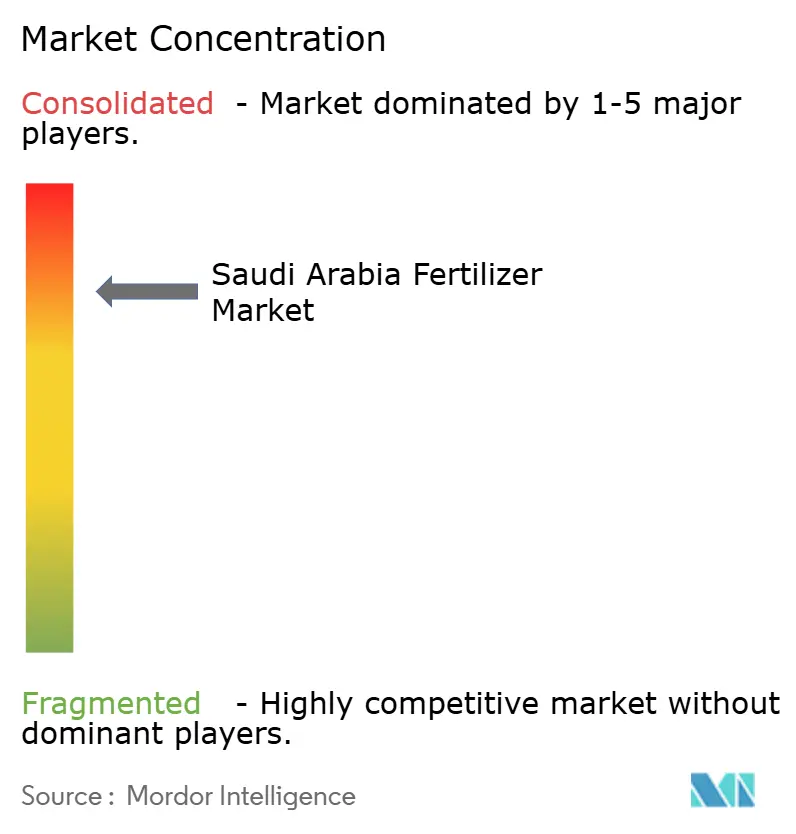
| Market Concentration | High |
Major Players *Disclaimer: Major Players sorted in no particular order Image © Mordor Intelligence. Reuse requires attribution under CC BY 4.0. | |
Saudi Arabia Fertilizer Market Analysis by Mordor Intelligence
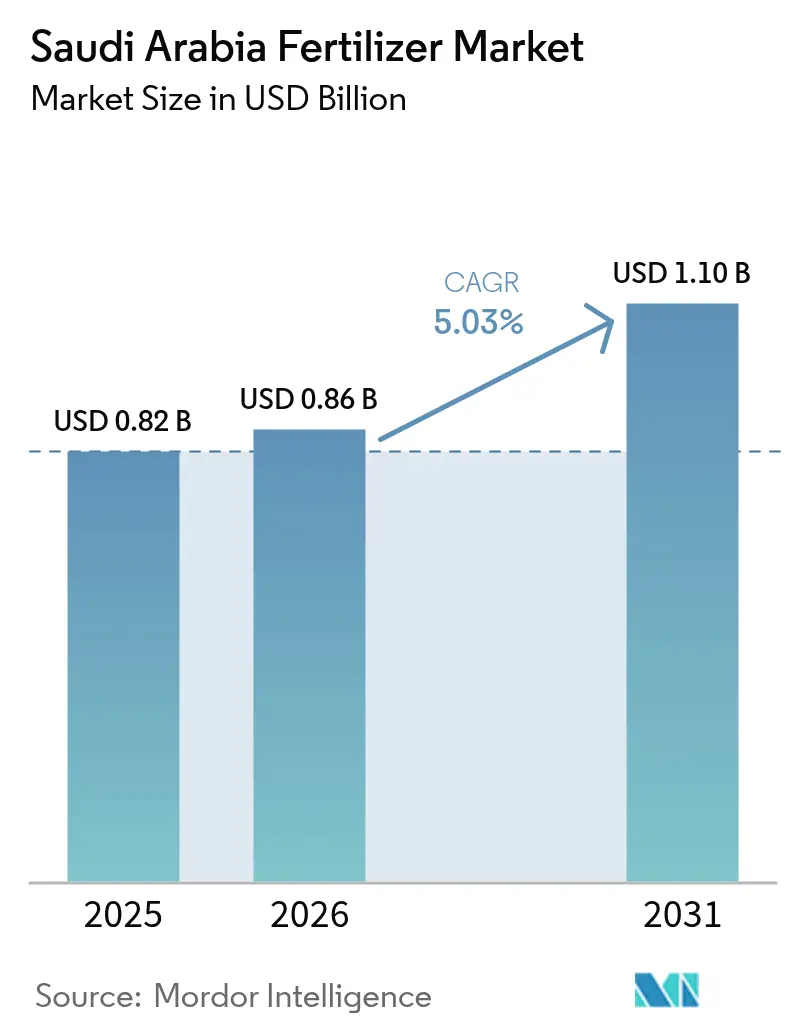
Saudi Arabia fertilizer market size in 2026 is estimated at USD 0.86 billion, growing from 2025 value of USD 0.82 billion with 2031 projections showing USD 1.1 billion, growing at 5.03% CAGR over 2026-2031. This growth aligns with the Kingdom's strategy to utilize its natural gas feedstock advantages while implementing Vision 2030's food security and economic diversification goals. The market development is driven by domestic production quotas, increased adoption of precision irrigation, and the country's development as a global blue ammonia export center through carbon capture initiatives. Saudi Aramco achieved a significant milestone by completing the world's first certified bulk shipment of low-carbon ammonia to Japan in 2024, using carbon capture and storage technologies. The combination of this technological progress, government support for desert-soil bio-enhanced fertilizers research, and widespread implementation of precision irrigation systems indicates continued market growth, despite existing regulatory and competitive challenges.
Key Report Takeaways
- By fertilizer type, straight fertilizers held 70.35% of the Saudi Arabia fertilizer market share in 2025, and complex fertilizers are forecast to expand at a 6.53% CAGR through 2031.
- By form, granular products captured 61.90% share of the Saudi Arabia fertilizer market size in 2025, and the liquid formulations led growth at a 7.12% CAGR between 2026 and 2031.
- By crop application, grains and cereals commanded 37.45% of the Saudi Arabia fertilizer market size in 2025, while fruits and vegetables are advancing at a 6.62% CAGR to 2031.
- SABIC Agri-Nutrients Company, Ma’aden Phosphate Company, Gulf Petrochemical Industries Company (GPIC), OCP Group, and Al-Tayseer Chemical Industry jointly controlled 87.60% of the Saudi Arabia fertilizer market share in 2025.
Note: Market size and forecast figures in this report are generated using Mordor Intelligence’s proprietary estimation framework, updated with the latest available data and insights as of 2026.
Saudi Arabia Fertilizer Market Trends and Insights
Drivers Impact Analysis*
| Driver | (~) % Impact on CAGR Forecast | Geographic Relevance | Impact Timeline |
|---|---|---|---|
| Surge In Low-Carbon Blue Ammonia Export Incentives | +0.8% | National, with export focus to Japan and South Korea | Medium term (2-4 years) |
| Mandatory Domestic-Production Quotas Under Vision 2030 Food-Security Targets | +1.2% | National, with concentration in Al-Ahsa and Najran regions | Long term (≥ 4 years) |
| Rapid Pivot to Precision Irrigation Boosting Water-Efficient Fertilizer Blends | +0.9% | National, with early adoption in Riyadh and Eastern provinces | Short term (≤ 2 years) |
| Gulf Cooperation Council (GCC) Natural-Gas Price Advantage Versus Global Peers | +1.0% | Regional, with spillover effects to neighboring Gulf states | Long term (≥ 4 years) |
| State-Backed Expansion of Fertilizer Production Hubs | +0.6% | National, with concentration in crop-producing regions | Medium term (2-4 years) |
| Expansion of Mega Agricultural Zones Fueling Fertilizer Consumption | +0.4% | National, with pilot projects in Hail and Northern Border regions | Long term (≥ 4 years) |
| Source: Mordor Intelligence | |||
Surge in Low-Carbon Blue-Ammonia Export Incentives
Saudi Arabia's blue ammonia export program uses carbon capture and storage technologies to produce low-carbon fertilizers for global markets. Saudi Aramco exported 40 metric tons of blue ammonia to Japan in 2024, validating the commercial feasibility of these exports. The Kingdom aims to produce 11 million metric tons of blue ammonia by 2030. Saudi fertilizer producers can obtain 15-20% price premiums compared to conventional ammonia while meeting carbon emission standards of importing countries. Government incentives for carbon capture projects improve the financial viability of blue ammonia production, providing Saudi Arabia with a competitive advantage over traditional fertilizer exporters. This transition to low-carbon production methods supports global emissions reduction goals while enabling the Kingdom to process its natural gas reserves into higher-value products.
Mandatory Domestic-Production Quotas Under Vision 2030 Food-Security Targets
Saudi Arabia's Vision 2030 framework establishes minimum domestic fertilizer production requirements to support food security goals. The Saudi Grains Organization has set procurement targets of 1.5 million metric tons of domestically produced wheat annually[1]Source: Food and Agriculture Organization, “GIEWS Country Brief on Saudi Arabia,” fao.org. These requirements ensure fertilizer manufacturers maintain production capacity for strategic crops, creating consistent demand for nitrogen and phosphate products. The country has achieved self-sufficiency in dates, dairy, and table eggs production, with surplus available for export. The government has allocated USD 400 million in 2023 to support small farming operations and agricultural cooperatives, increasing fertilizer usage in previously underserved segments. The domestic production requirements help protect local fertilizer demand from global price fluctuations while maintaining food security during supply chain disruptions.
Rapid Pivot to Precision Irrigation Boosting Water-Efficient Fertilizer Blends
The adoption of IoT-enabled smart irrigation systems in Saudi Arabia increases the demand for specialized liquid fertilizer formulations designed for drip and micro-spray applications. Studies show that combining precision irrigation with fertigation improves water use efficiency by up to 46% while increasing crop yields by approximately 19% in the country's arid conditions. The Ministry of Environment, Water, and Agriculture has allocated SAR 100 million (USD 26.7 million) to sustainable agriculture initiatives, supporting the implementation of advanced irrigation technologies in commercial farming operations. This transition benefits liquid fertilizer suppliers who provide nutrient solutions compatible with automated delivery systems, presenting market opportunities for companies with precision agriculture capabilities. The movement toward water-efficient farming practices aligns with the Kingdom's National Water Strategy 2030 for managing limited freshwater resources.
Gulf Cooperation Council (GCC) Natural-Gas Price Advantage Versus Global Peers
Saudi Arabia maintains a competitive advantage in ammonia and urea production through access to subsidized natural gas feedstock, with domestic prices significantly lower than international market rates. The country produced 4.0 million metric tons of ammonia in 2024, sustaining production volumes while other global producers experienced higher production costs due to elevated gas prices. Saudi Aramco's expansion of the Fadhili Gas Processing Plant will increase gas processing capacity from 2.5 to 3.8 billion cubic feet per day by 2027, ensuring a stable feedstock supply for fertilizer production. The cost advantage has become more significant as international natural gas prices remain high due to geopolitical factors and supply limitations in major producing regions. This positioning enables the Gulf Cooperation Council countries to increase their market presence in price-sensitive fertilizer export markets across Asia and Africa.
Restraints Impact Analysis*
| Restraint | (~) % Impact on CAGR Forecast | Geographic Relevance | Impact Timeline |
|---|---|---|---|
| New Agricultural Fertilizer Law Tightens Registration and Import Rules | -0.7% | National, with particular impact on specialty fertilizer importers | Short term (≤ 2 years) |
| Escalating Natural-Gas Allocation Debates with the Chemicals Sector | -0.5% | National, concentrated in Jubail and Yanbu industrial cities | Medium term (2-4 years) |
| Salinity Build-Up Forcing Nutrient-Use-Efficiency Caps | -0.4% | National, with acute effects in Eastern Province agricultural zones | Long term (≥ 4 years) |
| Carbon-Border Taxes on High-Footprint Fertilizer Exports | -0.6% | Export-focused, primarily affecting European Union market access | Medium term (2-4 years) |
| Source: Mordor Intelligence | |||
New Agricultural Fertilizer Law Tightens Registration and Import Rules
Saudi Arabia's enhanced fertilizer registration requirements have increased compliance costs and market entry barriers, particularly affecting specialty and imported fertilizer products. The regulatory framework requires comprehensive product testing and documentation for all fertilizer formulations, with immediate implementation requirements that limit adjustment time for market participants[2]Source: United States Department of Agriculture, “Saudi Arabia: FAIRS Country Report Annual,” usda.gov. The regulations benefit established domestic producers with existing compliance infrastructure while creating obstacles for smaller importers and niche product suppliers. While the law's product safety and efficacy standards align with international practices, they increase operational costs for companies in the Saudi market. These compliance requirements may lead to market share consolidation among larger companies that can absorb regulatory costs, potentially restricting product innovation from smaller specialized suppliers.
Carbon-Border Taxes on High-Footprint Fertilizer Exports
The European Union's Carbon Border Adjustment Mechanism (CBAM), set to take effect in 2026, will impose tariffs on carbon-intensive fertilizer imports, affecting Saudi Arabia's export competitiveness in European markets. The mechanism requires importers to purchase carbon certificates matching the emissions embedded in fertilizer products. Compliance costs are projected to reduce export margins by 10-15% for conventional production methods[3]Source: EUR-Lex, “Carbon Border Adjustment Mechanism,” eur-lex.europa.eu. Saudi fertilizer exporters are particularly vulnerable due to their use of natural gas feedstock and conventional production technologies, which generate higher carbon footprints compared to some international competitors. The transitional reporting period from 2023 to 2025 offers a narrow window for producers to implement carbon reduction measures or develop alternative market strategies. This regulatory change drives investment in low-carbon production technologies while potentially shifting export flows to markets without carbon border adjustments.
*Our forecasts treat driver/restraint impacts as directional, not additive. The impact forecasts reflect baseline growth, mix effects, and variable interactions.
Segment Analysis
By Fertilizer Type: Feedstock Integration Sustains Straight Fertilizers Dominance
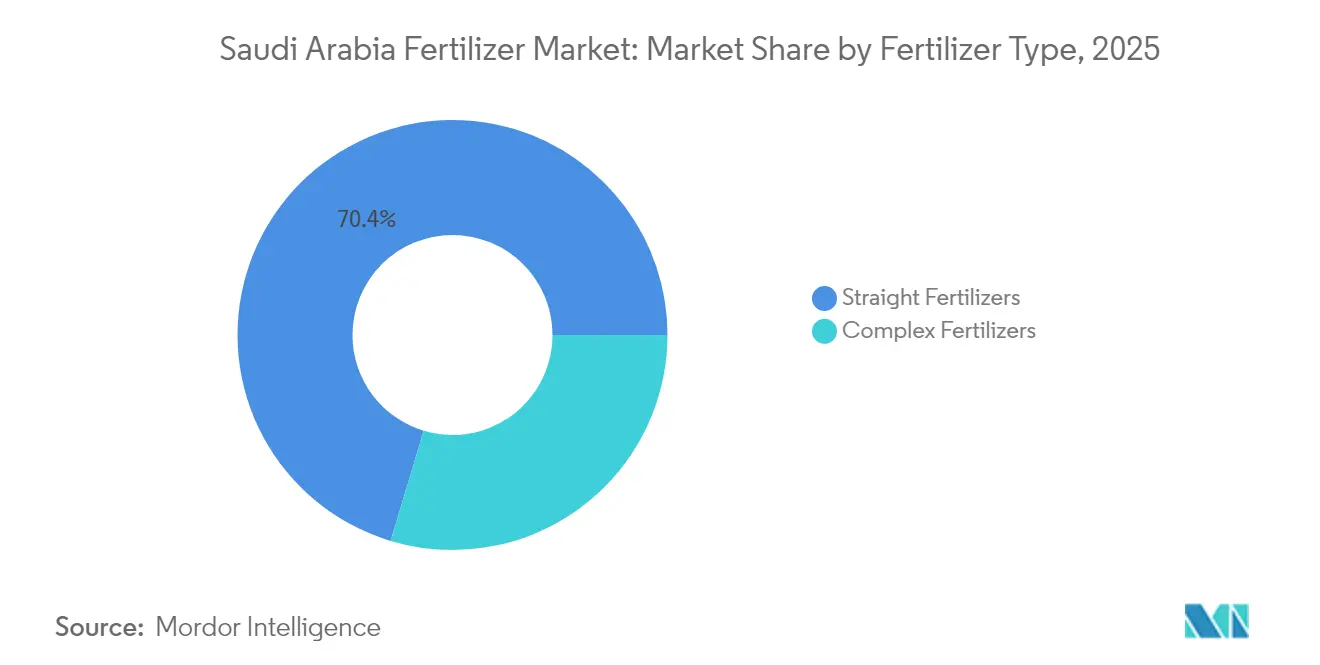
Straight fertilizers commanded 70.35% of the Saudi Arabia fertilizer market share in 2025, underpinned by abundant natural-gas and phosphate rock supplies. Nitrogenous grades such as granular urea feed the integrated chain that links SABIC Agri-Nutrients Company (Saudi Arabian Basic Industries Corporation) to Saudi Arabian Oil Company (Saudi Aramco) gas pipelines. The resulting cost curve insulates domestic plants from international volatility, anchoring export competitiveness. In contrast, complex fertilizers, though smaller, register a 6.53% CAGR, aligned with soil-testing campaigns that promote balanced nutrient packages. Farmer workshops financed by the Ministry of Environment, Water, and Agriculture (MEWA) illustrate the yield benefits of NPK (nitrogen-phosphorus-potassium) blends, nudging demand shift. Specialized micronutrient solutions gain traction where lab results expose sulfur and zinc deficiencies across date-palm orchards. These trends collectively funnel incremental value into the Saudi Arabia fertilizer market size, even as straight categories remain the revenue bulwark.
Complex fertilizers benefit from precision-agriculture rollouts that match multinutrient formulations with crop-stage needs. Spray-grade NPK blends dovetail with automation rigs in greenhouse farms outside Jeddah, enabling uniform particle suspension. Localization efforts accelerate, with SABIC Agri-Nutrients piloting sulfur-coated NPK lines at its Al-Jubail site to mitigate leaching losses. Competitors eye joint ventures to secure phosphoric acid, while smaller formulators emphasize environmental profiles to satisfy carbon accounting standards. The widening palette of choices enriches supplier differentiation, reinforcing the Saudi Arabia fertilizer market appeal among progressive growers.


By Form: Liquid Gains Momentum in Smart-Irrigation Era
Granular formulations held a 61.90% stake of the Saudi Arabia fertilizer market size in 2025, reflecting compatibility with mechanized broadcasting and durability in desert storage. Their prominence is reinforced by state procurement for wheat and barley, where large-scale field operations favor cost-effective granules. Yet adoption plateaus within regions already saturated with traditional practices. Liquid products, conversely, soar at a 7.12% CAGR, energized by IoT-enabled fertigation systems. Smart valves permit real-time nutrient tweaks, lowering water footprints and coaxing higher revenue per hectare. Manufacturers tailor liquid blends for varying salinity thresholds, avoiding clogging in drip lines, a critical design parameter under Saudi heat.
Technology vendors bundle sensors, analytics, and subscription nutrient packs, converting fertilizer from a commodity to a service. Pilot studies record 25-30% higher uptake efficiency versus broadcast granules, boosting net returns despite premium price points. Export ambitions also favor liquid versatility, as concentrated suspensions cut freight payloads for Asian clients. Consequently, the liquid wave reshapes marketing playbooks, broadening the Saudi Arabia fertilizer market reach among tech-savvy agribusinesses.
By Crop Application: Policy-Backed Grains Stay Anchor While Horticulture Accelerates
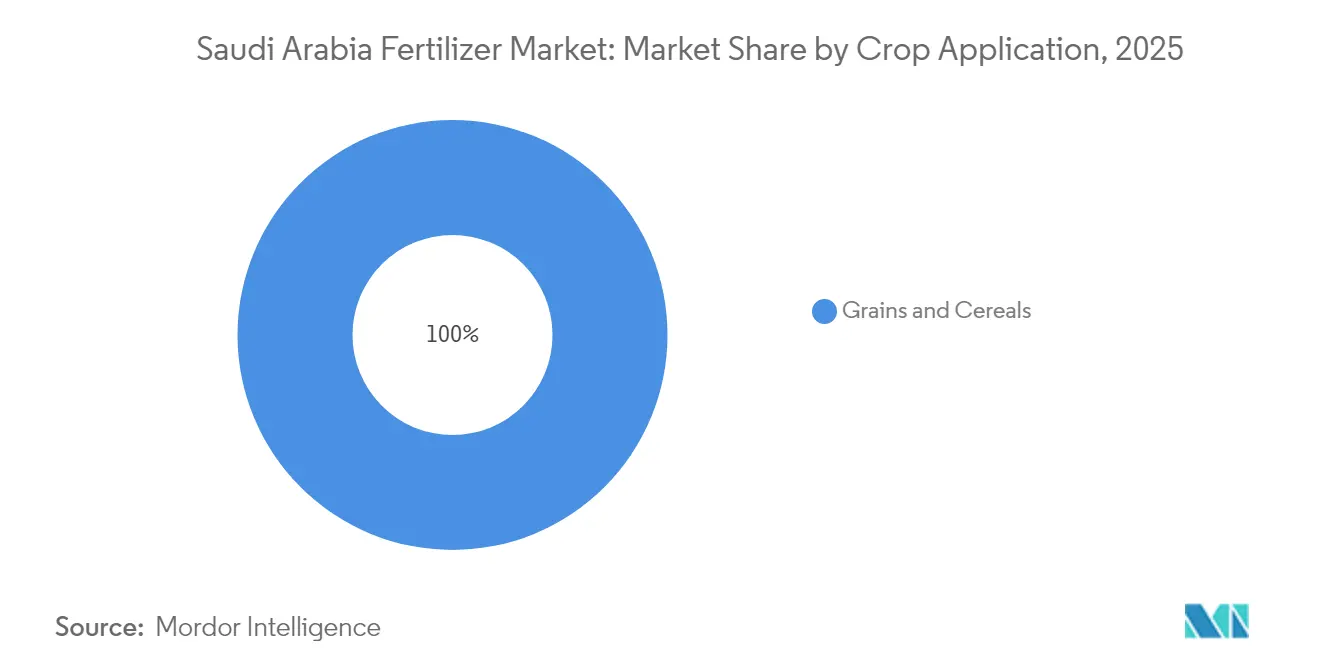
Grains and cereals absorbed 37.45% of the Saudi Arabia fertilizer market share in 2025, driven by the guaranteed of offtake under Vision 2030. Wheat protein targets necessitate precise nitrogen regimens, locking in baseline demand. The water quotas encourage rotational strategies, nudging farmers toward controlled-environment horticulture. Fruits and vegetables thus post a 6.62% CAGR, aided by greenhouse clusters in Al-Kharj and Taif. These facilities tap liquid formulations and CO2 enrichment to hit export-grade shelf life, diversifying the Saudi Arabia fertilizer market base.
Pulses and oilseeds occupy a smaller share but benefit from livestock feed diversification. Commercial crops, including cotton, remain niche amid water constraints, while the turf and ornamentals find growth in urban mega-projects such as NEOM and Qiddiya. Landscaping contracts favor slow-release, aesthetics-focused blends, adding a specialty tier. Collectively, shifting crop-mix dynamics enhance margin optionality inside the Saudi Arabia fertilizer market.
Geography Analysis
Domestic demand spans the Central, Eastern, and Western regions, yet integrated industrial zones at Al-Jubail and Yanbu dominate production. These hubs combine gas pipelines, sulfur recovery units, and export terminals, compressing logistics costs. Rural grants channel USD 400 million of 2023 into smallholders, spreading fertilizer usage across Najran and Hail, while greenhouse-heavy clusters near Riyadh consume high-grade liquids. Desert-agriculture pilots in the Northern Border test microbial blends, expanding the Saudi Arabia fertilizer market into marginal lands.
Externally, the Kingdom ranks fifth among global urea exporters, leveraging gas subsidies to outrank higher-cost peers. Cargoes to the United States reached SAR 3 billion (USD 800 million) in 2024, comprising 35% of non-oil shipments. Blue-ammonia pathways unlock premium lanes to Japan and South Korea, aligning with decarbonization preferences. Africa and South Asia absorb value-tier products, reinforcing volume stability for the Saudi Arabia fertilizer market.
Geopolitical positioning in the Middle East and North Africa secures proximity to growth economies with rising food imports. China-Saudi accords worth USD 3.7 billion earmark technology transfers in bio-fertilizers and smart-cities agriculture, potentially steering joint R&D. The National Industrial Development and Logistics Program pushes downstream mineral conversion, ensuring that incremental phosphate rock turns into finished fertilizer rather than raw exports. Together, these initiatives fortify the Saudi Arabia fertilizer market as a regional supply cornerstone.
Regulatory Landscape
Fertilizer production, import, circulation, and use are regulated primarily by the Ministry of Environment, Water and Agriculture (MEWA) under the Agriculture Law framework and its implementing regulations, with licensing required for importing, trading, or manufacturing agricultural fertilizers and soil conditioners. MEWA administers licensing and product-handling requirements through its processes, including electronic submission and tracking via the Naama unified services portal, which raises the emphasis on documented specifications, test data, and traceability for market entry.
Oversight also extends to chemical precursors and controlled substances used in fertilizer production, with monitoring and clearances coordinated with the Ministry of Interior and, where applicable, the Saudi Food and Drug Authority (SFDA) under chemicals import controls. Where no specific Saudi standard exists for a fertilizer product, MEWA sets technical conditions and specifications. It also supervises organic fertilizer production plants for compliance with the Law of Organic Farming and relevant GCC standards, shaping the pathway for controlled-release, fertigation-compatible, and other high-efficiency formulations promoted through ministry sustainability and water-management programs.
Competitive Landscape
The Saudi Arabia fertilizer market exhibited high concentration in 2024, with five major suppliers dominating 88% of the market share, including SABIC Agri-Nutrients Company, Ma'aden Phosphate Company, Gulf Petrochemical Industries Company (GPIC), OCP Group, and Al-Tayseer Chemical Industry. SABIC Agri-Nutrients Company (Saudi Arabian Basic Industries Corporation) remains one of the major leaders, buoyed by feedstock alignment with Saudi Aramco pipelines and a multichannel distributor web. Saudi Arabian Mining Company Phosphate Company (Ma'aden Phosphate), operating the Wa’ad Al Shamal complex that yields 3.1 million metric tons of phosphates annually. Industries Qatar, a significant Gulf neighbor, participates via cross-border trade but trails domestic titans.
Strategic moves favor vertical integration and carbon-reduction technologies. Ma'aden’s USD 1.5 billion buyout of Mosaic Company’s 25% stake in Wa’ad Al Shamal consolidates control over phosphate assets and simplifies capital planning. SABIC Agri-Nutrients invests in carbon-capture retrofits and digital supply-chain portals that promise real-time customer order visibility. Smaller entrants carve niches in bio-enhanced formulas or drip-compatible liquids, leveraging academic partnerships. Despite high entry barriers, innovation pockets persist, enriching the Saudi Arabia fertilizer market portfolio.
Competitive pressure intensifies as petrochemical gas needs grow. Negotiations around long-term gas contracts determine marginal cost positions, especially when external LNG indices soar. Blue-ammonia pioneers secure early export memoranda, capturing regulatory goodwill and potential certificate revenues. Carbon-border tariffs loom as a forcing function for laggards, compelling upgrades or partnership exits. Overall, strategic differentiation hinges on low-carbon outputs, specialty blends, and service-wrapped offerings within the Saudi Arabia fertilizer market.
Saudi Arabia Fertilizer Industry Leaders
Ma’aden Phosphate Company
Gulf Petrochemical Industries Company (GPIC)
OCP Group
Al-Tayseer Chemical Industry
SABIC Agri-Nutrients Company (Saudi Arabian Basic Industries Corporation)
- *Disclaimer: Major Players sorted in no particular order

Market Opportunities and Future Outlook
Capacity build-out tied to feedstock allocations remains a key whitespace for suppliers, contractors, and downstream distributors serving nitrogen and phosphate chains anchored in Jubail and Waad Al Shamal. In March 2026, SABIC Agri-Nutrients disclosed Ministry of Energy feedstock allocation approval for a seventh plant in Jubail Industrial City (planned at 1.2 MMTA ammonia and 2.6 MMTA urea). This shifts procurement needs for catalysts, additives, logistics, and blending partners toward a larger domestic output footprint.
Low-carbon product pathways also present a distinct opportunity track where offtake and certification infrastructure act as constraints alongside technical delivery. The same March 2026 update described a revised scope for SABIC Agri-Nutrients sixth plant toward 1.2 MMTA of low-carbon blue ammonia, with the final investment decision linked to securing long-term offtake. At the same time, export-facing producers face the 2026 start of the EU Carbon Border Adjustment Mechanism (CBAM), including embedded emissions reporting and compliance requirements. On the demand side, MEWA-backed emphasis on water-efficient agriculture and fertigation supports value-added liquid and specialty blends for drip systems and salinity management, while licensing and specification controls under the Agriculture Law tighten product registration and quality assurance across both domestic and imported portfolios.
Recent Industry Developments
- March 2026: SABIC Agri-Nutrients received Ministry of Energy approval for feedstock allocation to build its seventh plant in Jubail Industrial City, planned at 1.2 MMTA of conventional ammonia and 2.6 MMTA of urea. The project expands the companys urea platform and strengthens Saudis nitrogen supply base around Jubail, influencing regional trade flows and downstream blending capacity.
- December 2025: Maaden received Ministry of Energy approval for feedstock for its fourth phosphate and ammonia project. The authorization reinforces the pipeline of new phosphate-linked fertilizer output and underpins additional contracting and infrastructure activity around integrated phosphate production.
- July 2024: SABIC Agri-Nutrients advanced its low-carbon ammonia positioning through its broader ammonia project pathway, supporting the industry shift toward lower-emissions nitrogen value chains. The activity contributes to building the technical and commercial base for differentiated ammonia-linked products used across fertilizers and related downstream applications.


Research Methodology Framework and Report Scope
Market Definition and Coverage
For this report, we define the Saudi Arabia fertilizer market as the value of fertilizer products sold for crop nutrition within Saudi Arabia, across major nutrient types and product forms, measured at the point of sale into agricultural use.
Scope exclusions: This sizing excludes crop protection chemicals, seeds, and soil amendments that are not sold as fertilizers (even if they support yield outcomes).
Segmentation Overview
- By Fertilizer Type
- Complex Fertilizers
- Straight Fertilizers
- Nitrogenous Fertilizers
- Urea
- Calcium Ammonium Nitrate
- Ammonium Nitrate
- Ammonium Sulfate
- Anhydrous Ammonia
- Other Nitrogenous Fertilizers
- Phosphatic Fertilizers
- Mono-ammonium Phosphate (MAP)
- Di-ammonium Phosphate (DAP)
- Single Super Phosphate (SSP)
- Triple Super Phosphate (TSP)
- Other Phosphatic Fertilizers
- Potassic Fertilizers
- Muriate of Potash (MOP)
- Sulfate of Potash (SOP)
- Secondary Macronutrient Fertilizers
- Micronutrient and Specialty Fertilizers
- Nitrogenous Fertilizers
- By Form
- Granular
- Liquid
- By Crop Application
- Grains and Cereals
- Pulses and Oilseeds
- Fruits and Vegetables
- Commercial Crops
- Turf and Ornamental Crops
Data Sources, Market Sizing, and Validation
Desk Research
Desk research started with public statistics that show the demand pool for plant nutrients in Saudi Arabia, followed by trade and price signals that help convert activity into market value. We referred to sources such as FAOSTAT for crop area and output, UN Comtrade for import and export flows by fertilizer codes, and the Saudi General Authority for Statistics for agriculture indicators and macro series.
To keep pricing and supply context grounded, we also reviewed ministry releases and policy notes (such as agriculture and water efficiency programs), customs and port updates, and technical publications that track nutrient-use efficiency and application practices in arid farming. Company annual reports, investor presentations, and credible press were used to understand product mix shifts, capacity changes, and distribution patterns. In a few places, our analysts used paid subscriptions for company financials and for shipment-level import and export checks where public tables were too aggregated. The desk sources listed here are illustrative, and other public sources were also used for data collection, cross-checking, and clarifying assumptions.
Primary Interviews and Surveys
Primary work was used to test whether the desk assumptions matched what buyers and sellers see on the ground, especially around product mix, typical application rates, and the timing of seasonal demand. We spoke with a mix of producers, importers, distributors, large farms, and agronomy advisors so the model reflected purchasing behavior across key crop categories and growing regions in Saudi Arabia.
Distribution of primary research fieldwork respondents
| Company type | Respondent position |
|---|---|
| Top tier: 26% | CXOs: 13% |
| Mid tier: 60% | Functional/Unit leaders: 31% |
| Smaller Players: 14% | Managers: 56% |
Market-Sizing & Forecasting
The core sizing approach used top-down market reconstruction, where crop area and crop mix, nutrient application intensity, and import and domestic supply signals are translated into an annual value estimate for fertilizer consumption. To keep totals realistic, we then checked the outputs with selective bottom-up approximations, such as sampled selling prices by product form and nutrient type, distributor channel checks, and a sanity roll-up of visible supply volumes that typically land in the local market.
A few inputs carried most of the weight in the model, including planted area for grains and cereals, fruits and vegetables, and commercial crops, shifts between straight and complex fertilizers, granular versus liquid adoption, and the direction of unit pricing driven by global urea and phosphate benchmarks converted into local pricing. Where data gaps appeared, we used bounded ranges from interviews for application rates and mix, then constrained results using trade and production consistency checks rather than forcing a fully itemized build.
For forecasting, we used scenario analysis supported by trend smoothing on the demand drivers that are most stable in Saudi Arabia, such as crop area plans, irrigation and water-efficiency adoption, and expected mix shifts toward higher efficiency products. The final forecast path was adjusted only when multiple interviewees confirmed a change in buying patterns or when trade and price series showed a sustained break from recent norms.
Data Validation & Update Cycle
Before final numbers are signed off, we run step-by-step variance checks across market totals and key sub-parts so the story aligns with the math. Our analysts compare modeled value against independent signals like import volumes by major fertilizer groups, reported production or capacity commentary, and observed price movements, then outliers are reviewed and corrected with a clear reason.
A second analyst review is completed to confirm units, conversions, and assumptions, and follow-up calls are triggered when interview feedback conflicts with a major model driver. Reports are refreshed annually, and interim updates are made when material events occur, such as policy shifts, capacity changes, or sharp price movements. Right before delivery, we do a fresh scan so clients receive the most current view available at the time of publication.
Mordor Intelligence's Saudi Arabia Fertilizer Market Size Compared With Other Published Estimates
Published market numbers for fertilizers in Saudi Arabia can look far apart, and it usually comes down to what each publisher counts and how they convert volumes into dollars. Differences show up quickly when one estimate treats the market as local consumption only, and another blends in exported production or bundles adjacent crop input categories.
Import and export movements by fertilizer trade codes, plus crop-area and crop-mix indicators used as demand anchors, are the checks that tie Mordor Intelligence to a consumption-based market value that matches how fertilizer is actually purchased for domestic crop use. Other estimates often drift because they apply broader scopes (such as including other farm inputs), rely on one-year price spikes for ASP progression, or use different base years and currency timing that are not re-tested after market conditions change.
Benchmark comparison
| Source | Market Size | Gaps in Research Methodology |
|---|---|---|
| Mordor Intelligence | USD 0.82 B (2025) | |
| Regional Consultancy A | USD 1.70 B (2024) | Uses a broader crop-input style scope and an earlier base year, which can pull in adjacent categories beyond fertilizers and inflate value when mixed pricing assumptions are applied. |
| Trade Journal B | USD 1.05 B (2026) | Applies aggressive price uplift assumptions to forward years and may blend export-driven production value with domestic consumption, which changes the market boundary. |
The spread in the table is mainly explained by scope choices and the way value is converted from activity and pricing. By keeping the boundary tied to fertilizer consumption inside Saudi Arabia and pressure-testing prices and mix with trade and field feedback, the final number stays traceable to a few clear inputs that can be rechecked each update cycle.


Key Questions Answered in the Report
What is the current value of the Saudi Arabia fertilizer market?
The market is valued at USD 0.86 billion in 2026 and is forecast to reach USD 1.1 billion by 2031.
Which fertilizer type holds the largest share in Saudi Arabia?
Straight fertilizers lead with 70.35% share, driven by integrated natural-gas and phosphate assets.
Why are liquid fertilizers growing rapidly in Saudi Arabia?
Adoption of IoT-enabled drip irrigation boosts liquid-fertilizer demand, supporting a 7.12% CAGR through 2031.
How is Vision 2030 influencing fertilizer consumption?
Mandatory domestic production quotas for strategic crops secure steady nitrogen and phosphate demand under Vision 2030.
What impact will the EU carbon-border tax have on Saudi fertilizer exports?
Starting 2026, high-footprint exports to Europe may lose 10-15% margin unless producers shift to low-carbon lines.
Page last updated on:


 Your data is secure and never sold or shared.


