
Satellite IoT Communication Market Size and Share
Market Overview
| Study Period | 2020 - 2031 |
|---|---|
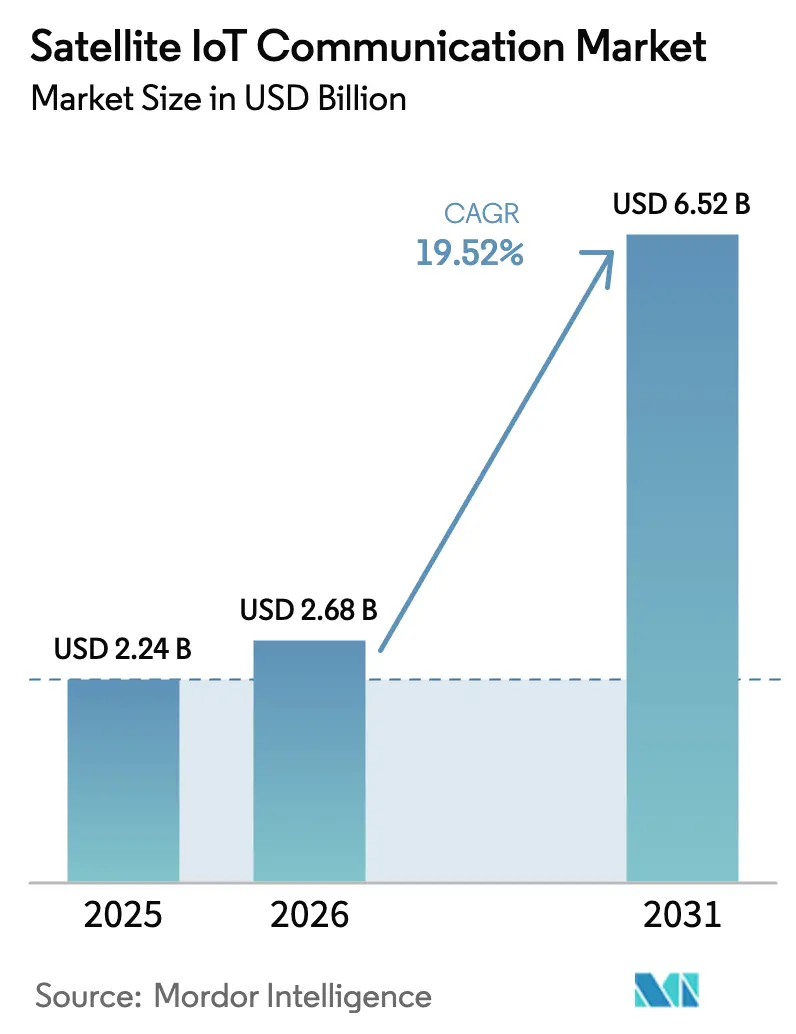
| Market Size (2026) | USD 2.68 Billion |
| Market Size (2031) | USD 6.52 Billion |
| Growth Rate (2026 - 2031) | 19.52 % |
| Fastest Growing Market | Asia Pacific |
| Largest Market | North America |
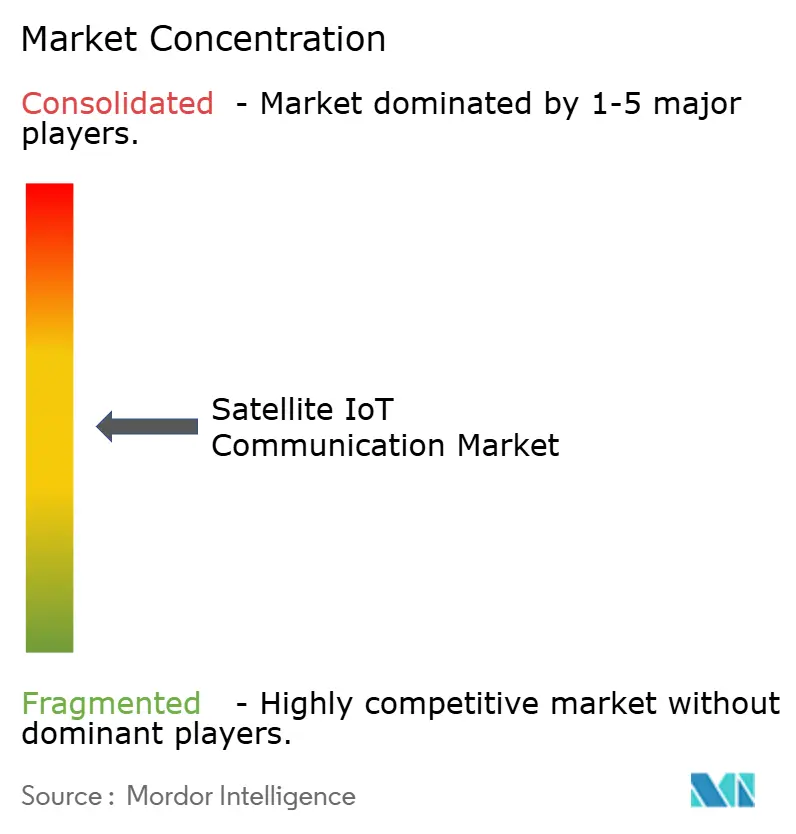
| Market Concentration | Medium |
Major Players
*Disclaimer: Major Players sorted in no particular order Image © Mordor Intelligence. Reuse requires attribution under CC BY 4.0. |
|
Satellite IoT Communication Market Analysis by Mordor Intelligence
The Satellite IoT Communication Market size was valued at USD 2.24 billion in 2025 and estimated to grow from USD 2.68 billion in 2026 to reach USD 6.52 billion by 2031, at a CAGR of 19.52% during the forecast period (2026-2031). This vigorous pace links directly to the harmonization of 5G-Advanced Non-Terrestrial Network (NTN) standards, falling small-satellite launch prices, and public funding that underwrites rural rollouts. Standardized Release 17 and 18 specifications now let devices roam between space- and land-based networks without protocol changes [1]. At the same time, rideshare launch fees have dropped below USD 5,000 per kg, removing cost barriers for new constellations [2]. Government capital grants under the USD 65 billion ReConnect and EUR 2.4 billion CEF-Digital programs shrink deployment risk in thinly populated regions [3]. Extra-narrowband spectrum cleared at WRC-23, coupled with stricter maritime ESG mandates, further expands addressable demand in shipping, agriculture, and environmental monitoring [4].
Key Report Takeaways
- By type of orbit, LEO satellites led with 61.65% of the satellite IoT communication market share in 2025; MEO systems are projected to grow at a 20.05% CAGR through 2031.
- By frequency band, L-Band held 28.25% revenue share in 2025, while Ka-Band shows the highest expansion at a 20.12% CAGR to 2031.
- By end-user industry, maritime and shipping accounted for a 34.12% share of the satellite IoT communication market size in 2025, whereas environmental monitoring is advancing at a 20.78% CAGR through 2031.
- By service type, satellite asset tracking commanded a 40.55% share of the satellite IoT communication market size in 2025; direct-to-device connectivity records the fastest 20.64% CAGR through 2031.
- By geography, North America occupied a 35.05% share in 2025, while the Asia Pacific is set to climb at a 20.85% CAGR to 2031.
Note: Market size and forecast figures in this report are generated using Mordor Intelligence’s proprietary estimation framework, updated with the latest available data and insights as of 2026.
Market Trends and Insights
Drivers Impact Analysis of Satellite IoT Communication Market*
| Driver | (~) % Impact on CAGR Forecast | Geographic Relevance | Impact Timeline |
|---|---|---|---|
| Development and growth of 5G-Advanced NTN specifications | +3.2% | Global, with early adoption in North America and Europe | Medium term (2-4 years) |
| Rapid drop in manufacturing and launch costs of <200 kg satellites | +4.1% | Global, concentrated in regions with launch capabilities | Short term (≤ 2 years) |
| Government rural-connectivity subsidies (e.g., US ReConnect, EU CEF-Digital) | +2.8% | North America and Europe primarily, expanding to APAC | Medium term (2-4 years) |
| New ITU spectrum allocations (WRC-23) for narrowband IoT links | +2.3% | Global | Long term (≥ 4 years) |
| Maritime ESG compliance demand for continuous asset telemetry | +3.4% | Global, with concentration in major shipping routes | Short term (≤ 2 years) |
| Carbon-credit traceability for remote agriculture and forestry | +1.7% | APAC core, spill-over to South America and Africa | Long term (≥ 4 years) |
| Source: Mordor Intelligence | |||
Development and Growth of 5G-Advanced NTN Specifications
Release 17 and 18 specifications unify terrestrial and satellite connectivity, removing the need for dual-mode chipsets and cutting device bill-of-materials by up to 30%. Doppler shift compensation and timing-advance algorithms built into the standard stabilize links from rapidly moving LEO spacecraft, supporting delay-sensitive applications such as remote robotics. Regulators, including the FCC and ETSI, now embed these rules in device certification, trimming launch-to-market cycles. Seamless roaming means industrial IoT installations remain connected during terrestrial outages, an advantage heightened during extreme-weather emergencies. The framework also opens native smartphone connectivity, driving consumer familiarity that will spill over into enterprise demand.
Rapid Drop in Manufacturing and Launch Costs of Sub-200 kg Satellites
Standardized satellite buses, additive manufacturing, and bulk component orders have cut per-unit build costs from USD 500,000 in 2020 to under USD 150,000 in 2024. With launch fees now below USD 5,000 per kg on rideshare missions, a 24-satellite IoT constellation can orbit for under USD 80 million, hitting financing thresholds that venture capital is willing to underwrite. New entrants exploit this cost curve to tailor power budgets and antenna patterns for low-rate telemetry instead of retrofitting broadband birds. Agriculture-focused networks, for example, fly narrow-beam L-Band payloads optimized for soil-sensor packets. Cost trajectories are expected to fall further as in-orbit servicing extends spacecraft life, reducing replenishment needs.
Government Rural-Connectivity Subsidies Drive Infrastructure Investment
Public subsidies reduce capital intensity by up to 60% for operators that extend coverage to zones beyond profitable terrestrial reach. ReConnect awards bundle grants and low-interest loans, encouraging hybrid networks that link surface LoRa gateways through LEO backhaul. CEF-Digital earmarks EUR 2.4 billion for similar projects, tagging precision agriculture and environmental monitoring as priority use cases. Subsidies also fund integration pilots with farm-management software and SCADA platforms, creating reference customers that validate performance. China’s rural revitalization plan assigns satellite links to village cooperatives, though exact IoT carve-outs remain undisclosed. Collectively, these programs create baseline demand that smooths revenue volatility in the satellite IoT communication market.
New ITU Spectrum Allocations Enable Expanded Capacity
WRC-23 freed 1.6-1.7 GHz and 2.4-2.5 GHz blocks for narrowband satellite IoT, boosting usable bandwidth by about 40% and easing congestion in crowded L- and S-bands. Binding interference-protection rules shield these links from terrestrial mobile spillover, preventing packet loss on mission-critical telemetry. Satellite operators must file detailed power-flux-density plans, favoring incumbents with existing coordination teams. The package also opens experimental allocations that permit direct-to-device handheld links, accelerating consumer adoption. As global filings are clear, constellations can scale node counts per satellite without triggering service degradations, underpinning volume growth in the satellite IoT communication market.
Restraints Impact Analysis of Satellite IoT Communication Market*
| Restraint | (~) % Impact on CAGR Forecast | Geographic Relevance | Impact Timeline |
|---|---|---|---|
| Congestion and interference in crowded L- and S-bands | -2.1% | Global, particularly dense shipping routes and urban areas | Short term (≤ 2 years) |
| Limited battery life of ground sensors in remote cold regions | -1.4% | Northern regions (Canada, Russia, Scandinavia, Alaska) | Medium term (2-4 years) |
| Lack of global standard for Sat-to-Device antenna modules | -1.8% | Global | Medium term (2-4 years) |
| Rising space-debris mitigation insurance premiums | -1.2% | Global, concentrated among LEO operators | Long term (≥ 4 years) |
| Source: Mordor Intelligence | |||
Congestion and Interference in Crowded L- and S-Bands
L- and S-band links face growing packet collisions as maritime and logistics users add endpoints, with interference incidents up 45% between 2023 and 2024. Peak traffic on shipping lanes can cut throughput by 30%, forcing resends that drain sensor batteries. Legacy coordination schemes designed for voice circuits cannot handle millions of bursty IoT transmissions. Operators shift some traffic into Ka-Band, but rain fade and higher terminal costs limit mass adoption. Until adaptive beamforming and dynamic channel allocation mature, service-quality uncertainty may dampen near-term uptake, shaving growth off the satellite IoT communication market.
Limited Battery Life of Ground Sensors in Remote Cold Regions
Battery degradation of up to 70% in Arctic climates forces maintenance cycles inside 24 months, compared with five-year lifetimes in temperate zones. Lithium-ion capacity drops 20% for each 10 °C below zero, while transmit-power requirements rise due to component inefficiency. Limited daylight restricts solar recharging, raising the total cost of ownership for oil-pipeline monitors and wildlife tags. Advanced chemistries such as lithium-thionyl chloride improve endurance yet remain too costly for volume deployment. Unless low-temperature energy harvesting or ultralow-power modems reach scale, this constraint will cap addressable device counts in high-latitude portions of the satellite IoT communication market.
*Our forecasts treat driver/restraint impacts as directional, not additive. The impact forecasts reflect baseline growth, mix effects, and variable interactions.
Satellite IoT Communication Market Segment Analysis
By Orbit:
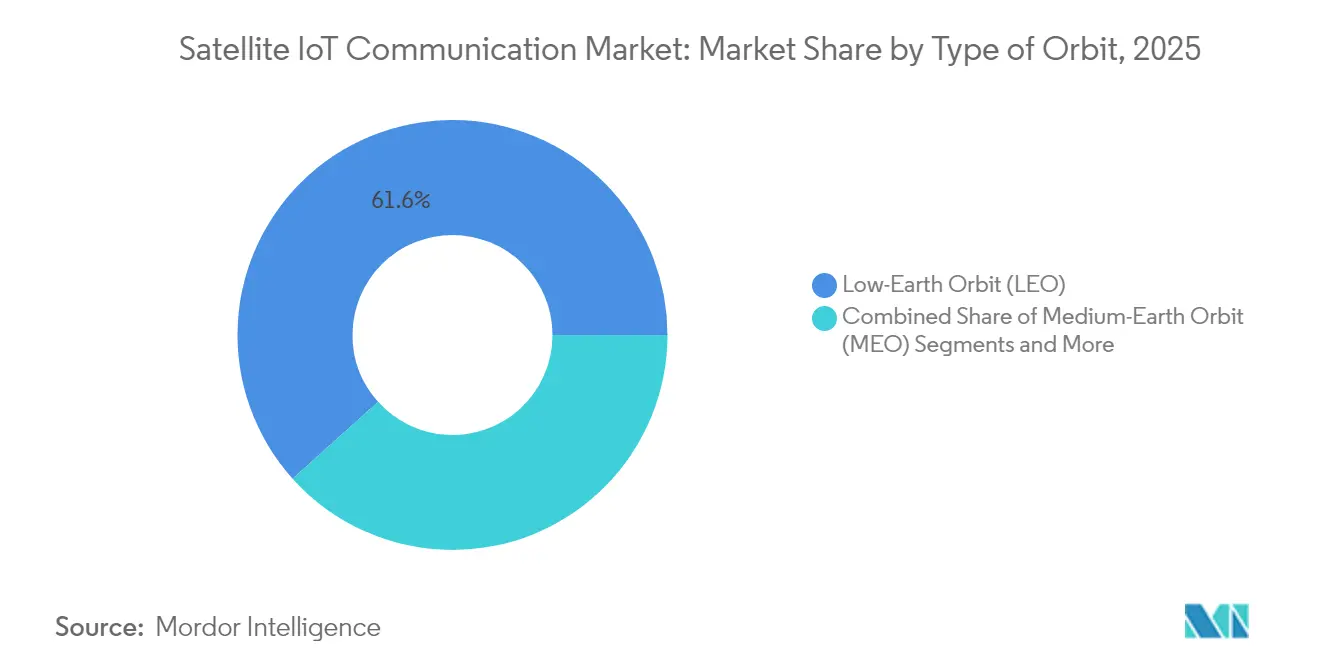
Latency-Smart LEO Retains Lead While Cost-Efficient MEO AcceleratesLow-Earth Orbit platforms captured 61.65% of the satellite IoT communication market share in 2025, leveraging sub-100 millisecond round-trip latency that supports autonomous vehicle telemetry and closed-loop industrial control. This dominance translates into large production runs, sometimes over 1,000 spacecraft, that unlock supplier volume discounts and rapid iteration cycles. However, MEO networks are expanding at a 20.05% CAGR because eight to twenty satellites can blanket the globe, cutting constellation capex by as much as 50% relative to LEO fleets.
The operational calculus differs across customer groups. Battery-powered sensors in remote mining sites often favor LEO because lower link budgets extend battery life. Maritime operators eye MEO for uninterrupted coverage on polar routes where LEO passes create brief outages. Regulatory bodies now weigh orbital-slot filings against debris-mitigation plans, a factor that could tilt future launches toward higher altitudes with longer orbital lifetimes. Both architectures, therefore, coexist, supporting varied service-level agreements inside the satellite IoT communication market.

By Frequency Band:
Workhorse L-Band Meets High-Capacity KaL-Band maintained a 28.25% share of 2025 revenue, trusted for foliage-penetrating, all-weather links needed in maritime and crop-monitoring applications. Devices can operate on milliwatts, stretching battery life and bringing subscription fees within reach of price-sensitive agribusinesses. Ka-Band, despite its weather vulnerability, posts a leading 20.12% CAGR as spectrum abundance allows higher throughputs that support imagery and video-centric edge analytics.
Migration paths vary by vertical. Environmental monitoring agencies adopt Ka for streaming multispectral data, while asset-tracking fleets stick with L-Band until terminal costs fall. Spectrum coordination hurdles persist: newcomers must negotiate with incumbents that hold global filings, which could slow competitive entry but also safeguard service quality. The balance suggests a multiband future where operators mix payloads to hedge against frequency-specific constraints, enriching solution depth in the satellite IoT communication market.
By End-User Industry:
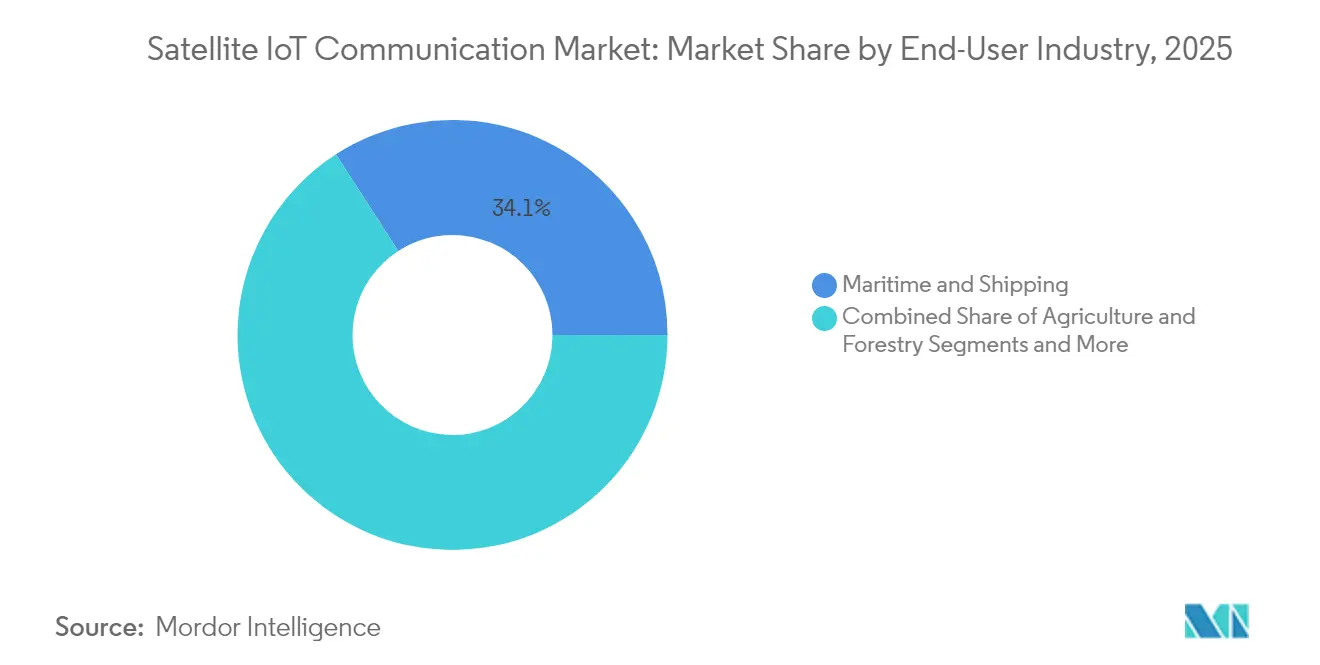
Maritime Compliance Dominates; Environmental Monitoring SurgesMaritime and shipping applications accounted for 34.12% of 2025 revenue, driven by International Maritime Organization rules mandating continuous emissions and route reporting. Vessel telemetry combines GPS, fuel-rate, and cargo-condition data, feeding carbon-accounting dashboards for charterers. Environmental monitoring, though smaller today, is rising at a 20.78% CAGR as governments tie carbon-credit issuance to sensor-verified datasets.
Diversification improves resilience. Agriculture uses soil-moisture sensing to trim water and fertilizer inputs, while defense agencies deploy border surveillance masts that push encrypted alerts via satellite backhaul. Utilities monitor wildfire-prone transmission lines, and extractive industries watch tailings dams to prevent catastrophic spills. The breadth of demand protects the satellite IoT communication market from over-reliance on any single vertical, supporting steady long-run growth.
By Service Type:
Asset Tracking Sustains Scale; Direct-to-Device Unlocks New VolumesSatellite asset tracking held 40.55% of the satellite IoT communication market size in 2025, the historical cornerstone that underpins logistics and theft-prevention value propositions. Mature APIs integrate with warehouse management software, creating switching costs that favor incumbent operators. Direct-to-device connectivity, however, is expanding fastest at a 20.64% CAGR thanks to 3GPP-standard roaming into NTN layers that smartphone makers embed at the chipset level.
Remote monitoring and control sits between these extremes, serving oil wells, water-treatment plants, and renewable-energy farms where crews visit only for scheduled maintenance. Backhaul connectivity forms the underlying transport on which all other services rely, bundling multiple device streams into a single satellite link. Collectively, the service stack widens the total addressable space, cementing multi-application demand in the satellite IoT communication market.
Geography Analysis
North America Satellite IoT Communication Market
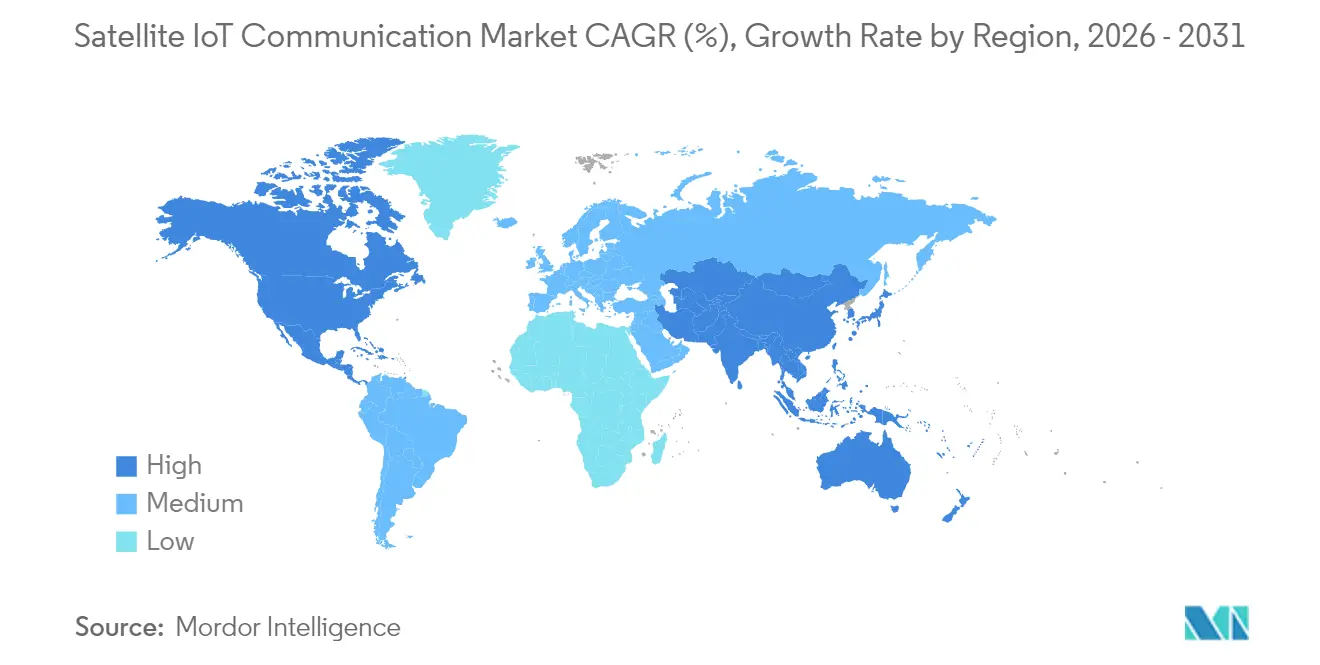
North America commanded 35.05% of 2025 revenue, buoyed by defense surveillance budgets and the ReConnect subsidy that underwrites rural deployments. Arctic sovereignty patrols drive Canada’s purchase of cold-weather-tolerant sensors, while US coastal shipping lanes adopt emissions tracking to comply with ESG scorecards. Mexico’s near-shore manufacturing exports rely on satellite telemetry to maintain just-in-time inventory flows between inland plants and border crossings.
APAC Satellite IoT Communication Market
Asia Pacific registers the fastest 20.85% CAGR to 2031 as China, India, and Southeast Asian states scale digital agriculture. China’s rural revitalization agenda channels public lending into cooperative-owned sensor networks, and India’s domestic launch capacity lowers access costs for local integrators. Japan and South Korea showcase factory-floor automation that depends on uninterrupted IoT data feeds, while Australia’s mining belts outfit haul-roads and conveyor lines with satellite gateways to monitor equipment health.
EMEA Satellite IoT Communication Market
Europe delivers steady expansion underpinned by ESG regulation and the CEF-Digital fund. Germany’s precision-farming subsidies reimburse satellite subscription fees, and French aquaculture firms meet traceability mandates via continuous telemetry. The U.K. advances smart-port initiatives that use satellite analytics to optimize berth allocation. Beyond these mature regions, the Middle East and Africa emerge as opportunity pools where oil operators and agritech programs tap satellite IoT to overcome terrestrial gaps, broadening geographic revenue diversity in the satellite IoT communication market.
Regulatory Landscape
Satellite IoT communication is shaped by spectrum coordination at the international level, plus national market-access, licensing, and equipment rules. At global level, ITU processes and the WRC-23 outcome that cleared additional allocations for narrowband satellite IoT links continue to influence filings, coordination obligations, and interference-protection requirements as operators scale LEO and hybrid architectures.
In 2026, several regulatory actions tightened compliance pathways for direct-to-device and NGSO operations. The United Kingdom introduced The Wireless Telegraphy (Direct to Device Satellite Communications) (Exemption) Regulations 2026, effective February 25, 2026, setting operating conditions for D2D satellite apparatus. The FCC published a Report and Order, effective July 13, 2026, revising spectrum-sharing rules between GSO and NGSO systems around EPFD limits. TRAI released an April 2026 consultation proposing a Satellite Earth Station Gateway (SESG) Provider Authorisation, and the European Commission's Radio Spectrum Policy Group (RSPG) issued a 2026 opinion supporting voluntary CEPT harmonization approaches for D2D and IoT services in relevant bands.
Value Chain Analysis
The satellite IoT communication value chain begins with spectrum rights, orbital filings, spacecraft manufacturing, and launch services, and then extends into constellation operations (space segment) and ground infrastructure (gateways, earth stations, and network operations). Connectivity services and APIs link into device management platforms, cloud analytics, and vertical applications across maritime compliance, asset tracking, agriculture, utilities, and environmental monitoring. Falling small-satellite launch prices and the move toward standardized 3GPP NTN specifications also make interoperability and certification a larger scale lever than bespoke network designs.
Downstream, module and component suppliers (chipsets, RF front ends, antennas) and IoT device OEMs turn network capability into field-ready terminals, balancing power, form factor, and ruggedization. System integrators and solution providers package connectivity with sensors and application software, while mobile operators and roaming intermediaries support distribution for direct-to-device and hybrid terrestrial-satellite propositions. Partnerships across the chain, including Viasat's IoT Nano leveraging ORBCOMM's OGx platform and carrier-linked NTN initiatives, show that go-to-market strength depends increasingly on end-to-end integration as much as on satellite capacity.
Competitive Landscape
Market structure remains moderately fragmented. Iridium Communications and ORBCOMM preserve scale through legacy constellations, regulatory clearances, and vertically integrated device portfolios. Yet launch-cost deflation lets entrants such as Fleet Space Technologies field narrowband fleets at capital requirements under USD 100 million. Strategic moves center on locking down spectrum filings, buying modem makers, and offering cloud dashboards that minimize customer integration work.
Direct-to-device propositions intensify rivalry as Apple and Android chipset vendors embed NTN messaging. Incumbents respond by partnering with carriers; Iridium aligned with Deutsche Telekom in September 2025 to meld satellite fallback into terrestrial footprints. Environmental-monitoring specialism forms another battleground; Swarm positions nanosatellites at ultra-low power tiers while legacy providers upscale payload sensitivity. Meanwhile, the FCC’s orbital-debris rules push insurance premiums higher, a hurdle newcomers counter with on-orbit drag sails.
Overall, suppliers compete on latency, power efficiency, and API simplicity rather than raw bandwidth. This spectrum of differentiation encourages multipolar rivalry, sustaining innovation cadence inside the satellite IoT communication market.
Satellite IoT Communication Industry Leaders
-
Iridium Communications Inc.
-
ORBCOMM Inc.
-
Inmarsat (Viasat, Inc.)
-
Globalstar, Inc.
-
Fleet Space Technologies Pty Ltd.
- *Disclaimer: Major Players sorted in no particular order
Satellite IoT Communication Market Companies Covered in this Report
- Iridium Communications Inc.
- ORBCOMM Inc.
- Inmarsat (Viasat, Inc.)
- Globalstar, Inc.
- Fleet Space Technologies Pty Ltd.
- Sateliot IoT Services
- Swarm Technologies, Inc. (SpaceX)
- Astrocast SA
- Myriota Pty Ltd.
- Hiber AB
- Kepler Communications Inc.
- SES S.A.
- Eutelsat Group (OneWeb)
- EchoStar Corporation
- Cobham Satcom
- L3Harris Technologies, Inc.
- Omnispace LLC
- Lacuna Space Ltd.
- China Satellite Communications Co., Ltd.(China Satcom)
- Addvalue Technologies Ltd.
Market Opportunities and Future Outlook
Direct-to-device and standardized NB-NTN integration create room in segments that have historically avoided satellite terminals due to cost and complexity, especially for intermittent messaging, compliance telemetry, and resilience use cases. The 2026 market activity reflects this shift, with Iridium discussing progress on NTN Direct and its 3GPP-aligned approach alongside continued IoT traction, and with Skylo and Vodafone launching NB-NTN satellite connectivity (January 2026) across 36 countries. Those launches illustrate an operator-led distribution path in Europe, Africa, and the Middle East and widen demand for low-data-rate connectivity that can support asset tracking, agricultural sensors, and remote monitoring without relying on proprietary device ecosystems.
Opportunities also concentrate in regulated and reporting-driven deployments where continuous telemetry is moving into operating workflows, including maritime emissions reporting and environmental monitoring tied to verified datasets. At the same time, congestion and interference pressure in L- and S-bands lifts the value of solutions that can shift traffic across bands and improve link efficiency, while tighter debris and sharing rules raise the importance of experienced operators with established coordination capabilities. Subsidy programs referenced in the broader market context, including the United States ReConnect and the EU CEF-Digital, support hybrid deployments that connect local IoT networks to satellite backhaul, reinforcing the pipeline for multi-vertical rollouts where terrestrial coverage is incomplete.
Recent Industry Developments in Satellite IoT Communication Market
- April 2026: Iridium Communications Inc. affirms 2026 financial and operational guidance highlighting next-gen IoT modules and PNT ASIC to drive partner interest. The reaffirmation signals direct impact on satellite IoT module demand and ecosystem commitments. Reiterates Iridium's propulsion of NB-NTN-enabled IoT as a core growth engine in 2026.
- January 2026: Iridium Communications Inc. signed partnership agreements with Syniverse and Deutsche Telekom to expand access to global satellite IoT markets. The collaboration strengthens global roaming and interoperability for satellite IoT. It enhances Iridium's reach and de-risks customer onboarding across terrestrial-satellite footprints.
- January 2026: Iridium Communications Inc. launched Iridium NTN Direct service, pivoting to 3GPP NB-NTN standard following termination of Qualcomm Snapdragon Satellite initiative. The direct-to-device NB-NTN offering aligns with industry standardization trends and expands global connectivity options for IoT devices. This move shifts the competitive landscape by broadening direct access to satellite coverage.
Satellite IoT Communication Market Report Scope and Research Methodology
Market Definition and Coverage
This methodology defines the satellite IoT communication market as connectivity delivered through satellite networks that enable IoT devices to send and receive data for tracking, monitoring, and basic control, mainly where terrestrial coverage is limited.
Scope exclusions: excludes general consumer satellite broadband and satellite TV, and also excludes purely terrestrial cellular IoT connectivity.
Segments Covered in This Report
-
By Type of Orbit
- Low-Earth Orbit (LEO)
- Medium-Earth Orbit (MEO)
- Geostationary Orbit (GEO)
-
By Frequency Band
- L-Band
- S-Band
- C-Band
- Ku-Band
- Ka-Band
-
By End-user Industry
- Maritime and Shipping
- Agriculture and Forestry
- Logistics and Intermodal Freight
- Defense and Security
- Environmental Monitoring
- Other End-user Industries
-
By Service Type
- Satellite Asset Tracking
- Remote Monitoring and Control
- Direct-to-Device Connectivity
- Backhaul Connectivity
-
By Geography
-
North America
- United States
- Canada
- Mexico
-
South America
- Brazil
- Argentina
- Rest of South America
-
Europe
- Germany
- United Kingdom
- France
- Italy
- Spain
- Russia
- Rest of Europe
-
Asia Pacific
- China
- Japan
- South Korea
- India
- Australia and New Zealand
- Southeast Asia
- Rest of Asia Pacific
-
Middle East
- Saudi Arabia
- United Arab Emirates
- Rest of Middle East
-
Africa
- South Africa
- Nigeria
- Rest of Africa
-
North America
Data Sources, Market Sizing, and Validation
Desk Research
Desk research was used to map the ecosystem and assemble a set of inputs that can be checked year to year. We reviewed public material such as filings and investor presentations, operator coverage maps, product literature for modules and terminals, and spectrum and licensing updates that affect deployments.
For supporting data points, we relied on non-paywalled sources like ITU publications, FCC filings and notices, ESA and NASA technical publications, and World Bank and OECD connectivity indicators, along with peer-reviewed journals that cover non-terrestrial networks and IoT communications. For company financials and recent developments, we also referenced paid subscriptions, and we used patent databases to track NTN and satellite IoT design activity over time. The sources listed here are illustrative and not exhaustive, and additional references were used to collect, validate, and clarify inputs.
Primary Interviews and Surveys
Primary work focused on confirming what gets monetized in satellite IoT programs, and how usage is priced across deployment types. We spoke with a mix of network-side, device-side, and channel-side experts, and we also gathered demand views from industries like maritime, energy, utilities, agriculture, and logistics across APAC, EMEA, and the Americas to close gaps from the desk inputs and cross-check assumptions.
Distribution of primary research fieldwork respondents
| Company type | Respondent position | Region |
|---|---|---|
| Top tier: 31% | CXOs: 16% | APAC: 40% |
| Mid tier: 48% | Functional/Unit leaders: 39% | EMEA: 33% |
| Smaller Players: 21% | Managers: 45% | Americas: 27% |
Market-Sizing & Forecasting
Sizing starts with a top-down build where IoT addressable demand is reconstructed using satellite coverage realities, device connectivity needs, and adoption levels in remote and mobile asset use cases. That demand is then translated into revenue using pricing structures observed in the market. To keep totals practical, we corroborated the output using selective bottom-up checks such as sampled device and module shipments, service plan pricing ranges, and channel feedback on activation volumes, then adjusted the model where gaps emerged.
Key inputs in the model include the active base of satellite IoT connections, the share of deployments using LEO versus GEO/MEO networks, average message or data usage assumptions for narrowband IoT, service plan ARPU by use case (for example, tracking versus remote monitoring), and hardware attach rates for terminals and modules. Where country-level series are inconsistent, missing points were filled using peer market proxies and then reviewed in primary calls to ensure the final curve stayed aligned with what operators and integrators see in the field.
Forecasts were built using scenario analysis, supported by trend lines for connection growth, price erosion for terminals and modules, and the timing of NTN standardization and coverage expansion. When experts expected step changes (such as new coverage layers or new device certification cycles), we modeled them as discrete adoption steps rather than forcing a smooth curve.
Data Validation & Update Cycle
Validation was handled through repeated cross-checks between the model and independent market signals, including connection counts, announced satellite capacity additions, and the pace of deployments in remote industries. Outliers were flagged, the assumptions behind them were re-tested, and the numbers then went through a multi-step analyst review before sign-off.
Reports are refreshed on an annual cycle, and interim updates are added when material events occur, such as major constellation expansions, meaningful pricing resets, or policy changes that alter access to spectrum and licensing. Before delivery, we run a final pass on the newest public disclosures and expert feedback so the update reflects the latest available view.
Mordor Intelligence's Satellite IOT Communication Market Size Measured Against Other Published Estimates
Published market sizes for satellite IoT communication can differ significantly because the scope is not always aligned, and because pricing assumptions vary between low-data messaging and higher-throughput connections. Differences also stem from the base year used, the exchange rate timing applied, and whether the figures reflect contracted capacity or only realized service revenue.
Some external estimates include equipment plus broader satellite IoT services, and they also rely on connection projections that assume faster ARPU uplift. In Mordor Intelligence, the estimate is kept tied to satellite IoT communication revenues linked to active connectivity use cases, with checks against connection growth, orbit mix, and service-plan pricing so adjacent satellite broadband and unrelated satcom revenue do not inflate the total.
Benchmark comparison
| Source | Market Size | Gaps in Research Methodology |
|---|---|---|
| Mordor Intelligence | USD 2.68 B (2026) | |
| Industry Research Publisher A | USD 1.60 B (2024) | Uses a different base year and often counts a narrower slice of satellite IoT demand, which can understate revenue when connectivity plans and device attach rates scale after coverage expansion. |
| Industry Analyst Firm B | USD 4.70 B (2030) | Combines connectivity and equipment revenue and applies aggressive adoption and pricing ramps to reach a later-year total, which is not directly comparable to a mid-period market value. |
The spread is mainly explained by what is counted and when it is measured, not by simple math differences. By keeping the model inputs traceable to connections, orbit rollout, and observable pricing, and then pressure-testing those inputs through interviews, the final market value stays repeatable and easier to reconcile across updates.
Key Questions Answered in the Report
How large is the satellite IoT communication market in 2026?
It is valued at USD 2.68 billion in 2026 and is on track to post a 19.52% CAGR to 2031.
Which orbit class holds the largest share today?
Low-Earth Orbit networks account for 61.65% of 2025 revenue due to their latency and power advantages.
What is the fastest-growing application segment?
Direct-to-device connectivity leads with a projected 20.64% CAGR through 2031 as smartphones adopt satellite fallback.
Which region will expand quickest by 2031?
Asia Pacific is set for a 20.85% CAGR, driven by digital agriculture programs and domestic launch capacity.
What regulatory change most benefits future growth?
New ITU spectrum allocations at 1.6–1.7 GHz and 2.4–2.5 GHz add 40% capacity for narrowband satellite IoT links.
How do falling launch costs affect competition?
Sub-USD 5,000 per kg rideshare pricing allows startups to field constellations for under USD 100 million, intensifying rivalry.