
Salmon Market Size and Share
Salmon Market Analysis by Mordor Intelligence
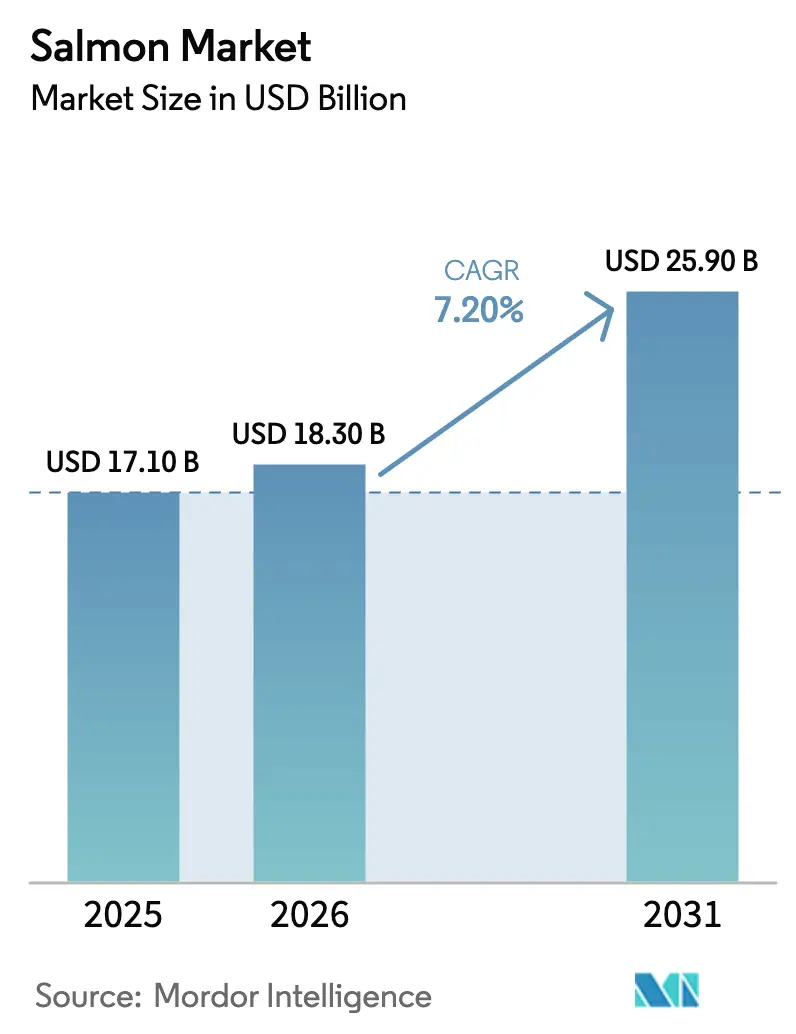
The salmon market size is projected to expand from USD 17.1 billion in 2025 and USD 18.3 billion in 2026 to USD 25.9 billion by 2031, registering a CAGR of 7.2% between 2026 to 2031. This growth rate reflects the rapid build-out of land-based recirculating aquaculture systems that slash freight and disease‐management costs, placing output within a day’s drive of major retail hubs. Norway remained the benchmark producer in 2025, equivalent to 1.4 million metric tons and a significant share of global value, but rising capacity in Saudi Arabia, the United Arab Emirates, and China is steadily rebalancing regional weightings. Feed innovations that cut feed conversion ratios by 10% are cushioning producers against fishmeal price swings exceeding 25% year-over-year. At the same time, regulatory biomass caps in Norway, Scotland, and Canada steer investment toward offshore licenses and closed-containment modules, underpinning a more diversified global supply base.
Key Report Takeaways
- By geography, Europe led the salmon market size in 2025, accounting for 56.0%, and the Middle East is anticipated to grow at a 9.4% CAGR through 2031.
Note: Market size and forecast figures in this report are generated using Mordor Intelligence’s proprietary estimation framework, updated with the latest available data and insights as of January 2026.
Global Salmon Market Trends and Insights
Drivers Impact Analysis*
| Driver | (~) % Impact on CAGR Forecast | Geographic Relevance | Impact Timeline |
|---|---|---|---|
| Expanding cold-chain infrastructure in emerging economies | +1.4% | Asia-Pacific, Middle East, Africa | Medium term (2–4 years) |
| Growing consumer preference for healthy animal protein | +1.8% | Global, highest in North America and Asia-Pacific | Long term (≥ 4 years) |
| Technological advances in recirculating aquaculture systems | +1.5% | North America, Middle East, Asia-Pacific | Medium term (2–4 years) |
| Sustainability certifications influencing buyer decisions | +1.4% | North America, Europe, Asia-Pacific spillover | Long term (≥ 4 years) |
| Development of functional-feed additives that cut FCR by ≥ 10% | +1.1% | Global, early adoption in Norway, Chile, Canada | Medium term (2–4 years) |
| Real-time IoT-based biomass monitoring reducing mortality | +0.8% | North America, Europe, advanced Asia-Pacific farms | Short term (≤ 2 years) |
| Source: Mordor Intelligence | |||
Expanding Cold-Chain Infrastructure in Emerging Economies
Multi-temperature logistics hubs commissioned across Southeast Asia and East Africa after 2024 increased the fresh-salmon shipping window from 48 hours to 72 hours, allowing direct-to-retail distribution that earns a 15% to 20% premium over frozen product[1]. Kenya’s 12,000-pallet Mombasa site and the Philippines' National Cold Chain Roadmap, which allocates PHP 8 billion (approximately USD 143 million), have unlocked underserved tier-2 cities. Saudi Arabia’s Public Investment Fund co-financed last-mile fleets, which keep spoilage below 2%, thereby reinforcing the Kingdom’s 19% production CAGR goal. Rising incomes, especially in secondary Asian cities, are shifting consumption toward portion-controlled fresh packs, prompting producers to place land-based farms within 500 kilometers of supermarkets.
Growing Consumer Preference for Healthy Animal Protein
Farmed Atlantic salmon contains 2.0–2.5 grams of omega-3 per 100 grams, aligning with American Heart Association guidance and supporting a 12% rise in United States per-capita intake to 2.55 pounds in 2025. Japanese imports reached 312,000 metric tons as fresh Atlantic salmon displaced local species in sushi and sashimi due to year-round supply and consistent marbling in 2025. Urban Chinese shoppers increased e-commerce purchases by 18% annually, repositioning salmon as a regular protein source rather than a holiday treat. Retailers in North America and Europe now require labels from the Aquaculture Stewardship Council or Global Good Agricultural Practices (GlobalG.A.P.), embedding sustainability in the health narrative and widening price premiums for certified fish.
Technological Advances in Recirculating Aquaculture Systems
Land-based units commissioned since 2024 report survival rates above 95%, compared to 88% to 92% in sea cages, by eliminating sea lice exposure and stabilizing water quality. Pure Salmon’s Jeddah facility was established in 2023, following an agreement with the Kingdom of Saudi Arabia, and was built for SAR 1.9 billion (USD 507 million). The facility recycles 99% of its process water and achieves a feed conversion ratio of 1.05, significantly below the 1.20 sea-cage benchmark. The energy demand of 12–18 kilowatt-hours per kilogram makes co-location with renewable assets an emerging site-selection criterion.
Sustainability Certifications Influencing Buyer Decisions
The Aquaculture Stewardship Council certification covered 45% of the global volume in 2025, and major North American retailers have refused non-certified supplies. Mowi achieved 100% certification in Norway and Scotland, securing multi-year contracts with premiums ranging from 8% to 12%. Global Good Agricultural Practices (GlobalG.A.P.) version 6 tightened biomass limits and antibiotic reporting, prompting investment in cleaner fish and hydrogen peroxide treatments across Chilean farms. German, Dutch, and UK shopper surveys show that 62% actively seek sustainability labels, reinforcing certification as a price-defense tool.
Restraints Impact Analysis*
| Restraint | (~) % Impact on CAGR Forecast | Geographic Relevance | Impact Timeline |
|---|---|---|---|
| Escalating prevalence of sea-lice and related treatment costs | -1.7% | Norway, Scotland, Chile, Canada | Short term (≤ 2 years) |
| Volatility in fish-meal and fish-oil prices | -1.3% | Global, highest in Chile and Norway | Medium term (2–4 years) |
| Increasing regulatory caps on biomass densities | -1.1% | Norway, Scotland, Canada, Chile | Long term (≥ 4 years) |
| Cyber-physical risks to automated feeding and net-cleaning systems | -0.6% | North America, Europe, advanced Asia-Pacific farms | Medium term (2–4 years) |
| Source: Mordor Intelligence | |||
Escalating Prevalence of Sea-Lice and Related Treatment Costs
Sea-lice infestation in Norway averaged 0.45 adult females per fish in 2025, more than double the regulatory trigger, adding USD 0.30 to USD 0.50 per kilogram in delousing cost. Thermal barges cost USD 3 to USD 5 million and add USD 0.15 per kilogram in operating expense, while cleaner-fish programs face winter mortality above 20%. Heightened environmental scrutiny of azamethiphos reduces chemical options, nudging capital toward closed-containment and offshore cages that demand 50% to 80% higher capital outlays.
Volatility in Fish-Meal and Fish-Oil Prices
Peruvian anchovy landings fell from 3.2 million metric tons in 2024 to a projected 2.8 million metric tons in 2026, pushing fishmeal from USD 1,850 to USD 2,400 per metric ton over 2024-2026 [2]Source: DP World, “Annual Report 2024,” dpworld.com. Each USD 500 rise lifts feed cost roughly USD 0.25 per kilogram of harvested fish, compressing margins by up to 300 basis points[3]Source: BioMar, “Sustainability Report 2025,” biomar.com. Producers are fast-tracking soy concentrate, insect meal, and single-cell proteins, but regulatory approvals delay full substitution until after 2027.
*Our forecasts treat driver/restraint impacts as directional, not additive. The impact forecasts reflect baseline growth, mix effects, and variable interactions.
Geography Analysis
Europe accounted for 56.0% of the salmon market value in 2025, with Norway contributing the largest share due to sustained export demand and premium pricing driven by tight global supply. The region's dominance is further supported by strong consumer preference for salmon as a healthy protein source. Additionally, advancements in aquaculture technology have increased production efficiency, bolstering Norway's market position.
South America, led by Chile as the dominant producer and exporter, faces environmental challenges such as harmful algal blooms and stricter sanitary-distance regulations enforced by Servicio Nacional de Pesca y Acuicultura. Despite these challenges, the region's growth is supported by producer investments in offshore concessions and recirculating hatcheries aimed at mitigating disease risks and improving survival rates. Brazil's increasing consumption of Chilean salmon underpins stable export demand, as urban households incorporate salmon into regular meal plans. North America's market share in 2025 expanded due to land-based recirculating-system projects that bypass traditional net-pen constraints. However, Canadian producers face mandated transitions to closed-containment systems, which may temporarily disrupt production capacity.
The Middle East is projected to achieve the fastest growth among all regions, with a CAGR of 9.4% through 2031. This growth is driven by sovereign wealth co-investments in large-scale land-based facilities that utilize desalination brine as feedwater to meet stringent environmental regulations. Greenfield recirculating aquaculture projects in Saudi Arabia and the United Arab Emirates are transitioning from pilot to commercial scale, positioning the region as an emerging production hub with near-market delivery advantages. Asia-Pacific is the second-fastest-growing region globally, driven by China's licensing of coastal recirculating facilities that bypass import tariffs and reduce cold-chain lead times. In Japan, omega-3 dietary guidelines sustain retail demand for fresh Atlantic salmon, particularly for premium sushi applications. Africa's contribution to the salmon market remains modest, supported by investments in cold-chain infrastructure that enhance distribution efficiency. However, domestic production is negligible, and the region relies predominantly on imports to meet urban demand.


Regulatory Landscape
Salmon production and trade are shaped by tightening environmental and animal-health controls in major farming regions, and by compliance-driven import requirements in key consuming markets. Norway continues to use an environmental-performance-linked licensing model via its traffic light system. In June 2026, the Ministry of Trade, Industry and Fisheries set classifications across 13 production areas using 2024-2025 impact data, determining where capacity can increase and where it must be reduced. Similar biomass-density and sea-lice related constraints referenced across Norway, Scotland, Canada, and Chile keep expansion tied to documented biological performance and technology upgrades, including offshore and closed-containment modules.
On market access, non-tariff measures and standards operate alongside national rules. In October 2025, the Aquaculture Stewardship Council updated the ASC Salmon and Cod Standard to v1.5, tightening baseline expectations on legal compliance, environmental performance, and social criteria that retailers and importers often require. In the United States, seafood import conditions can shift quickly with policy and enforcement changes. In early 2026, a NOAA action tied to Marine Mammal Protection Act comparability concerns created short-term disruption for Irish salmon before being resolved by March 2026, reinforcing the need for documentation, traceability, and certification alignment.
Value Chain Analysis
The global salmon value chain runs from broodstock and hatcheries through smolt and post-smolt production, grow-out (open-net pens, offshore systems, and land-based RAS), harvesting, primary processing (HOG, headed and gutted), secondary processing (fillets, portions, smoked and value-added), and cold-chain distribution into retail, foodservice, and e-commerce. Feed remains the dominant upstream input cost and operational lever, typically blending marine and terrestrial ingredients, while health management (sea lice and disease) and regulatory licensing constraints create variability in biological performance and harvest timing.
Downstream, the chain is increasingly organized around vertically integrated groups and specialized service providers (genetics, nutrition, equipment, data and automation). Consolidation is used to secure licenses, stabilize supply, and improve utilization of processing and logistics assets. M&A activity in 2026 highlights this integration trend, including Cooke entering into a share purchase agreement to acquire Mowi Canada East and SalMar agreeing to acquire salmon farmer Masoval, both of which strengthen control over farming assets and throughput into processing and export channels. Fresh product economics depend heavily on cold-chain reliability and proximity to demand centers, supporting the shift toward post-smolt facilities and land-based production that improves scheduling for processors and buyers while reducing exposure to the marine cycle.
Competitive Landscape
The salmon market is characterized by significant investments and strategic acquisitions. Mowi's acquisition of Nova Sea for NOK 6.1 billion (USD 570 million) in 2025 and SalMar's purchase of Arnarlax for NOK 9.4 billion (USD 880 million) reflect a vertical integration approach focused on securing low-risk licenses. Investments in capital-intensive technologies, including IoT sensors, automated feeders, and thermal delousing barges, support cost leadership for leading players, further widening the performance gap with mid-tier farms.
Companies like Atlantic Sapphire, Nordic Aqua Partners, and Ocean Harvest utilize modular tank systems and renewable energy co-location to achieve feed conversion ratios below 1.10 while avoiding costs associated with sea lice. However, operational challenges, such as temperature-control failures, have extended payback periods. Despite these setbacks, investor interest remains strong as retailers prioritize certified supply sources located near markets.
Intellectual property filings for enzyme-enhanced and microalgae-based feeds increased significantly after 2024. DSM and BioMar obtained patents that reduced feed conversion ratios by 10% to 12%, highlighting nutrition as a growing area of competition. Certification continues to be essential, as non-certified producers face potential exclusion from mainstream channels in North America and Europe, necessitating operational upgrades or acceptance of price discounts.
Market Opportunities and Future Outlook
Technology and infrastructure investments that lower biological risk and improve utilization rates are the most visible whitespace across the supply base. Large post-smolt and smolt projects are being financed and contracted to reduce time in sea cages and manage sea-lice exposure, including Mowi-backed contracts for a USD 106 million smolt facility announced in April 2026, with construction scheduled for 2027. In parallel, land-based capacity build-out continues to move beyond pilots, supported by active financing and commissioning milestones, including Salmon Evolution putting Phase 2 into operation in April 2026 and Bue Salmon beginning groundworks in January 2026 for a large land-based facility at Lutelandet, Norway.
Operational digitization is also expanding from early adoption among leading operators, creating opportunities for solution providers in biomass estimation, feeding automation, fish welfare monitoring, and lice-mitigation analytics. A concrete marker is the April 2026 partnership between Tidal and SalMar to deploy AI-driven feeding and farm intelligence across SalMar operations, reflecting how top-tier producers are investing to protect margins when feed costs and treatment expenses are volatile. On the trade side, compliance-heavy import regimes and evolving tariff discussions, including Chilean sector participation in US Section 301-related hearings in July 2026, reinforce opportunities for certified supply, traceability systems, and diversified market routing for exporters serving North America and Europe.
Recent Industry Developments
- July 2026: SalMar ASA entered into an agreement to acquire 70% of the shares in Masoval (Måsøval AS) for about NOK 3.4 billion. The transaction expands SalMar's farming platform and license base, strengthening control over volumes and biological execution in core Norwegian regions. It also reinforces the consolidation trend among top producers as regulatory and health constraints raise the value of low-risk capacity.
- June 2026: Mowi ASA entered into a share purchase agreement to divest its Canada East salmon farming operations (about 9,000 GWT) to Cooke Inc. for CAD 225 million. The deal reshapes competitive positioning in Atlantic Canada while allowing Mowi to reallocate capital and management focus across its broader farming portfolio. For Cooke, the acquisition adds scale and potential processing and logistics synergies in a region where access to farming assets is a strategic constraint.
- April 2026: Pure Salmon Japan closed a preferred note investment of over USD 180 million led by Fortress Investment Group to support construction of its land-based RAS facility in Mie Prefecture. Securing large-scale financing at this stage accelerates development timelines for near-market production in Japan, supporting fresher supply and reduced reliance on long-haul imports. The funding also signals continued investor backing for capex-heavy RAS models aimed at improving biosecurity and supply consistency.


Research Methodology Framework and Report Scope
Market Definition and Coverage
For this methodology, the salmon market covers the value of salmon sold for human consumption, across farmed and wild supply, and across common product forms that reach commercial trade and retail channels.
Scope exclusions: We exclude salmon by-products and derivatives such as fishmeal, oils, collagen, and leather made from off-cuts.
Segmentation Overview
- By Geography
- North America
- United States
- Production Analysis (Production Volume)
- Consumption Analysis (Consumption Value and Volume)
- Import Market Analysis (Import Value, Volume, and Key Supplying Markets)
- Export Market Analysis (Export Value, Volume, and Key Destination Markets)
- Wholesale Price Trend Analysis and Forecast
- Regulatory Framework
- List of Key Players
- Logistics and Infrastructure
- Seasonality Analysis
- Canada
- Production Analysis (Production Volume)
- Consumption Analysis (Consumption Value and Volume)
- Import Market Analysis (Import Value, Volume, and Key Supplying Markets)
- Export Market Analysis (Export Value, Volume, and Key Destination Markets)
- Wholesale Price Trend Analysis and Forecast
- Regulatory Framework
- List of Key Players
- Logistics and Infrastructure
- Seasonality Analysis
- United States
- Europe
- Norway
- Production Analysis (Production Volume)
- Consumption Analysis (Consumption Value and Volume)
- Import Market Analysis (Import Value, Volume, and Key Supplying Markets)
- Export Market Analysis (Export Value, Volume, and Key Destination Markets)
- Wholesale Price Trend Analysis and Forecast
- Regulatory Framework
- List of Key Players
- Logistics and Infrastructure
- Seasonality Analysis
- United Kingdom
- Production Analysis (Production Volume)
- Consumption Analysis (Consumption Value and Volume)
- Import Market Analysis (Import Value, Volume, and Key Supplying Markets)
- Export Market Analysis (Export Value, Volume, and Key Destination Markets)
- Wholesale Price Trend Analysis and Forecast
- Regulatory Framework
- List of Key Players
- Logistics and Infrastructure
- Seasonality Analysis
- Russia
- Production Analysis (Production Volume)
- Consumption Analysis (Consumption Value and Volume)
- Import Market Analysis (Import Value, Volume, and Key Supplying Markets)
- Export Market Analysis (Export Value, Volume, and Key Destination Markets)
- Wholesale Price Trend Analysis and Forecast
- Regulatory Framework
- List of Key Players
- Logistics and Infrastructure
- Seasonality Analysis
- France
- Production Analysis (Production Volume)
- Consumption Analysis (Consumption Value and Volume)
- Import Market Analysis (Import Value, Volume, and Key Supplying Markets)
- Export Market Analysis (Export Value, Volume, and Key Destination Markets)
- Wholesale Price Trend Analysis and Forecast
- Regulatory Framework
- List of Key Players
- Logistics and Infrastructure
- Seasonality Analysis
- Spain
- Production Analysis (Production Volume)
- Consumption Analysis (Consumption Value and Volume)
- Import Market Analysis (Import Value, Volume, and Key Supplying Markets)
- Export Market Analysis (Export Value, Volume, and Key Destination Markets)
- Wholesale Price Trend Analysis and Forecast
- Regulatory Framework
- List of Key Players
- Logistics and Infrastructure
- Seasonality Analysis
- Italy
- Production Analysis (Production Volume)
- Consumption Analysis (Consumption Value and Volume)
- Import Market Analysis (Import Value, Volume, and Key Supplying Markets)
- Export Market Analysis (Export Value, Volume, and Key Destination Markets)
- Wholesale Price Trend Analysis and Forecast
- Regulatory Framework
- List of Key Players
- Logistics and Infrastructure
- Seasonality Analysis
- Netherlands
- Production Analysis (Production Volume)
- Consumption Analysis (Consumption Value and Volume)
- Import Market Analysis (Import Value, Volume, and Key Supplying Markets)
- Export Market Analysis (Export Value, Volume, and Key Destination Markets)
- Wholesale Price Trend Analysis and Forecast
- Regulatory Framework
- List of Key Players
- Logistics and Infrastructure
- Seasonality Analysis
- Greece
- Production Analysis (Production Volume)
- Consumption Analysis (Consumption Value and Volume)
- Import Market Analysis (Import Value, Volume, and Key Supplying Markets)
- Export Market Analysis (Export Value, Volume, and Key Destination Markets)
- Wholesale Price Trend Analysis and Forecast
- Regulatory Framework
- List of Key Players
- Logistics and Infrastructure
- Seasonality Analysis
- Norway
- Asia-Pacific
- China
- Production Analysis (Production Volume)
- Consumption Analysis (Consumption Value and Volume)
- Import Market Analysis (Import Value, Volume, and Key Supplying Markets)
- Export Market Analysis (Export Value, Volume, and Key Destination Markets)
- Wholesale Price Trend Analysis and Forecast
- Regulatory Framework
- List of Key Players
- Logistics and Infrastructure
- Seasonality Analysis
- Japan
- Production Analysis (Production Volume)
- Consumption Analysis (Consumption Value and Volume)
- Import Market Analysis (Import Value, Volume, and Key Supplying Markets)
- Export Market Analysis (Export Value, Volume, and Key Destination Markets)
- Wholesale Price Trend Analysis and Forecast
- Regulatory Framework
- List of Key Players
- Logistics and Infrastructure
- Seasonality Analysis
- Australia
- Production Analysis (Production Volume)
- Consumption Analysis (Consumption Value and Volume)
- Import Market Analysis (Import Value, Volume, and Key Supplying Markets)
- Export Market Analysis (Export Value, Volume, and Key Destination Markets)
- Wholesale Price Trend Analysis and Forecast
- Regulatory Framework
- List of Key Players
- Logistics and Infrastructure
- Seasonality Analysis
- China
- South America
- Brazil
- Production Analysis (Production Volume)
- Consumption Analysis (Consumption Value and Volume)
- Import Market Analysis (Import Value, Volume, and Key Supplying Markets)
- Export Market Analysis (Export Value, Volume, and Key Destination Markets)
- Wholesale Price Trend Analysis and Forecast
- Regulatory Framework
- List of Key Players
- Logistics and Infrastructure
- Seasonality Analysis
- Chile
- Production Analysis (Production Volume)
- Consumption Analysis (Consumption Value and Volume)
- Import Market Analysis (Import Value, Volume, and Key Supplying Markets)
- Export Market Analysis (Export Value, Volume, and Key Destination Markets)
- Wholesale Price Trend Analysis and Forecast
- Regulatory Framework
- List of Key Players
- Logistics and Infrastructure
- Seasonality Analysis
- Brazil
- Middle East
- Saudi Arabia
- Production Analysis (Production Volume)
- Consumption Analysis (Consumption Value and Volume)
- Import Market Analysis (Import Value, Volume, and Key Supplying Markets)
- Export Market Analysis (Export Value, Volume, and Key Destination Markets)
- Wholesale Price Trend Analysis and Forecast
- Regulatory Framework
- List of Key Players
- Logistics and Infrastructure
- Seasonality Analysis
- United Arab Emirates
- Production Analysis (Production Volume)
- Consumption Analysis (Consumption Value and Volume)
- Import Market Analysis (Import Value, Volume, and Key Supplying Markets)
- Export Market Analysis (Export Value, Volume, and Key Destination Markets)
- Wholesale Price Trend Analysis and Forecast
- Regulatory Framework
- List of Key Players
- Logistics and Infrastructure
- Seasonality Analysis
- Saudi Arabia
- Africa
- Egypt
- Production Analysis (Production Volume)
- Consumption Analysis (Consumption Value and Volume)
- Import Market Analysis (Import Value, Volume, and Key Supplying Markets)
- Export Market Analysis (Export Value, Volume, and Key Destination Markets)
- Wholesale Price Trend Analysis and Forecast
- Regulatory Framework
- List of Key Players
- Logistics and Infrastructure
- Seasonality Analysis
- South Africa
- Production Analysis (Production Volume)
- Consumption Analysis (Consumption Value and Volume)
- Import Market Analysis (Import Value, Volume, and Key Supplying Markets)
- Export Market Analysis (Export Value, Volume, and Key Destination Markets)
- Wholesale Price Trend Analysis and Forecast
- Regulatory Framework
- List of Key Players
- Logistics and Infrastructure
- Seasonality Analysis
- Egypt
- North America
Data Sources, Market Sizing, and Validation
Desk Research
Desk research helped us set clear boundaries and build a starting demand and supply picture before we spoke to the industry. We relied on public sources such as FAO fisheries and aquaculture statistics, national customs and trade statistics, USDA and other food and agriculture agencies, Eurostat, and seafood trade bodies that publish farming and trade updates.
To connect these series to market value, we also reviewed company annual reports and investor presentations, plus processor and exporter updates and reputable press coverage on pricing and capacity changes. In a few places, paid subscriptions were used to speed up checks on company financials, news, patent activity, and shipment-level trade movements, which helped verify directionally where volumes and prices were moving. These sources are illustrative only, and we also used other public and paid references to collect data, validate assumptions, and clarify open questions.
Primary Interviews and Surveys
Primary work was used to test the desk assumptions and fill gaps that public datasets do not explain well, especially around product form mix, channel mix, and price realization across regions. We spoke with aquaculture operators, processors, exporters, importers, distributors, and foodservice and retail-linked stakeholders across APAC, EMEA, and the Americas, and then used their feedback to adjust conversion factors and pricing logic.
Distribution of primary research fieldwork respondents
| Company type | Respondent position | Region |
|---|---|---|
| Top tier: 37% | CXOs: 14% | APAC: 41% |
| Mid tier: 49% | Functional/Unit leaders: 29% | EMEA: 36% |
| Smaller Players: 14% | Managers: 57% | Americas: 23% |
Market-Sizing & Forecasting
Our sizing starts from a top-down build where production, trade, and apparent consumption indicators are reconstructed by region, then translated into value using observed wholesale price movements and form-level mix assumptions. Because official series can lag, and because product forms move at different speeds, the totals were corroborated using selective bottom-up checks, such as sampled price times volume for key trade flows, channel checks with distributors, and supplier-side rollups for major producing hubs.
Inputs used in the model include salmon production volumes (farmed and wild), import and export volumes by key trade routes, wholesale price trends, share of product forms (fresh, frozen, smoked, canned, and whole), and regional consumption signals from food and agriculture statistics. Where data was missing for smaller countries, gaps were handled through proxy ratios based on nearby markets with similar import dependence, followed by expert confirmation. For forecasting, we used scenario analysis anchored on supply expansion plans, expected biomass and harvest cycles, and price normalization expectations, then aligned the scenarios to what primary experts described as a realistic base case.
Data Validation & Update Cycle
Validation was done through several passes, not just one check at the end. We compared model outputs against independent signals such as trade value trends, price movements, and supply expansion news, then reviewed any large variances by country and by form until the driver was explainable.
When an anomaly was found, we re-checked units, conversion factors, and currency timing, and we re-contacted sources when the mismatch could not be resolved from public data. Reports are refreshed annually, and interim updates are made when material events change supply, trade flows, or price assumptions. Before delivery, a final pass is completed so clients receive the latest updated view.
Mordor Intelligence's Salmon Market Estimate Compared With Other Published Estimates
Published market numbers for salmon rarely match perfectly, even when they are meant to cover the same topic. The spread usually comes from what gets counted as market value, which product forms are included, and how prices and currency conversions are handled across regions.
The benchmark table shows differences across sources, and in Mordor Intelligence's model the value is tied to first commercial sale for salmon across fresh, frozen, smoked, canned, and whole forms, rather than retail price build-ups that can add extra margin layers. Gaps also show up when a study uses an older base year, applies a single flat CAGR without re-checking harvest cycles and trade shifts, or updates assumptions less frequently during periods of fast price movement.
Benchmark comparison
| Source | Market Size | Gaps in Research Methodology |
|---|---|---|
| Mordor Intelligence | USD 18.30 B (2026) | |
| Global Consultancy A | USD 19.10 B (2024) | Uses a different base year and narrower product-form coverage, and the value line appears closer to selective categories rather than a consistent first-sale view across forms. |
| Regional Consultancy B | USD 30.59 B (2025) | Leans toward retail-value accounting and a uniform growth path, which can inflate totals when downstream margins and aggressive price progression are applied without supply and trade cross-checks. |
Overall, the differences are explainable once you line up scope, pricing layer, and update timing. By keeping the model traceable to production, trade, form mix, and wholesale price signals, the final number stays repeatable and easier to audit when market conditions shift.


Key Questions Answered in the Report
What is the projected growth rate for the salmon market through 2031?
The salmon market is to grow at a 7.2% CAGR, rising from USD 18.3 billion in 2026 to USD 25.9 billion by 2031.
Which region will expand fastest in value terms?
The Middle East is projected to grow at a 9.4% CAGR through 2031, supported by over USD 500 million in sovereign-linked equity investments.
How do land-based farms influence supply reliability?
They eliminate sea-lice exposure and cut freight by up to USD 2 per kilogram, helping stabilize year-round fresh supply near major retail centers.
Why are sustainability certifications crucial for market access?
North American and European retailers require Aquaculture Stewardship Council or GlobalG.A.P. labels, allowing certified producers to secure contracts at 8%–12% premiums.
What cost risk concerns producers most?
Fish-meal and fish-oil price volatility can lift feed expense by roughly USD 0.25 per kilogram, pressuring margins and accelerating adoption of alternative protein ingredients.
Page last updated on:


 Your data is secure and never sold or shared.


