
Sales Enablement Platform Market Size and Share
Market Overview
| Study Period | 2020 - 2031 |
|---|---|
| Market Size (2026) | USD 5.04 Billion |
| Market Size (2031) | USD 12.35 Billion |
| Growth Rate (2026 - 2031) | 19.65 % |
| Fastest Growing Market | Asia Pacific |
| Largest Market | North America |
| Market Concentration | Medium |
Major Players *Disclaimer: Major Players sorted in no particular order Image © Mordor Intelligence. Reuse requires attribution under CC BY 4.0. | |
Sales Enablement Platform Market Analysis by Mordor Intelligence
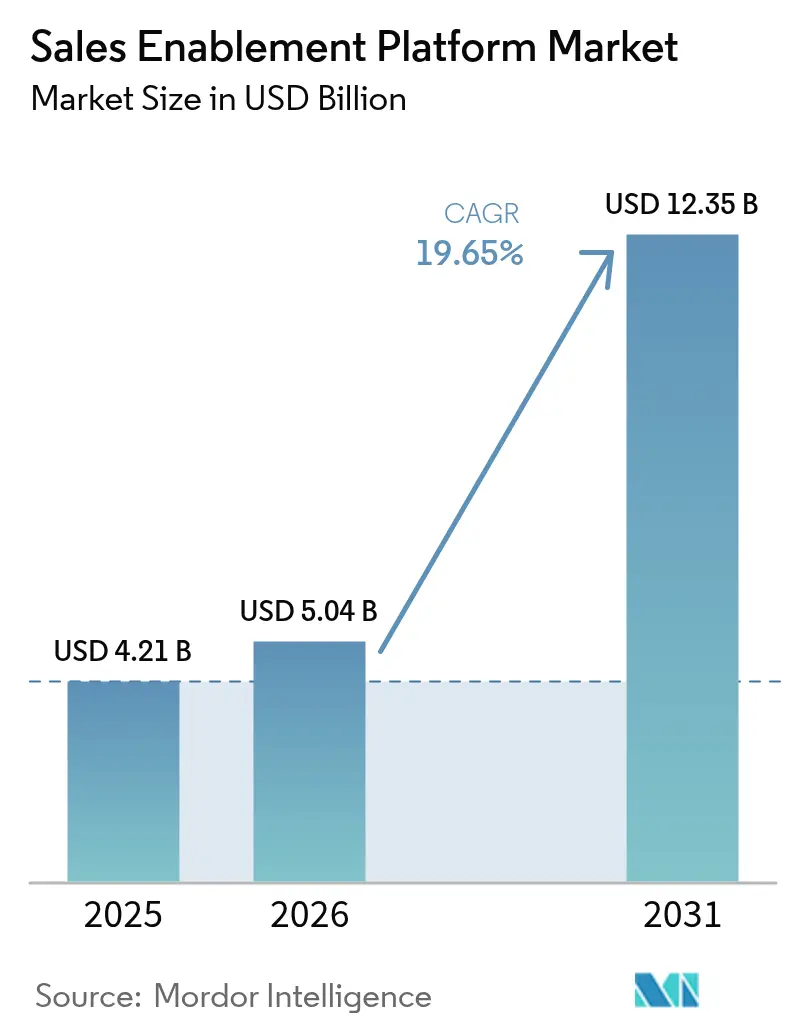
The sales enablement platform market size was valued at USD 4.21 billion in 2025 and estimated to grow from USD 5.04 billion in 2026 to reach USD 12.35 billion by 2031, at a CAGR of 19.65% during the forecast period (2026-2031). The up-swing is driven by enterprises replacing activity-based selling with AI-orchestrated revenue workflows, the normalization of hybrid workforces, and intensifying pressure on sales-productivity metrics. Platform vendors that embed generative AI, real-time analytics and copilots now position their solutions as strategic revenue engines rather than utility software, widening the gap between innovators and feature-parity followers. Cloud deployment continues to dominate because it delivers the elastic compute required for large-language-model workloads while removing infrastructure friction for both large enterprises and resource-constrained SMEs. Private-equity-backed consolidation is compressing the vendor landscape, accelerating the shift toward end-to-end revenue orchestration suites that collapse previously siloed martech and sales tech categories. [1]
Key Report Takeaways
- By component, platform software held 67.42% of the sales enablement platform market share in 2025, while services are forecast to grow the fastest at a 24.2% CAGR through 2031.
- By organization size, large enterprises commanded 58.31% of revenue in 2025; small and medium enterprises are projected to expand at a 26.6% CAGR, more than double the overall sales enablement platform market CAGR.
- By deployment mode, cloud solutions accounted for 82.18% of the sales enablement platform market size in 2025 and are set to rise at a 22.8% CAGR to 2031.
- By industry vertical, IT & telecom led with 21.08% revenue share in 2025, whereas healthcare and life sciences are advancing at the fastest 23.9% CAGR to 2031.
- By geography, North America retained 42.70% of global revenue in 2025; Asia-Pacific is the fastest-growing region at a 21.8% CAGR through 2031.
- By functionality, content management is the largest segment, yet analytics and reporting are the fastest-expanding sub-segment through 2031.
- Seismic, Highspot, Bigtincan, Salesloft and Drift together represent an estimated 45% of global revenue, signalling a moderately concentrated landscape.
Note: Market size and forecast figures in this report are generated using Mordor Intelligence’s proprietary estimation framework, updated with the latest available data and insights as of 2026.
Market Trends and Insights
Drivers Impact Analysis of Sales Enablement Platform Market*
| Driver | (~) % Impact on CAGR Forecast | Geographic Relevance | Impact Timeline |
|---|---|---|---|
| Rapid shift to insight-driven selling workflows | 4.20% | Global, with early adoption in North America & EU | Medium term (2-4 years) |
| Surge in hybrid/remote sales teams post-COVID | 3.80% | Global, particularly strong in APAC & North America | Short term (≤ 2 years) |
| Integration of AI copilots and Gen-AI content automation | 5.10% | North America & EU leading, APAC following | Medium term (2-4 years) |
| Vendor consolidation across martech and salestech stacks | 2.90% | Global, driven by North America & EU markets | Long term (≥ 4 years) |
| ISO/IEC 42001 AI-management standard de-risks adoption | 1.70% | EU & North America primarily, expanding to APAC | Long term (≥ 4 years) |
| EU "Right-to-disconnect" laws amplify need for asynchronous seller enablement | 1.40% | EU primarily, with spillover to other regulated markets | Medium term (2-4 |
| Source: Mordor Intelligence | |||
Rapid shift to insight-driven selling workflows
Revenue teams are retiring generic activity metrics and adopting AI insights that map seller actions to deal progress. Platforms ingest clickstream, CRM and conversation data to recommend next-best actions, boosting pipeline generation by 15% and seller efficiency by 33% for Docket AI clients. Adoption is strongest in technology, BFSI and professional-services firms where buyers demand data-grounded value propositions. [2]
Surge in hybrid/remote sales teams post-COVID
Permanent hybrid models heighten demand for asynchronous enablement that spans time zones and devices. Platforms now embed micro-learning, role-based content tips and short video coaching that sellers can access on demand. Spekit deepened its “just-in-time enablement” play by acquiring Cquence to surface CRM-extracted insights mid-call. Flexible training reduces ramp time without sacrificing compliance tracking. [3]
Integration of AI copilots and Gen-AI content automation
Generative AI evolved from pilot features to table-stakes functionality. Embedded language models auto-draft emails, personalize collateral and predict deal win-likelihood within sellers’ workflow. GTM Buddy users report 50% higher lead conversion and 30% productivity gains after activating AI copilots. Model quality, guardrails against hallucinations and proprietary data sets are key differentiation levers.
European regulations limiting after-hours contact push sales teams toward asynchronous communications and coaching. Enablement platforms that facilitate self-paced learning and auto-generated recaps align with labour-policy mandates, boosting vendor traction in France, Germany and Spain.
Restraints Impact Analysis of Sales Enablement Platform Market*
| Restraint | (~) % Impact on CAGR Forecast | Geographic Relevance | Impact Timeline |
|---|---|---|---|
| Budget compression amid SaaS rationalization | -3.20% | Global, particularly acute in North America & EU | Short term (≤ 2 years) |
| Fragmented CRM and CMS ecosystems hamper data quality | -2.10% | Global, with varying intensity by market maturity | Medium term (2-4 years) |
| Rising Gen-AI hallucination risk triggers stricter IT governance | -1.80% | North America & EU primarily, expanding globally | Medium term (2-4 years) |
| Seller resistance to in-workflow micro-coaching alerts | -1.30% | Global, with cultural variations by region | Short term (≤ 2 years) |
| Source: Mordor Intelligence | |||
Budget compression amid SaaS rationalization
CFOs scrutinize software portfolios as SaaS inflation climbs to 11.3%. Vertice finds 45.7% of paid licenses idle, compelling finance teams to demand clear ROI before renewal. Enablement vendors now lead with revenue attribution dashboards showing lift in win-rates and cycle times.
Fragmented CRM and CMS ecosystems hamper data quality
Many enterprises operate multiple CRMs and content repositories following acquisitions, hindering AI model performance. Implementation timelines lengthen when 60-70% of effort goes to data cleansing. Vendors with robust APIs and data-normalization layers gain an edge.
*Our forecasts treat driver/restraint impacts as directional, not additive. The impact forecasts reflect baseline growth, mix effects, and variable interactions.
Sales Enablement Platform Market Segment Analysis
By Component:
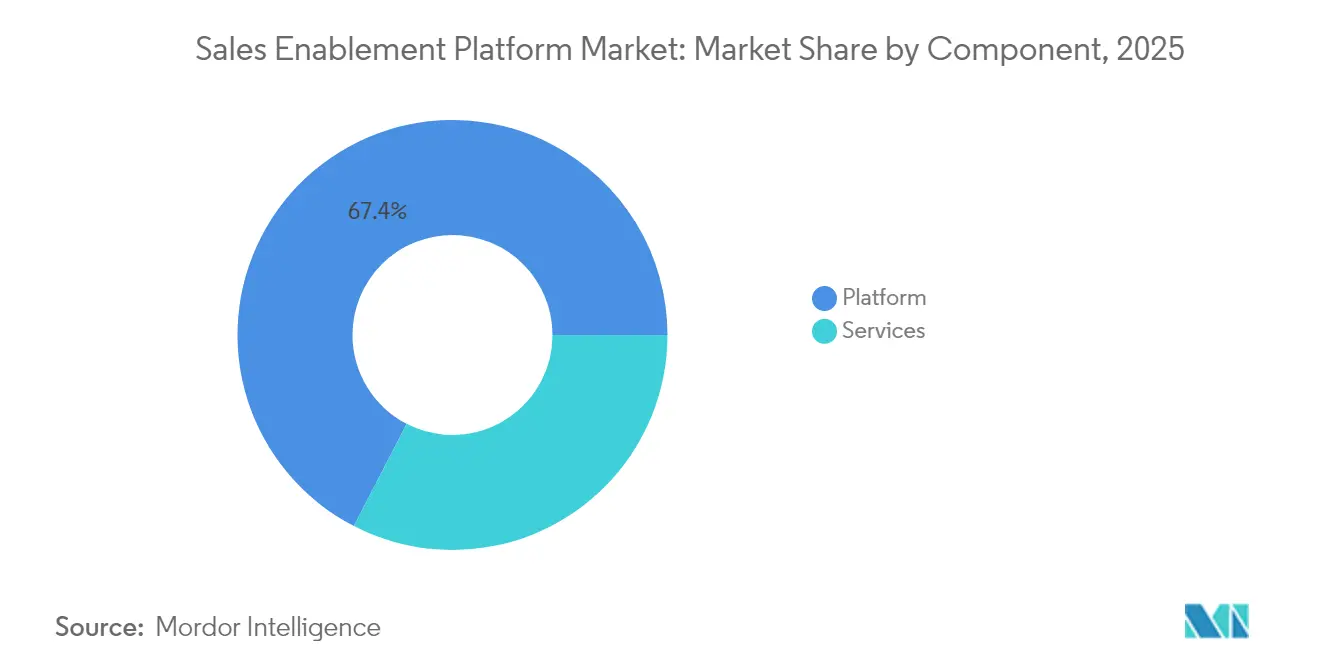
Platform dominance drives service innovationPlatform software held 67.42% of the sales enablement platform market in 2025, reflecting enterprise preference for unified suites that embed content, engagement and analytics in one interface. Services revenue is growing at a 24.2% CAGR as organizations seek expertise in AI model tuning, workflow redesign and change management. Vendors increasingly bundle advisory retainers for continuous optimization, converting one-off projects into subscription-like annuities. This shift widens total contract value and deepens customer lock-in.
The services segment benefits from the complexity of generative-AI deployments that require careful prompt engineering, domain-specific model fine-tuning and ethical-use policies. Specialist partners now train client administrators on governing hallucination risk and interpreting model outputs. As a result, enterprises allocate larger enablement budgets to professional services, driving cross-sell opportunities for platform vendors and systems integrators.

By Organization Size:
SME adoption accelerates through cloud democratizationLarge enterprises account for 58.31% of revenue owing to complex multi-product sales motions that benefit most from AI analytics. SMEs, however, are the fastest-growing buyers at a 26.6% CAGR as subscription pricing removes historical CAPEX barriers. Tata Steel’s 2,000-seller rollout of BigSpring’s multilingual learning hub illustrates scale adoption beyond Fortune 500 boundaries.
SMEs favour vendor UX simplicity, rapid onboarding and pre-built integrations that reduce administrative overhead. Vendors that package “click-to-deploy” playbooks and offer outcome-based pricing win share among growth-stage tech startups and mid-market manufacturers that want enterprise-grade features without heavy IT lift. The momentum of SMEs will gradually dilute large-enterprise share, although absolute spend remains skewed toward global conglomerates.
By Deployment Mode:
Cloud supremacy reinforces scalability imperativesCloud deployments captured 82.18% of the sales enablement platform market share in 2025 and continue expanding at a 22.8% CAGR. Elastic compute allows vendors to run transformer models and real-time speech analytics that on-premises infrastructure cannot handle cost-effectively. Enterprise security concerns are now outweighed by the upside of instantaneous feature releases and worldwide content delivery networks.
Vendors differentiate through zero-trust architectures, bring-your-own-key encryption and region-based data residency—capabilities once exclusive to legacy on-premises products. Meanwhile, the total cost of ownership favours cloud because vendors amortize compute across customers and pass on economies of scale. On-premises solutions persist only in ultra-regulated sub-segments such as defense contracting, where air-gapped networks remain mandatory.
By Functionality:
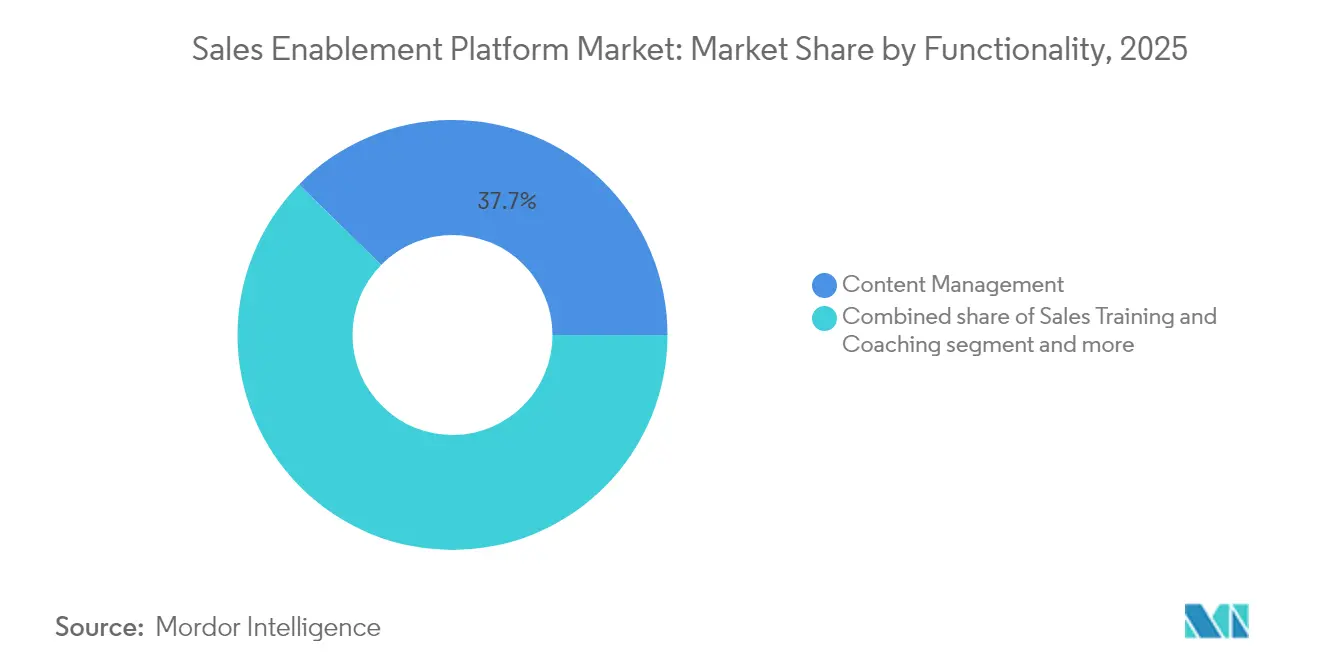
Analytics integration transforms decision-makingContent management remains the entry gate for most buyers, yet analytics and reporting now grows the fastest as leaders insist on tying enablement activities to pipeline influence. High spot and Seismic embed dashboards that correlate content engagement with deal velocity, allowing CROs to prune low-impact assets in real time.
Sales training and coaching gains momentum through AI-driven micro-coaching that detects conversational gaps and pushes corrective prompts mid-call. Guided selling and playbooks, though smaller today, are poised to rise as embedded copilots convert predictive insights into prescriptive next steps. The fusion of analytics, coaching and guided selling ultimately makes static content libraries obsolete, re-positioning platforms as revenue-operating systems.
By End-User Industry:
Healthcare compliance drives specialized adoptionIT & telecom leads the sales enablement platform market with a 21.08% revenue slice, thanks to complex product catalogues and large, dispersed sales forces. Healthcare and life sciences, however, are the growth pacesetters at a 23.9% CAGR as strict regulatory oversight demands granular content approval, real-time audit trails, and role-based access controls. Bayer’s EUR 250 million (USD 293.02 million) “Data-Powered Sales” program exemplifies the vertical’s investment in compliant personalization.
Other high-growth verticals include BFSI, where evolving KYC requirements force accurate document governance, and manufacturing, where multilingual playbooks accelerate channel-partner enablement. Vendors with industry-specific modules—like pre-approved medical-legal review workflows—secure premium pricing and lower churn by embedding deeply into regulated processes.
Geography Analysis
North America Sales Enablement Platform Market
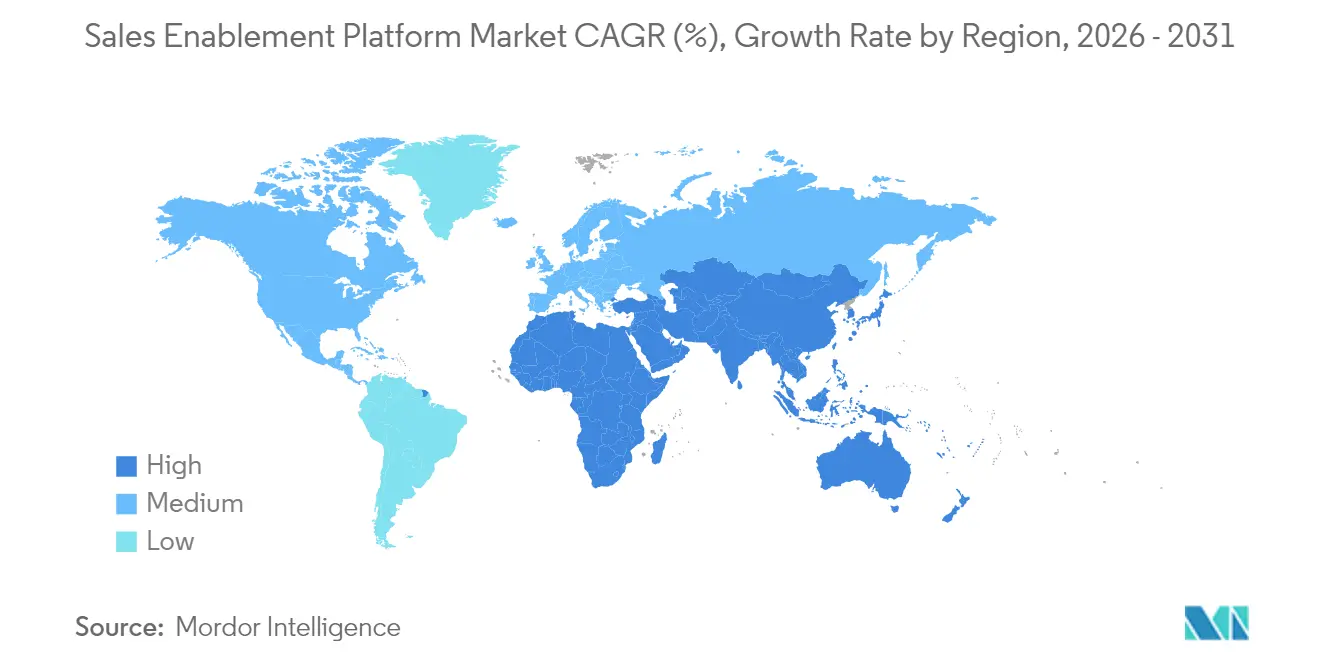
North America generated 42.70% of global revenue in 2025 as multibillion-dollar enterprises prioritized AI-powered enablement to sustain quota attainment. Seismic alone counts 85 million-dollar-plus ARR customers in the region, highlighting the scale of deployments. Cloud maturity, venture-capital funding and early enterprise appetite for generative AI maintain North America’s lead.
APAC Sales Enablement Platform Market
Asia-Pacific is the fastest-growing region at 21.8% CAGR through 2031, propelled by government incentives for digital transformation, surging cloud spend and abundant green-field SME demand. Tata Steel’s multilingual enablement initiative underscores regional innovation in scaling training across diverse languages and time zones. India and Southeast Asia, in particular, leapfrog legacy tooling by adopting mobile-first, cloud-native platforms.
EMEA and LATAM Sales Enablement Platform Market
Europe’s trajectory is shaped by stringent privacy regulations and emerging labour laws such as the right-to-disconnect, which drive uptake of asynchronous enablement. Vendors that offer granular data-sovereignty controls and localized language support gain advantage. Meanwhile, Latin America, the Middle East and Africa contribute smaller shares today but present long-term upside as multinationals expand and regional champions modernize sales operations.
Regulatory Landscape
Regulation affecting sales enablement platforms is increasingly tied to AI governance, privacy, and software assurance because these platforms handle customer data, conversation intelligence, and AI-generated content. In the European Union, the AI Act (Regulation (EU) 2024/1689) sets requirements around human oversight and transparency for AI systems, with key transparency provisions under Article 50 and human-oversight obligations under Article 14 effective from 2 August 2026. That timetable increases the need for disclosure, approval workflows, and audit trails when generative AI is used in outbound and in-workflow seller guidance.
In the United States, federal procurement and assurance signals continue to shape enterprise requirements for SaaS vendors. OMB Memorandum M-26-05 (January 2026) shifted software supply chain security attestations toward a risk-based approach, reinforcing buyer scrutiny of vendor controls, inventories, and governance. Adjacent compliance regimes also influence platform development and implementation requirements, including PCI DSS 4.0 (with Requirement 6.3.2 effective 31 March 2025), which pushes software component inventory discipline that procurement teams often extend across integrated sales-tech stacks, alongside ongoing Federal Trade Commission enforcement under the Telemarketing Sales Rule for outbound practices and claims substantiation.
Value Chain Analysis
The value chain spans (1) data and workflow systems of record, led by CRM and productivity suites, (2) core sales enablement platforms (content management, coaching, analytics, guided selling), (3) specialized AI and engagement layers (conversation intelligence, video, proposal/RFP intelligence), and (4) services for implementation, change management, model governance, and revenue attribution. The cloud and data layer increasingly shapes platform performance because generative AI features rely on governed access to enterprise data and scalable compute, and vendor partnerships that connect enablement to data platforms and content-creation tools reflect that dependency.
Ecosystem integration has also become a primary route to product differentiation, since vendors can reduce context switching by bringing engagement signals and content generation into daily seller workflows. Examples include the March 2026 launch of EY.ai Agentic for Sales in collaboration with Snowflake and Canva to address enterprise AI fragmentation, and the April 2026 expansion of Clari and Salesloft partnership with Vidyard to embed video and buyer engagement signals into revenue workflows. Capability specialists extend the chain through skill and readiness layers as well, including Yoodli partnerships in April 2026 (with Iris for proposal intelligence integration) and June 2026 (with WEKA for scaling AI-driven coaching), while Seismic highlighted ongoing integration with Microsoft Copilot for Sales (July 2026), reinforcing the role of large productivity platforms as workflow anchors.
Competitive Landscape
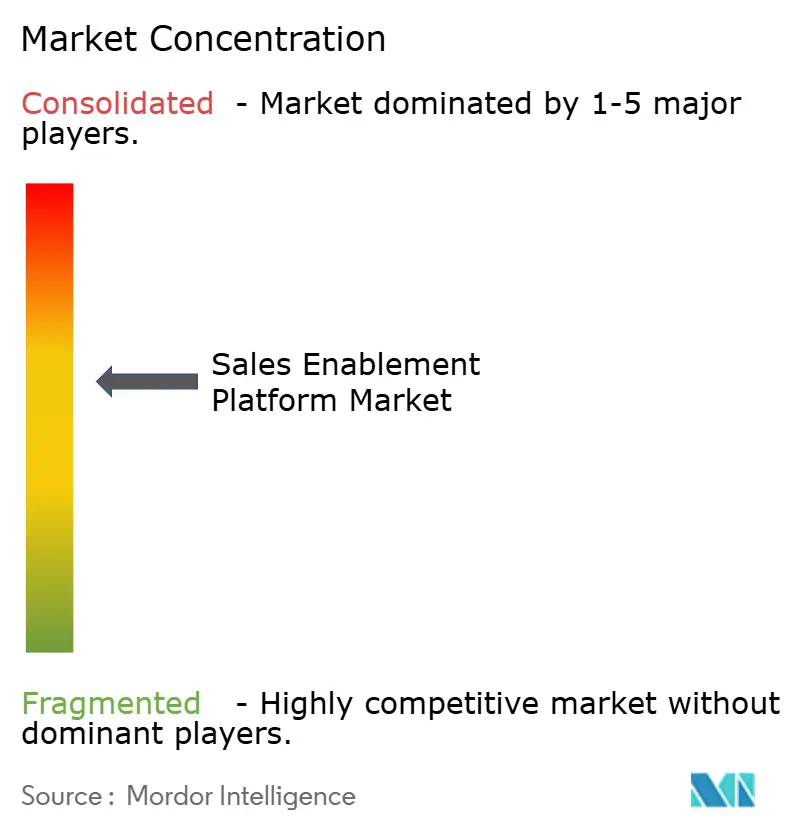
The sales enablement platform market is moderately concentrated yet rapidly consolidating. Seismic surpassed USD 375 million in annual revenue and secured a USD 500 million credit facility to fund acquisitions and AI R&D. Vista Equity merged Salesloft and Drift, signalling a strategic pivot toward unified revenue orchestration.
Competitive differentiation hinges on generative-AI model depth, proprietary training data and embedded analytics that tie enablement to revenue. Allego 8 unveiled AI-powered productivity tools targeting highly regulated verticals, while Outreach partnered with SAP to embed AI-guided workflows into ERP environments.
Intellectual-property filings focus on clickstream-based interest prediction and real-time knowledge retrieval, raising entry barriers for new vendors. Yet white-space remains in under-served mid-market segments and geographies requiring localized support. Vendors able to quantify ROI, offer frictionless integrations and deliver vertical-specific compliance capabilities will outpace peers as spending tightens. [4]
Sales Enablement Platform Industry Leaders
-
Seismic Software Inc.
-
Highspot Inc.
-
Bigtincan Holdings Ltd.
-
Showpad NV
-
Salesloft Inc.
- *Disclaimer: Major Players sorted in no particular order
Sales Enablement Platform Market Companies Covered in this Report
- Seismic Software Inc.
- Highspot Inc.
- Bigtincan Holdings Ltd.
- Showpad NV
- Salesloft Inc.
- Outreach Corp.
- MindTickle Inc.
- GetAccept Inc.
- Upland Software Inc. (Altify)
- Mediafly Inc.
- ClearSlide (Corel Corp.)
- Accent Technologies Inc.
- Allego Inc.
- Quark Software Inc.
- Pitcher AG
- DocSend Inc. (Dropbox)
- Qstream Inc.
- Rallyware Inc.
- Enable.us Inc.
- Showell Oy
Market Opportunities and Future Outlook
Enterprise procurement and governance around generative AI create a clear opportunity for platforms that operationalize AI transparency, human oversight, and auditability in seller workflows, especially for outbound and conversation intelligence use cases. The EU AI Act (Regulation (EU) 2024/1689) sets concrete compliance requirements that push vendors to embed disclosure mechanisms, approval routing, and logging that can be evidenced in security reviews, and it aligns with the broader market shift toward ROI and governance pressure during SaaS rationalization. Services and partner ecosystems also benefit as customers direct implementation effort toward data normalization, AI guardrails, and workflow redesign to reduce hallucination risk and improve attribution.
Platform convergence toward unified revenue workflows is also becoming visible in market actions and product releases, opening whitespace for vendors that connect enablement content and coaching with live buyer signals, proposal automation, and CRM-native orchestration. Showpad announced its Summer 26 release (July 2026) with GenAI-powered agents and integrations including enhanced CRM syncing with SAP Sales Cloud and HubSpot, which supports continued vendor investment in agentic, integration-led roadmaps. Consolidation and integration efforts further reinforce opportunities for cross-platform interoperability and migration tooling as enterprises standardize on fewer, more deeply connected systems across content, training, analytics, and engagement layers.
Recent Industry Developments in Sales Enablement Platform Market
- July 2026: Showpad unveiled its Summer 26 release featuring GenAI-powered agents and deeper CRM integrations with SAP Sales Cloud and HubSpot, expanding content, coaching, analytics, and engagement into end-to-end revenue workflows. The update points to continued vendor investment in agentic, integration-led roadmaps that appeal to large enterprise buyers seeking consolidated platforms.
- March 2026: EY.ai Agentic for Sales launched in collaboration with Snowflake and Canva to address enterprise AI fragmentation across sales workflows. The launch brings together content, coaching, and data signals within seller routines, reinforcing the shift toward unified revenue operations.
- October 2025: Vector Capital completed the acquisition of Showpad NV and merged it with Bigtincan Holdings Ltd to operate under the Showpad brand. The combination broadens an AI-native revenue effectiveness portfolio and expands the scale available for top-tier enterprise deployments.
Sales Enablement Platform Market Report Scope and Research Methodology
Market Definition and Coverage
This market covers revenue earned from sales enablement platforms and related services that help sales teams find and use content, follow playbooks, train and coach reps, and track performance through analytics.
Scope exclusions: We exclude general CRM, standalone marketing automation tools, and generic file storage or collaboration tools when they are not sold and used as sales enablement platforms.
Segments Covered in This Report
- By Component
- Platform
- Services
- By Organization Size
- Large Enterprises
- Small and Medium-sized Enterprises
- By Deployment Mode
- Cloud-based
- On-premises
- By End-user Industry
- BFSI
- Consumer Goods and Retail
- IT and Telecom
- Media and Entertainment
- Healthcare and Life Sciences
- Manufacturing
- Others (Energy, Public Sector, etc.)
- By Functionality
- Content Management
- Sales Training and Coaching
- Analytics and Reporting
- Guided-Selling/Playbooks
- By Geography
- North America
- United States
- Canada
- Mexico
- Europe
- United Kingdom
- Germany
- France
- Italy
- Rest of Europe
- Asia-Pacific
- China
- Japan
- India
- South Korea
- Rest of Asia-Pacific
- Middle East
- Israel
- Saudi Arabia
- United Arab Emirates
- Turkey
- Rest of Middle East
- Africa
- South Africa
- Egypt
- Rest of Africa
- South America
- Brazil
- Argentina
- Rest of South America
- North America
Data Sources, Market Sizing, and Validation
Desk Research
Desk research was used to set the fact base and the boundary of what qualifies as a sales enablement platform before the model was built and tested. We referred to public sources such as US SEC filings, US Bureau of Labor Statistics (sales and marketing employment signals), OECD and World Bank digital adoption indicators, and US International Trade Commission notes when relevant for software and IT services trade context.
On top of this, we reviewed product documentation and public pricing disclosures, earnings call transcripts, investor presentations, and reputable tech press coverage to understand packaging trends such as cloud subscription mix and attach rates for services. Where needed, paid subscriptions focused on company financials and intelligence, patent databases, and news and financials were used to cross-check vendor revenue direction and major product shifts. This desk source list is illustrative only, since many other public references were also used for collection, checks, and clarification.
Primary Interviews and Surveys
Primary work was used to pressure-test adoption, pricing, and deployment behavior across large enterprises and SMBs, covering platform providers, channel partners, system integrators, and end users running sales operations. To reduce blind spots, we spoke with respondents across the Americas, EMEA, and APAC so regional differences in content workflows, coaching cadence, and analytics maturity could be reflected in the final assumptions.
Distribution of primary research fieldwork respondents
| Company type | Respondent position | Region |
|---|---|---|
| Top tier: 38% | CXOs: 13% | APAC: 50% |
| Mid tier: 44% | Functional/Unit leaders: 35% | EMEA: 30% |
| Smaller Players: 18% | Managers: 52% | Americas: 20% |
Market-Sizing & Forecasting
Sizing starts with a top-down build where enterprise software spend and cloud application adoption are used to reconstruct an addressable demand pool for sales enablement use cases, and then this pool is narrowed using penetration and deployment signals by region. To keep the totals realistic, we corroborate them with selective bottom-up approximations based on sampled vendor revenues, channel checks, and an ASP times active customer base view for a subset of the market.
Key inputs used in the model include the share of platform versus services revenue, cloud versus on-premise mix, average contract value ranges by organization size, the pace of AI-led feature adoption in analytics and guided selling, and buyer vertical appetite in areas like BFSI, retail, and manufacturing. Where bottom-up information is missing for smaller suppliers, gaps are handled by applying conservative revenue bands tied to observed pricing tiers and the estimated count of target customers, and then validated again through interviews.
For forecasting, scenario analysis is used because adoption depends on IT budget cycles and sales productivity priorities, which can shift with macro conditions. Assumptions on subscription renewal rates, services attach, and pricing progression are adjusted using expert consensus from primary discussions, and then applied consistently across the 2026 to 2031 horizon.
Data Validation & Update Cycle
Validation is done in layers so unusual jumps do not slip into the final numbers. We compare model outputs with independent signals like vendor mix shifts disclosed in filings, hiring trends for sales operations and enablement roles, and observed cloud software growth patterns, and then large variances are reviewed and corrected.
Before sign-off, assumptions go through analyst-to-analyst reviews, and respondents are re-contacted when pricing, deployment mix, or services intensity looks inconsistent with the market narrative. Reports are refreshed annually, and interim updates are made when material events occur, such as major product changes or demand shocks. Right before delivery, a final pass is completed so clients receive an updated view rather than an older snapshot.
Mordor Intelligence's Sales Enablement Platform Market Size Versus Other Published Estimates
Published market sizes for sales enablement platforms can look far apart, even when everyone is talking about the same buyer need. The spread usually comes from how firms treat services, what they count as a platform feature set, which year they anchor on, and how they convert subscription value across regions.
The benchmark table shows a clear difference in the starting year and the pace of growth, and in Mordor Intelligence's model the 2026 value is tied to platform plus services revenue captured specifically under sales enablement use cases, rather than folding in adjacent sales software categories. Other estimates also vary based on whether they assume faster AI-driven price uplift, use aggressive cloud migration curves, or rely on older vendor mix splits that have not been rechecked through recent interviews.
Benchmark comparison
| Source | Market Size | Gaps in Research Methodology |
|---|---|---|
| Mordor Intelligence | USD 5.04 B (2026) | |
| Global Consultancy A | USD 6.01 B (2025) | Uses an earlier base year and a broader packaging view that can blend sales enablement with wider sales software spend, and the platform versus services split is not always made explicit in the published summary. |
| Industry Publisher B | USD 6.13 B (2025) | Assumes a higher near-term expansion path from cloud-first deployments and AI-led upsell, which can raise ASP expectations, and the timing of currency conversion and refresh cadence can shift the reported USD total. |
Taken together, the differences are mostly explained by scope boundaries and by the year used as the anchor for pricing and adoption. By keeping inputs traceable to customer adoption, platform versus services mix, and realistic pricing bands that are checked in primary calls, the final figure stays balanced and repeatable for decision making.
Key Questions Answered in the Report
What is the current size of the sales enablement platform market?
The market stands at USD 5.04 billion in 2026 and is forecast to hit USD 12.35 billion by 2031.
Which deployment mode is growing fastest?
Cloud-based deployments lead with 82.18% revenue share in 2025 and are expanding at a 22.8% CAGR through 2031.
Why are services growing faster than platform revenue?
Enterprises need specialized expertise for AI model tuning, data integration and change management, driving services at a 24.2% CAGR.
Which region shows the highest growth potential?
Asia-Pacific is advancing at 21.8% CAGR due to accelerated digital transformation and SME cloud adoption.
How are budget constraints affecting platform adoption?
SaaS rationalization pressures vendors to prove ROI, with Vertice noting 11.3% software inflation and 45.7% unused licenses.
What differentiates leading vendors?
Depth of generative-AI capabilities, proprietary training data, vertical-specific compliance modules and unified analytics that tie enablement to revenue.