
Safflower Seeds Market Size and Share
Market Overview
| Study Period | 2021 - 2031 |
|---|---|
| Market Size (2026) | USD 1.17 Billion |
| Market Size (2031) | USD 1.48 Billion |
| Growth Rate (2026 - 2031) | 4.74 % |
| Fastest Growing Market | Africa |
| Largest Market | Asia Pacific |
| Market Concentration | Medium |
Major Players *Disclaimer: Major Players sorted in no particular order Image © Mordor Intelligence. Reuse requires attribution under CC BY 4.0. | |
Safflower Seeds Market Analysis by Mordor Intelligence
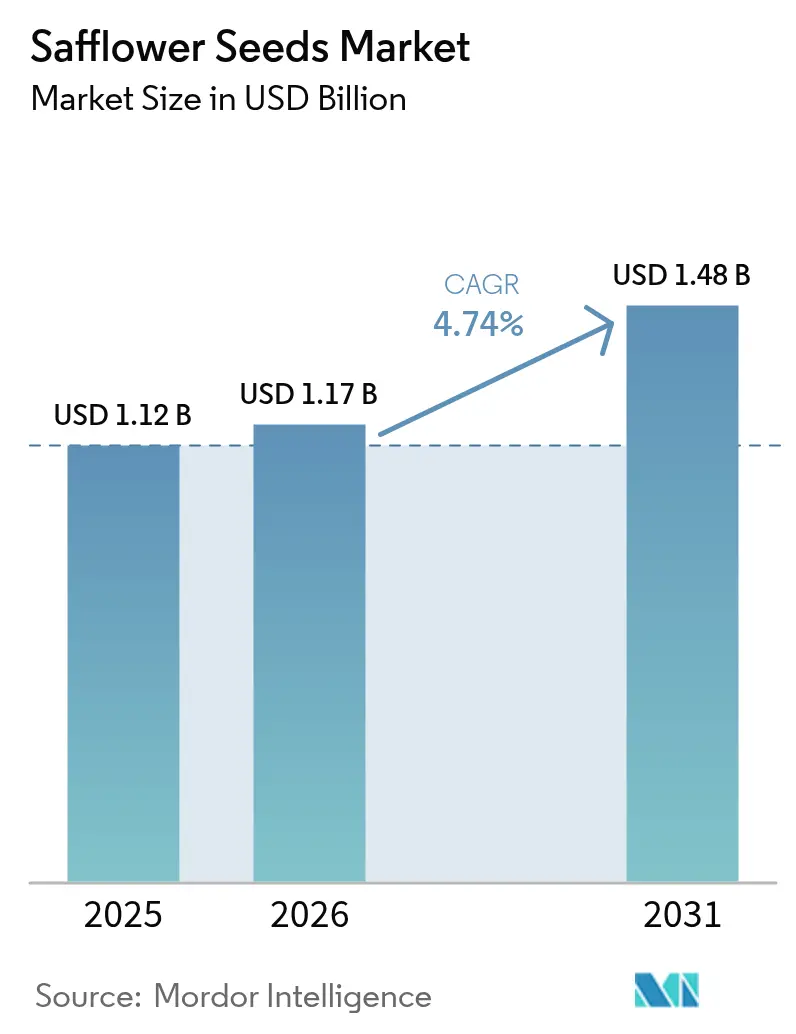
Safflower seeds market size in 2026 is estimated at USD 1.17 billion, growing from 2025 value of USD 1.12 billion with 2031 projections showing USD 1.48 billion, growing at 4.74% CAGR over 2026-2031. Growth reflects the crop’s high-oleic profile, suitability for climate-resilient rotations, and expanding use in cosmetics, functional foods, bird feed, and industrial biolubricants. The Asia-Pacific anchors demand through India’s oilseed self-sufficiency drive and China’s specialty oil imports, while processors in Europe and North America channel high-oleic output toward renewable diesel mandates. Africa enters the supply mix as an emerging origin, though logistics gaps temper near-term upside. Global crushers treat safflower as a rotational filler, leaving room for regional specialists to capture premiums through identity-preserved, non-GMO, and organic channels.
Key Report Takeaways
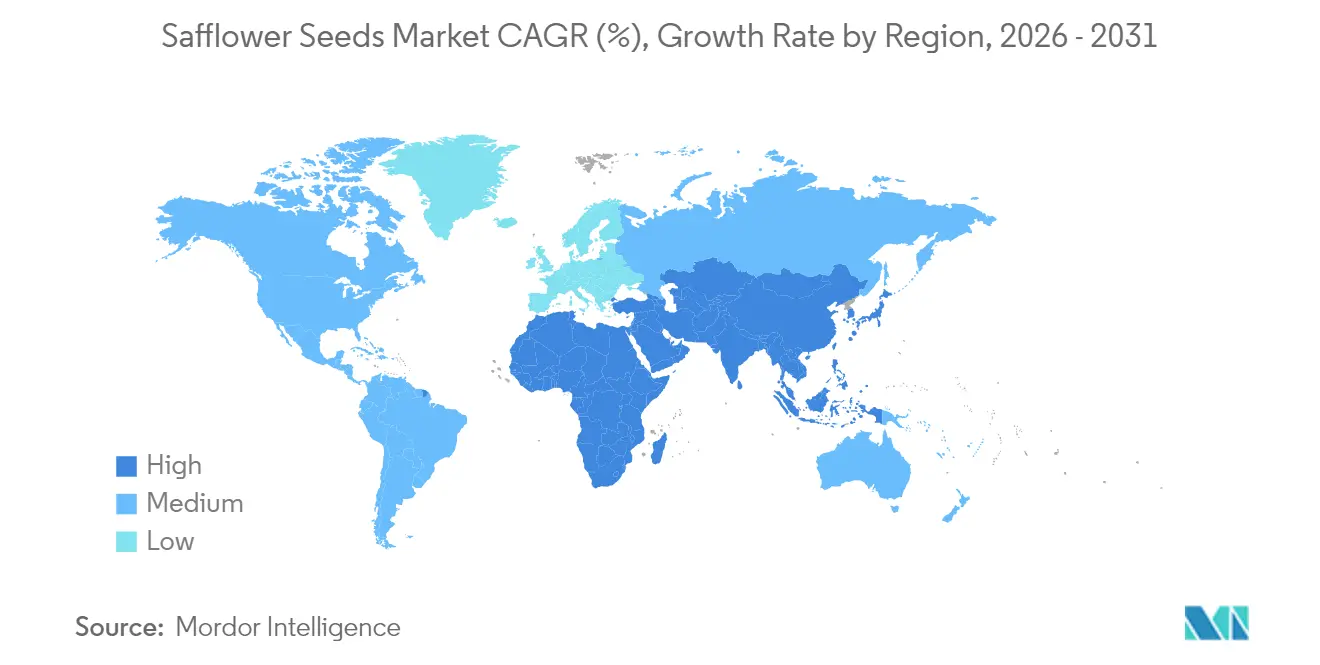
- By geography, Asia-Pacific led with 33.90% of the safflower seeds market share in 2025, while Africa is forecast to expand at a 7.68% CAGR through 2031.
Note: Market size and forecast figures in this report are generated using Mordor Intelligence’s proprietary estimation framework, updated with the latest available data and insights as of 2026.
Market Trends and Insights
Drivers Impact Analysis of Safflower Seeds Market*
| Driver | (~) % Impact on CAGR Forecast | Geographic Relevance | Impact Timeline |
|---|---|---|---|
| Rising Demand for Plant-Based Oils | +1.2% | Global, with concentration in North America, Europe, and the Asia-Pacific | Medium term (2-4 years) |
| Expansion in Cosmetic Formulations | +0.9% | North America, Europe, and the Asia-Pacific urban centers | Medium term (2-4 years) |
| Growth of Functional Foods Sector | +0.7% | Asia-Pacific, North America | Long term (≥4 years) |
| Increasing Bird-feed Consumption | +0.5% | North America, Europe | Short term (≤2 years) |
| Adoption in Biolubricants | +0.8% | Europe, North America, with spillover to Asia-Pacific industrial zones | Long term (≥4 years) |
| Carbon-Sequestration Crop Programs | +0.6% | Europe and North America | Long term (≥4 years) |
| Source: Mordor Intelligence | |||
Rising Demand for Plant-Based Oils
Food makers replacing trans-fats are favoring high-oleic safflower oil, which delivers 79% oleic acid and 338 mg/kg tocopherols, matching olive oil stability at a lower cost. OECD-FAO outlook puts vegetable-oil demand growth at 1.8% annually through 2033, with 52% for food and 18% for biodiesel [1]Source: Food and Agriculture Organization of the United Nations, “OECD-FAO Agricultural Outlook,” FAO.ORG. India’s per-capita oil use rises from 11 kg in 2024 to 13 kg by 2034, prompting rabi-season safflower expansion in Maharashtra and Karnataka. Processors, must segregate high-oleic and linoleic lots, adding logistics costs absent in sunflower or canola flows. As health-centric labeling grows, the safflower seeds market secures a durable demand channel even when edible oil prices soften.
Expansion in Cosmetic Formulations
Safflower oil’s non-comedogenic profile elevates it from commodity to prestige skincare ingredient. Sharon Personal Care’s Hydresia SF2 lowers transepidermal water loss by 18% and allows brands to claim biomimetic hydration without synthetic emulsifiers. Clean-beauty labels, such as Typology, pay USD 8–50/kg for organic, cold-pressed oil, rewarding identity-preserved supply chains. Regulatory alignment with European Cosmetic Regulation 1223/2009 and eases cross-border trade. Yet cosmetics absorb only 2-3% of the global output, so the segment cannot fully buffer crush margins during weak edible oil cycles. Still, the safflower seeds market gains brand visibility that cascades into functional-food and nutraceutical innovation.
Growth of Functional Foods Sector
Extracts rich in hydroxysafflor yellow A target cardiovascular and metabolic benefits, shifting value from commodity oil to high-margin nutraceuticals. Research into omega-3 enrichment positions safflower as a terrestrial alternative to marine DHA for the USD 4.1 billion supplement market. Brands fold neutral-tasting oil into fortified drinks and bars, but commercial claims hinge on costly randomized clinical trials. Iranian dual-purpose trials yielded 11,266 kg/ha forage plus 520 kg/ha seed, showing livestock feed that could widen farmer adoption. The safflower seeds market thus taps health-oriented consumers while supporting agronomic diversification.
Increasing Bird-Feed Consumption
North American and European backyard-bird enthusiasts favor safflower seed for its hard shell that deters squirrels. Retail sells 5 bags at USD 10 and 50-lb sacks at USD 65, a 30–40% premium over sunflower blends. Bird feed accounts for 8–10% of regional safflower production, offering a reliable outlet for off-grade products. Seasonal winter surges pose warehousing challenges, which vertically integrated suppliers mitigate with climate-controlled storage. Although its geographic reach is limited, this niche sets a demand floor that stabilizes prices in the safflower seeds market during edible oil gluts.
Restraints Impact Analysis of Safflower Seeds Market*
| Restraint | (~) % Impact on CAGR Forecast | Geographic Relevance | Impact Timeline |
|---|---|---|---|
| Competition from Sunflower and Canola Seeds | -0.9% | Global, particularly Europe, North America, and the Asia-Pacific | Short term (≤2 years) |
| High Processing Costs | -0.6% | Global, with an acute impact in North America and Europe | Medium term (2-4 years) |
| Volatile Specialty-Crop Acreage Incentives | -0.5% | North America, with spillover to Argentina and Australia | Short term (≤2 years) |
| Limited Cold-Chain Infrastructure in Africa | -0.4% | Africa, particularly Tanzania and Ethiopia | Long term (≥4 years) |
| Source: Mordor Intelligence | |||
Competition from Sunflower and Canola Seeds
Sunflower and canola output of 60 million metric tons and 85 million metric tons dwarfs safflower’s 723,873 metric tons, yielding lower per-unit crush costs and stronger processor commitment. Projections indicate that safflower prices will decline to USD 0.185 by 2028, as the stocks-to-use ratio reaches 9.6% [2]Source: U.S. Department of Agriculture, “USDA Farm Programs Baseline—06-2024,” CBO.GOV. While Black Sea disruptions in 2022-2023 briefly boosted substitution, the normalization of sunflower exports restores their cost advantage in price-sensitive markets. The safflower seeds market, therefore, competes on niche credentials rather than volume economics.
High Processing Costs
Identity-preserved supply, lower oil yields, and molecular distillation increase processing expenses by USD 0.10–0.15/lb, while forward contracts must offer USD 1.00–1.75/bu farmer premiums for biotech seed and USD 1.50–2.50/bu for non-GMO lots. Line changes in multi-oil plants can reduce throughput by up to 20%. Smaller crushers lack scale to amortize these costs, leaving the safflower seeds market vulnerable to margin compression when edible-oil spreads narrow.
*Our forecasts treat driver/restraint impacts as directional, not additive. The impact forecasts reflect baseline growth, mix effects, and variable interactions.
Geography Analysis
APAC Safflower Seeds Market
Asia-Pacific holds 33.90% of the 2025 value, reflecting India’s subsidy-led rabi-season acreage, China’s specialty-oil import pull, and Australia’s rotation strategy. India’s National Mission on Edible Oils-Oilseeds allocates Rs 10,103 crore (USD 1.2 billion) for 2024-2031 to boost oilseed output, positioning safflower as a water-smart alternative in Maharashtra and Karnataka. China continues to import high-oleic grades, allowing processors like Xinjiang Tianding to capture organic premiums. Australia’s plantings remain modest, but Bunge’s 2024 multi-oil plant announcement signals future capacity that could integrate safflower on flexible lines.
Africa Safflower Seeds Market
Africa is projected to post the fastest growth at a 7.68% CAGR through 2031, driven by Tanzania and Ethiopia’s export-oriented agricultural expansion, despite logistics gaps. Ethiopian trials have shown seed yields of up to 2,343 kg/ha under irrigation, with oil content increasing to 29.5% under rainfed conditions. Tanzania paradoxically imports sunflower-safflower blends while exporting raw seed, underscoring cold-chain deficits that erode farmgate returns . Unlocking the potential of the safflower seeds market in Africa hinges on the availability of refrigerated storage and financing for rural electrification.
Europe, North America and Middle East Safflower Seeds Market
Europe, North America, and the Middle East account for the remainder. Europe’s Renewable Energy Directive pulls safflower into renewable-diesel supply chains through the 2025 Bunge-Repsol pact. Russia and Kazakhstan supply over 52% of global production, yet Turkey captures downstream value with USD 120.8 million seed imports in 2023. North America’s area declines while prices soften, signaling processors’ reluctance to invest in the absence of policy tailwinds. Mexico’s 65,760 metric ton harvest satisfies domestic bird feed and crush demand, leaving a limited export surplus. Field trials in Turkey and Iran inform European breeding programs that are exploring high-oleic genetics for the safflower seeds market.


Regulatory Landscape
Regulation affecting safflower seed production and trade is largely handled through broader oilseed seed-quality, phytosanitary, and food/feed safety regimes. In China, the mandatory national standard GB 4407.2-2024 (Seeds of Economic Crops, Part 2: Oil Species) took effect in October 2025, tightening quality requirements and inspection rules that shape seed lots and commercialization pathways for oilseed crops. Provincial and regional technical rules also influence breeding and seed multiplication requirements, which increases compliance needs for purity, germination, and inspection documentation when sourcing from multiple origins.
For cross-border movement, phytosanitary alignment under the International Plant Protection Convention (IPPC) framework remains a key anchor, with the Commission on Phytosanitary Measures (CPM) circulating 2026 session materials that include updates to standards and diagnostic protocols relevant to oilseed crop health. On the demand side, edible-oil policy and tariff structures influence downstream pull for safflower oil and seed, especially in Asia. India, for instance, has used duty differentials between crude and refined edible oils to support domestic refining and oilseed cultivation, reinforcing the policy linkage between import management and incentives for domestic oilseed production.
Value Chain Analysis
The safflower seeds value chain starts with breeding and certified seed supply, followed by farm inputs (fertilizers, crop protection, and mechanization), cultivation in semi-arid rotations, and primary aggregation through traders and local market channels. Quality sorting and grading are critical because end uses split into commodity crush, identity-preserved high-oleic lots for food and cosmetics, and bird-feed channels for off-grade material. Thin market liquidity and dispersed production increase the role of contracting and structured procurement, where processors and marketers set fatty-acid profile, purity, and moisture thresholds to reduce variability and manage the higher line-change and segregation costs common in multi-oil plants.
Processing spans cold-pressed boutique oil as well as industrial crushing and refining, with by-products routed to feed. Logistics and storage remain recurring bottlenecks in emerging origins where collection, grading, and temperature-controlled warehousing are limited. Downstream localization is visible in the Montana Farmers Union partnership with Ag Processing Solutions, which opened a cold-press facility in Great Falls, Montana in April 2026 to convert regional safflower into cooking oil, showing a shift from bulk seed marketing toward local value addition and shorter supply chains.
Competitive Landscape
Global crushers, including Archer Daniels Midland, Olam International Limited, Richardson International Limited, Cargill Incorporated, and Colorado Mills LLC, process safflower on shared lines alongside soy and sunflower, treating it as a rotational filler rather than a core business. This leaves premiums for regional specialists such as Gansu Yasheng Industrial Group, Shandong Bohi Industry, and Soni Safflower Agritech, which secure USD 8–50/kg prices by selling organic, high-oleic oil to cosmetics and nutraceutical buyers. The April 2025 Bunge-Repsol partnership embeds safflower in European renewable-diesel value chains, signaling incumbent interest when policy incentives align.
Kazakhstan and Russia lead production but lack branded downstream channels, exporting raw seed that Turkey refines into specialty oils. The technology focus shifts to blockchain traceability and precision agriculture, which document non-GMO status and carbon footprint, essential for premium buyers. Gene-edited high-oleic varieties promise to reduce farmer premiums, potentially increasing participation in the safflower seeds market.
Africa presents white-space potential: first movers willing to invest in cold-chain and testing labs can capture currently missing seed-to-oil spreads. Bunge’s forthcoming Destrehan, Louisiana multi-oil plant shows how flexible infrastructure could accommodate safflower if carbon-intensity metrics justify its inclusion.
Safflower Seeds Industry Leaders
Archer Daniels Midland Company
Cargill Incorporated
Olam International Limited
Richardson International Limited
Colorado Mills LLC
- *Disclaimer: Major Players sorted in no particular order
Safflower Seeds Market Companies Covered in this Report
- Market Overview
- Market Drivers
- Market Restraints
- Regulatory Landscape
- Technological Outlook
- Value Chain/Supply Chain Analysis
- List of Stakeholders

Market Opportunities and Future Outlook
Opportunities in safflower increasingly center on differentiated value streams rather than volume-led commodity expansion. Identity-preserved high-oleic supply for food stability and clean-label cosmetics continues to reward traceability and segregation, while renewable fuels programs create structured demand pathways for low-carbon intensity oils. The April 2025 Bunge-Repsol partnership, which positioned safflower and camelina as intermediate crops for renewable fuel production in Europe, offers a concrete route for growers and crushers to participate where sustainability criteria and documentation are already in place.
On the supply side, localized processing and specialty platforms are opening channels for growers in regions where safflower acreage faces constraints from competing oilseeds. In North America, the April 2026 opening of the Montana Safflower cold-press facility (with capacity aligned to about 1,000 acres at launch) illustrates a way to capture margin through regional branded oil rather than exporting raw seed. In biotech-enabled ingredient markets, Moolec Science reported successful crushing operations for its GLASO1 safflower platform in 2026, indicating a path for safflower to function as a production host for high-value fatty-acid profiles within existing agricultural and processing infrastructure. Agronomy-focused opportunities also point toward cost reduction and yield stability, supported by 2026 research on net-income gains from minimal tillage in Kazakhstan and optimized nutrient or agroengineering packages for arid-steppe systems in Ukraine.
Recent Industry Developments in Safflower Seeds Market
- May 2026: The Montana Farmers Union, working with Ag Processing Solutions, opened a cold-press facility in Great Falls, Montana to process locally grown safflower into cooking oil. The project started with capacity aligned to around 1,000 acres, creating a nearer-term outlet for growers beyond bulk seed marketing. It strengthens regional value addition and can reduce exposure to thin spot-market liquidity by anchoring procurement to a local processor.
- April 2025: Bunge Limited and Repsol announced a partnership to deploy intermediate crops such as safflower and camelina in Europe to supply low-carbon intensity oils for renewable fuels (including HVO and SAF pathways). The collaboration connects farm-level rotations to renewable-fuel supply chains where sustainability criteria and traceability are required. It also signals larger oilseed processors interest in specialty crops when policy-linked demand supports dedicated programs.
- October 2024: The Indian Union Cabinet approved the National Mission on Edible Oils - Oilseeds (NMEO-Oilseeds) for 2024-25 to 2030-31 to raise domestic oilseed output and reduce import dependence. Safflower is included among the targeted oilseeds, alongside rapeseed-mustard, groundnut, soybean, sunflower, and sesamum. The mission framework supports acreage and productivity interventions that influence seed demand, extension activity, and domestic crush availability.


Safflower Seeds Market Report Scope and Research Methodology
Market Definition and Coverage
For this study, the safflower seeds market covers the traded and domestically supplied safflower seed volume and value used for crushing, food ingredients, and other end uses, counted at the market price level across producing and importing countries.
Scope exclusions: We exclude safflower oil, meal, and other downstream processed products, and we also exclude seed-for-sowing value where it is reported as a separate input market.
Segments Covered in This Report
- By Geography
- North America
- United States
- Production Analysis
- Consumption Analysis (Value and Volume)
- Import Analysis (Value and Volume)
- Export Analysis (Value and Volume)
- Price Trend Analysis
- Mexico
- Production Analysis
- Consumption Analysis (Value and Volume)
- Import Analysis (Value and Volume)
- Export Analysis (Value and Volume)
- Price Trend Analysis
- United States
- South America
- Argentina
- Production Analysis
- Consumption Analysis (Value and Volume)
- Import Analysis (Value and Volume)
- Export Analysis (Value and Volume)
- Price Trend Analysis
- Argentina
- Europe
- Russia
- Production Analysis
- Consumption Analysis (Value and Volume)
- Import Analysis (Value and Volume)
- Export Analysis (Value and Volume)
- Price Trend Analysis
- Spain
- Production Analysis
- Consumption Analysis (Value and Volume)
- Import Analysis (Value and Volume)
- Export Analysis (Value and Volume)
- Price Trend Analysis
- Russia
- Asia-Pacific
- China
- Production Analysis
- Consumption Analysis (Value and Volume)
- Import Analysis (Value and Volume)
- Export Analysis (Value and Volume)
- Price Trend Analysis
- India
- Production Analysis
- Consumption Analysis (Value and Volume)
- Import Analysis (Value and Volume)
- Export Analysis (Value and Volume)
- Price Trend Analysis
- Australia
- Production Analysis
- Consumption Analysis (Value and Volume)
- Import Analysis (Value and Volume)
- Export Analysis (Value and Volume)
- Price Trend Analysis
- China
- Middle East
- Turkey
- Production Analysis
- Consumption Analysis (Value and Volume)
- Import Analysis (Value and Volume)
- Export Analysis (Value and Volume)
- Price Trend Analysis
- Iran
- Production Analysis
- Consumption Analysis (Value and Volume)
- Import Analysis (Value and Volume)
- Export Analysis (Value and Volume)
- Price Trend Analysis
- Turkey
- Africa
- Tanzania
- Production Analysis
- Consumption Analysis (Value and Volume)
- Import Analysis (Value and Volume)
- Export Analysis (Value and Volume)
- Price Trend Analysis
- Ethiopia
- Production Analysis
- Consumption Analysis (Value and Volume)
- Import Analysis (Value and Volume)
- Export Analysis (Value and Volume)
- Price Trend Analysis
- Tanzania
- North America
Data Sources, Market Sizing, and Validation
Desk Research
We start by mapping supply, trade, and pricing signals that can be checked year by year. Public agriculture and trade statistics were referenced, such as FAOSTAT for crop output and harvested area, UN Comtrade style HS trade series for HS 1207.60, and World Bank WITS views for importer and exporter trends. To avoid single-source bias, we also checked national agriculture ministry releases in key producing countries, customs and port statistics where available, and central bank or official inflation series for deflating and normalizing local prices.
On the industry side, we used sources such as company filings and investor presentations from relevant value-chain participants, association websites, and reputed press coverage for demand cues and contract behavior. A paid subscription for shipment-level import and export checks and a patent database were used selectively to confirm trade direction and application activity, especially for high-oleic and specialty use cases. The desk research sources listed here are illustrative only, and we also relied on other public references for validation and clarification.
Primary Interviews and Surveys
Our primary work focused on confirming what portion of safflower seed volume is actually traded and crushed versus diverted to smaller outlets, and how pricing behaves across contract and spot deals. We spoke with a mix of growers and aggregators, traders and brokers, crushers, and large buyers, to pressure-test assumptions on yields, exportable surplus, quality specs, and typical discounts or premiums.
Because flows are global, we ensured views were captured across major producing and importing corridors so the model reflects real shipment behavior, not just local production trends.
Distribution of primary research fieldwork respondents
| Company type | Respondent position | Region |
|---|---|---|
| Top tier: 29% | CXOs: 13% | APAC: 45% |
| Mid tier: 51% | Functional/Unit leaders: 41% | EMEA: 32% |
| Smaller Players: 20% | Managers: 46% | Americas: 23% |
Market-Sizing & Forecasting
Sizing begins with a top-down build that reconstructs the demand pool from production, net trade, and price trend data, then converts those quantities into value using region-relevant price references. To keep the totals realistic, we corroborate results with selective bottom-up checks, such as sampled exporter price times shipped volumes for key corridors and channel checks with crushers and traders, and then use the differences to adjust outliers.
Key inputs used in the model include harvested area and yield movements, exportable surplus and stock change direction, import dependency in major consuming markets, the spread between contract and spot pricing, and quality-driven premiums for specialty lots (for example, high-oleic and identity-preserved shipments). Where direct price series were thin, we handled gaps by triangulating nearby origin and destination benchmarks, then validating the implied unit values against recent trade declarations.
For forecasting, we used scenario analysis supported by short-cycle time series smoothing, since acreage response and trade disruptions can create sharp year-to-year swings in a niche oilseed. Assumptions on yield normalization, trade policy friction, and demand from crushing and feed channels were reviewed with primary respondents so the final outlook remains aligned with realistic farm and buyer behavior.
Data Validation & Update Cycle
We run multiple checks before sign-off so the numbers do not rely on a single storyline. Model outputs are compared against independent signals like trade unit values, production trend breaks, and importer concentration shifts, and any unusual jumps are reviewed and reworked if the drivers cannot be explained cleanly.
A second analyst review is completed to spot variance issues across regions, followed by re-contact triggers when a key assumption moves, such as a sharp freight change or a policy shift that alters export flows. Reports are refreshed annually, with interim updates for material events, and a final pre-delivery pass is completed so clients receive the latest updated view.
Mordor Intelligence's Safflower Seeds Market Size Measured Against Other Published Estimates
Published market sizes for safflower seeds often vary because groups do not all count the same thing, even when the crop name matches. Differences usually come from what is treated as the market transaction (farmgate versus traded value), whether downstream products are included, and how prices are applied when trade is volatile.
The benchmark table shows a spread that mostly comes from scope and price-setting choices. In the Mordor Intelligence model, the value is anchored on seed volume and value signals from production and net trade, while keeping oil and meal outside the number and using region-specific price trend checks to avoid inflated blended pricing.
Benchmark comparison
| Source | Market Size | Gaps in Research Methodology |
|---|---|---|
| Mordor Intelligence | USD 1.17 B (2026) | |
| Industry Association A | USD 0.98 B (2026) | Often closer to farmgate valuation in key origins, with limited reconciliation to import unit values and specialty premiums, which can understate traded value in high-import corridors. |
| Global Consultancy B | USD 1.62 B (2026) | Tends to fold in adjacent value pools such as oil and meal or uses blended oilseed pricing, which can overstate the seed-only market when crushing margins and downstream prices rise faster than seed prices. |
Taken together, the comparison suggests the most important step is keeping the counted product and the pricing reference consistent with how safflower seeds actually move through trade and domestic use. By tying value to clear volume signals and cross-checking implied prices against trade and local benchmarks, we keep the estimate traceable and repeatable when conditions change.


Key Questions Answered in the Report
What is the current value of the safflower seeds market?
The safflower seeds market size stands at USD 1.17 billion in 2026.
How fast is global demand growing?
Market value is forecast to rise at a 4.74% CAGR, reaching USD 1.48 billion by 2031.
Which region leads consumption?
Asia-Pacific holds 33.90% of 2025 value, driven by India and China.
Where is production expanding fastest?
Africa shows the highest growth pace at a 7.68% CAGR through 2031.
Why do processors pay premiums for high-oleic safflower?
High-oleic oil offers oxidative stability for cosmetics, biolubricants, and functional foods, justifying the pricing.
What limits further capacity investment?
High processing costs, acreage volatility, and competition from sunflower and canola restrain new crush projects.
Page last updated on:


 Your data is secure and never sold or shared.


