Market Overview
| Study Period | 2020 - 2030 |
|---|---|
| Base Year For Estimation | 2024 |
| Forecast Data Period | 2025 - 2030 |
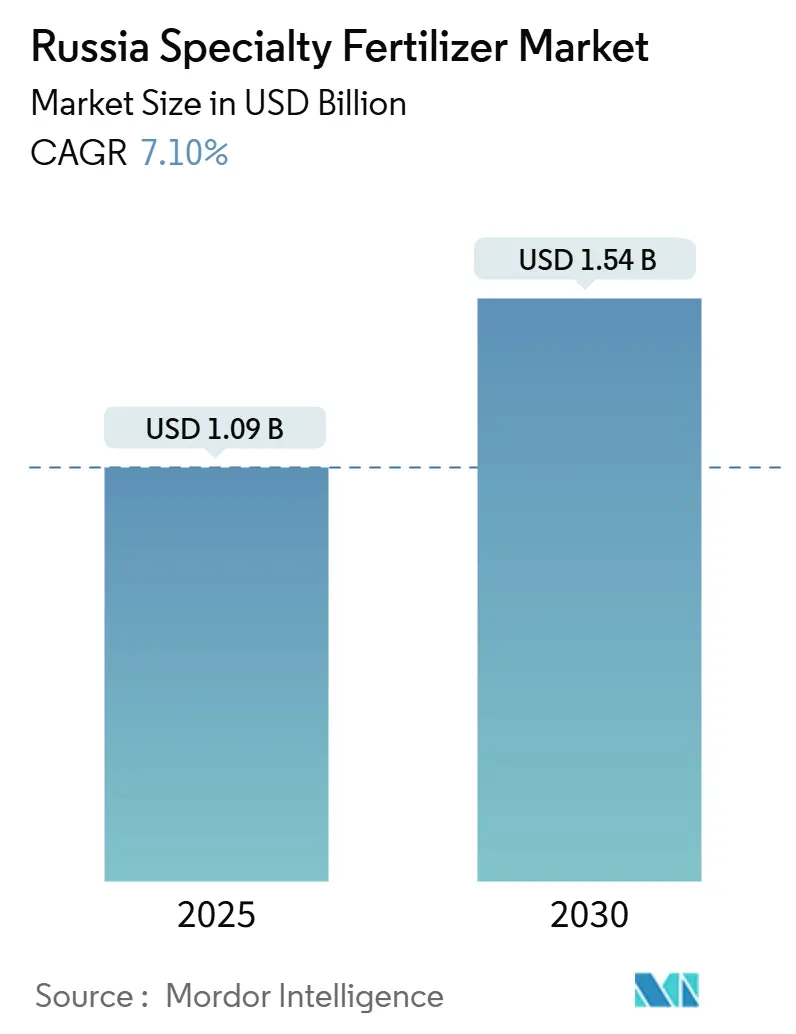
| Market Size (2025) | USD 1.09 Billion |
| Market Size (2030) | USD 1.54 Billion |
| Growth Rate (2025 - 2030) | 7.10% CAGR |
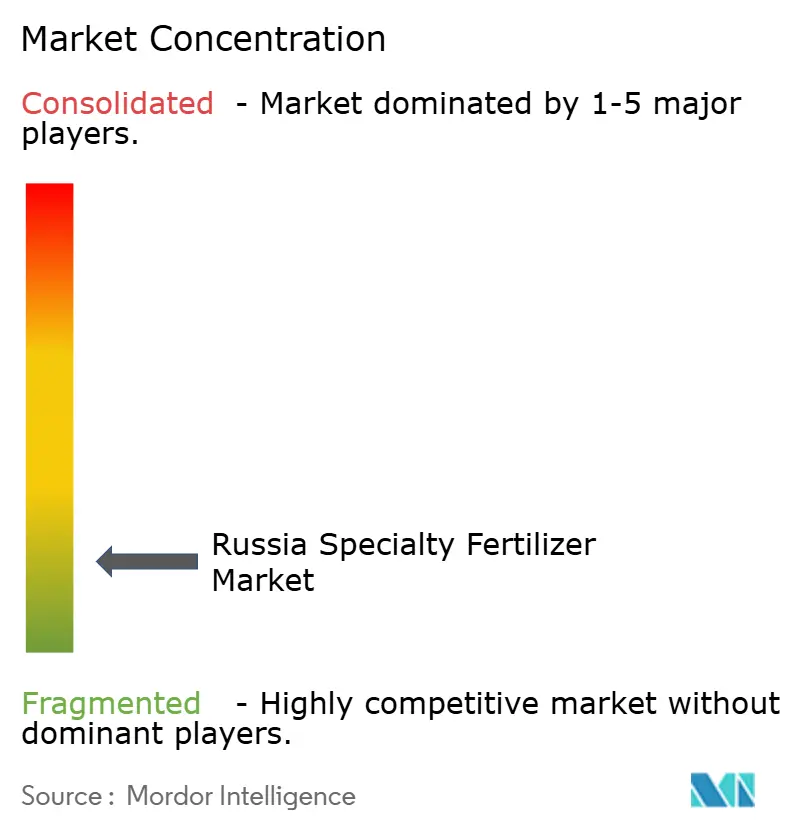
| Market Concentration | Low |
Major Players
*Disclaimer: Major Players sorted in no particular order Image © Mordor Intelligence. Reuse requires attribution under CC BY 4.0. |
|
Russia Specialty Fertilizer Market Analysis by Mordor Intelligence
The Russia specialty fertilizer market size stands at USD 1.09 billion in 2025 and is projected to reach USD 1.54 billion by 2030, reflecting a 7.1% CAGR during the forecast period. Ongoing modernization of crop nutrition practices, government support for precision fertigation, and domestic raw-material recovery have placed the Russia specialty fertilizer market on a firm growth trajectory. Regional subsidies are accelerating the uptake of water-soluble formulations, while polymer-coated products are gaining acceptance in large field-crop enterprises striving to comply with export residue limits. Domestic producers have leveraged sanctions to capture share once held by Western suppliers, enabling supply-chain resilience and reducing import exposure for key ingredients. Currency volatility still poses cost challenges; however, stabilized potash and phosphate production has dampened input price swings, keeping adoption momentum intact across commercial farms.
Key Report Takeaways
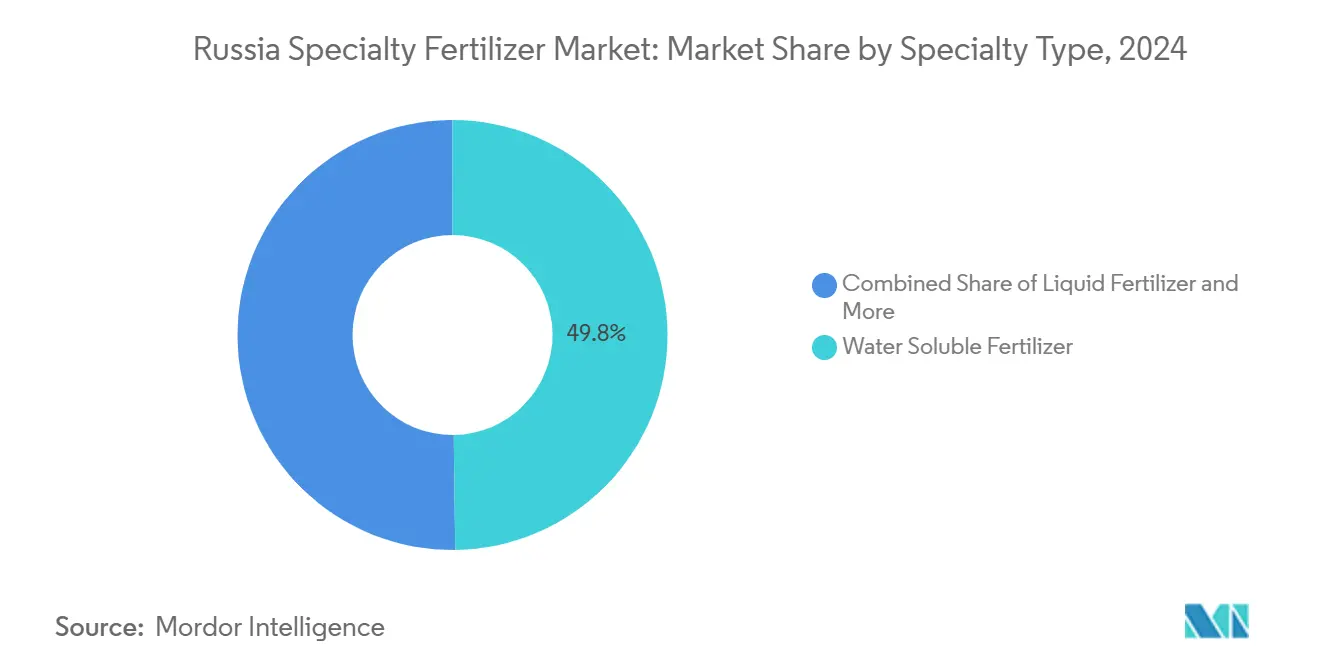
- By specialty type, water-soluble fertilizers led with 49.8% of the Russia specialty fertilizer market share in 2024 and are growing at a 7.3% CAGR through 2030
- By application mode, fertigation commanded 50.3% of the Russia specialty fertilizer market size in 2024 and is expanding at a 7.2% CAGR to 2030.
- By crop type, field crops accounted for a 95.1% share of the Russia specialty fertilizer market size in 2024 and are advancing at a 7.1% CAGR through 2030.
Russia Specialty Fertilizer Market Trends and Insights
Drivers Impact Analysis
| Driver | ( ~ ) % Impact on CAGR Forecast | Geographic Relevance | Impact Timeline |
|---|---|---|---|
| Government subsidies for precision fertigation systems | +1.20% | Russia, with concentration in Moscow and Krasnodar regions | Medium term (2-4 years) |
| Expansion of greenhouse vegetable acreage in Moscow and Krasnodar | +0.80% | Moscow Oblast, Krasnodar Krai, with spillover to Rostov Oblast | Short term (≤ 2 years) |
| Recovery in domestic potash and phosphate availability post-sanctions | +1.10% | National, with primary impact in Perm Krai and Murmansk Oblast | Medium term (2-4 years) |
| Adoption of polymer-coated urea to cut ammonia volatilization | +0.90% | National, with early gains in Stavropol, Rostov, and Krasnodar regions | Long term (≥ 4 years) |
| Digital soil-testing platforms enabling micro-nutrient prescriptions | +0.70% | National, with advanced deployment in export-oriented regions | Medium term (2-4 years) |
| Export-oriented grain growers targeting EU residue limits | +1.00% | Primarily Southern Federal District and Central Federal District | Short term (≤ 2 years |
| Source: Mordor Intelligence | |||
Understand The Key Trends Shaping This Market
Download PDF
Government Subsidies for Precision Fertigation Systems
Federal agricultural-modernization funds were allocated under the Digital Agriculture initiative, halving farmer outlays for automated fertigation equipment[1]Russian Ministry of Agriculture, “Agricultural Development Programs and Subsidies 2024,” mcx.gov.ru. Medium-scale farms covering 500–2,000 hectares have been early beneficiaries, driving 25–35% labor-cost savings compared with broadcast feeding. Local manufacturers, backed by the import-substitution directive, introduced home-grown controllers that trimmed dependence on European components by 35% since 2022. Moscow Oblast achieved 85% subsidy utilization, whereas peripheral regions lag at 45%, underscoring uneven infrastructure penetration. The incentive clearly catalyzes the Russia specialty fertilizer market, especially for water-soluble products integrating with drip lines. Over 2025–2027, sustained budget allocations and progressive cost declines are forecast to widen adoption to smaller cooperatives and contract growers, further boosting domestic demand.
Expansion of Greenhouse Vegetable Acreage in Moscow and Krasnodar
Greenhouse coverage climbed in Moscow Oblast and Krasnodar Krai during 2024, marking annual growth in both regions, respectively. Controlled-environment farms rely on precise nutrient recipes that granular fertilizers cannot supply, lifting demand for water-soluble and liquid formulations. Investors pledged funding for new glasshouse capacity through 2026, signaling durable pull for specialty inputs[2]Russian Greenhouse Union, “Greenhouse Agriculture Development Statistics 2024,” russiangreenhouse.ru. Logistics advantages near population hubs and dense distribution channels allow prompt deliveries, while distant greenhouse clusters incur 15–25% higher freight costs that squeeze margins. Nevertheless, strong consumer preference for locally grown produce and year-round supply keeps nutrient spending elevated. Continuous acreage additions are expected to reinforce the Russia specialty fertilizer market, with suppliers tailoring nutrient packages for cucumbers, tomatoes, and peppers.
Recovery in Domestic Potash and Phosphate Availability Post-Sanctions
Potash output rebounded in 2024, nearing the pre-sanctions level, and phosphate production hit 14 million metric tons. Stable raw-material streams lowered input-cost volatility that previously curtailed specialty product launches. EuroChem and PhosAgro expanded specialty lines by 28% since 2022 after adding dedicated processing units and granular quality-control labs. Predictable feedstock prices allowed formulators to lock in supply contracts, enhancing distributor confidence and inventory planning. The Russia specialty fertilizer market benefits as procurement managers diversify portfolios toward higher-margin precision products that capture consistent yield gains. With sanctions still limiting certain imports, domestic miners enjoy priority sales that keep margins attractive while supporting national food-security objectives.
Adoption of Polymer-Coated Urea to Cut Ammonia Volatilization
Sales of polymer-coated urea increased significantly since 2022, as growers seek to reduce ammonia volatilization by 25-35% compared to conventional urea[3]Russian Environmental Protection Agency, “Environmental Compliance and Emissions Standards 2024,” rpn.gov.ru. Russia's polymer production capacity is projected to double by 2030. The largest new development in the country, SIBUR's Amur Gas Chemical Complex, will have a production capacity of 2.7 million metric tons of polyethylene and polypropylene annually. The facility, scheduled to launch in 2027, will reduce import dependence from 85% to 52%. Early uptake is strongest in Stavropol, Rostov, and Krasnodar, where environmental rules cap emissions and large farms possess capital for premium inputs. Although coating materials remain scarce, escalating grain-quality demands for export markets reinforce the upgrade. Over the long term, expanded coating capacity and ongoing field-demonstration programs are set to embed polymer-coated products in core nitrogen strategies, sustaining the upward path for the Russia specialty fertilizer market.
Restraints Impact Analysis
| Restraint | ( ~ ) % Impact on CAGR Forecast | Geographic Relevance | Impact Timeline |
|---|---|---|---|
| Ruble price volatility versus farm income | -0.90% | National, with higher impact in import-dependent regions | Short term (≤ 2 years) |
| Sanctions-limited access to Western coating polymers | -0.60% | National, particularly affecting controlled-release fertilizer production | Medium term (2-4 years) |
| Low fertigation infrastructure among smallholders | -0.50% | National, with concentration in traditional farming regions | Long term (≥ 4 years) |
| Bureaucratic hurdles for specialty fertilizer registration | -0.40% | National, affecting all market participants equally | Medium term (2-4 years) |
| Source: Mordor Intelligence | |||
Ruble Price Volatility Versus Farm Income
The ruble swung between 75 and 105 per USD in 2024, translating into 35–45% price shocks on imported specialty inputs[4]Source: Central Bank of Russia, “Currency Exchange Rates and Economic Indicators 2024,” cbr.ru. Farm revenues, structured around harvest cycles, adjust with a 6–12-month lag, creating liquidity mismatches during critical application windows. Wheat averaged USD 185 per metric ton while fertilizer costs rose 28% in ruble terms, compressing margins for growers lacking hedging tools. Southern exporters faced steeper exposure as shipment revenues move in foreign currency, yet many input contracts settle in rubles. Although domestic production mitigates some risks, specialized additives and micronutrients still rely on foreign supply chains. The Russian specialty fertilizer market faces challenges due to cautious procurement strategies and shorter sales cycles amid currency instability.
Sanctions-Limited Access to Western Coating Polymers
International restrictions cut controlled-release fertilizer capacity by 40% from pre-sanctions output, limiting premium options for high-value crops. Substitute materials from Asia offer lower consistency, widening nutrient-release variability by 15–20% and eroding differentiation for domestic brands' local research and development initiatives. Export-oriented producers risk losing market share if they cannot match international quality benchmarks, complicating marketing efforts in the European Union and the Middle East. The constraint pushes the Russia specialty fertilizer market toward mid-tier formulations until supply security and performance parity are restored.
Segment Analysis
By Specialty Type: Water-Soluble Products Drive Market Evolution
Water-soluble fertilizers held 49.8% of the Russia specialty fertilizer market share in 2024. followed by liquid formulations. CRF maintained a smaller share, while SRF occupied a niche segment with premium positioning in ornamental landscapes. Their rapid dissolution and compatibility with drip systems deliver nutrient precision that large greenhouse farms demand. As subsidy-aided fertigation spreads, distributors report a notable fall in labor requirements for growers adopting soluble blends. Polymer-coated products dominate the CRF niche, while sulfur-coated variants serve extended-release demands in orchards and turf.
The Russia specialty fertilizer market for water-soluble fertilizers is estimated to grow, with a 7.3% CAGR through 2030, the fastest among categories, reflecting strong demand from greenhouse and fertigation users. Liquid formulations follow with steady growth as foliar feeding gains traction among grain exporters targeting protein thresholds. Looking ahead, CRF mirrors the overall market expansion, signaling latent potential once the domestic coating supply stabilizes. Together, these trends highlight the market’s transition from commodity NPK toward advanced, high-efficiency inputs focused on value addition rather than volume play.
Note: Segment shares of all individual segments available upon report purchase
Get Detailed Market Forecasts at the Most Granular Levels
Download PDF
By Application Mode: Fertigation Infrastructure Transforms Nutrient Delivery
Fertigation captured 50.3% of the Russia specialty fertilizer market size in 2024, followed closely by foliar feeding. Soil-placement methods retained a modest slice yet remain relevant for specialty root-zone products in horticulture. Automated nutrient dosing in fertigation slashes water waste and enables precise timing, outcomes prized under tightening environmental rules. While fertigation infrastructure concentrates on capital-intensive operations, lower-cost sprinkler retrofits promise to democratize the technology among medium-sized cereal farmers by 2027. Application-mode diversity thus underpins resilience in the Russia specialty fertilizer market, offering producers multiple paths to align with regional agronomic realities.
The Russia specialty fertilizer market for fertigation leads growth at a 7.2% CAGR, driven by rapid irrigation modernization, government-backed drip system financing, and expanding greenhouse acreage that demands precision-fed nutrients. Foliar feeding follows with a significant expansion pace, giving exporters flexibility to adjust micronutrient profiles late in the season.
By Crop Type: Field Crops Dominate Specialty Fertilizer Consumption
Field crops represented 95.1% of 2024 consumption, mirroring Russia’s status as a leading grain exporter. Horticultural crops held a smaller share, while turf and ornamental uses accounted for a minimal portion of demand. Wheat, barley, and corn growers increasingly adopt specialty grades to meet protein norms and control mycotoxin levels demanded by European Union customers. This composition shows that productivity gains in broad-acre farming fuel volume demand, while protected cultivation and urban beautification nurture high-margin niches within the Russia specialty fertilizer market.
Field crops expand the fastest at a 7.1% CAGR through 2030, supported by ongoing yield optimization programs and export-driven nutrient management strategies. Horticultural crops follow with steady growth as greenhouse projects multiply around metropolitan demand centers. Turf and ornamental uses grow consistently, powered by municipal landscaping budgets and sports-facility upgrades.

Get Detailed Market Forecasts at the Most Granular Levels
Download PDF
Geography Analysis
The Central and Southern Federal Districts absorbed the majority of sales as Moscow Oblast’s greenhouse hubs and Krasnodar Krai’s export-oriented grain estates prioritized precision nutrition. Strong transport links and established dealer networks enable overnight deliveries, supporting tight application windows. The Volga District contributed significantly, leveraging integrated agro-processing clusters to streamline distribution.
Growth trajectories vary: southern territories are projected to grow substantially, propelled by export premiums and longer growing seasons, whereas northern regions advance more slowly due to shorter vegetative periods. Siberia shows promise with expansion tied to soybean acreage gains and government land-development incentives. Rail upgrades and new regional depots lower freight costs to remote farms, narrowing the accessibility gap.
The Far Eastern District leads future momentum, buoyed by Asian trade routes and border-area subsidies aimed at reducing food imports. Specialty fertilizers here target soybeans and vegetables grown for Chinese and Korean buyers. Environmental protections in ecologically sensitive zones further tilt adoption toward precision products, reinforcing prospects for the Russia specialty fertilizer market in frontier territories.
Competitive Landscape
High fragmentation defines the Russia specialty fertilizer market, with the top suppliers controlling only a small combined share. EuroChem Group tops the list by leveraging vertically integrated mines and an extensive dealer network. PhosAgro Group follows, capitalizing on phosphate assets to roll out value-added blends.
Players compete less on scale and more on agronomic service, offering soil tests, digital dashboards, and on-farm trials that build loyalty. Patent filings for coating technologies surged, signaling a race to localize intellectual property previously sourced abroad. Partnerships with software firms enable fertilizer companies to bundle nutrient plans with remote sensing, differentiating beyond pure chemistry.
Ample white space remains for niche entrants focused on micronutrients, biostimulants, and greenhouse-specific feeds. Consolidation is likely among regional distributors as larger producers chase direct-to-farmer channels. The competitive landscape rewards firms that balance regulatory navigation, supply-chain localization, and data-driven advisory to secure enduring stakes in the Russia specialty fertilizer market.
Russia Specialty Fertilizer Industry Leaders
-
EuroChem Group
-
PhosAgro Group
-
ICL Group Ltd
-
KuibyshevAzot
-
J.M. Huber Corporation (Biolchim SPA)
- *Disclaimer: Major Players sorted in no particular order
Need More Details on Market Players and Competitors?
Download PDF
Recent Industry Developments
- March 2025: EuroChem Group launched its new NP(S)12-40(10) fertilizer under the brand name Croplex. The fertilizer's composition delivers essential nutrients throughout the plant's growth cycle. The nitrogen-phosphorus starter product, containing two forms of sulfur, underwent global market testing before becoming available to Russian farmers. The fertilizer's combination of high water-soluble phosphates and sustained sulfur availability differentiates it from comparable products, making it effective for pre-sowing applications in winter grains and oilseeds.
- April 2024: EuroChem has initiated the second construction phase of its flotation plant at Usolskiy Potash Complex to expand its potash production capacity. The new flotation line, designed for an annual capacity of 1.8 MMT, will increase Usolskiy's total annual capacity to 4.7 MMT of potassium chloride (KCl) by 2027. This expansion strengthens EuroChem's raw material base for potassium-derived specialty fertilizers, including NPK blends with customized K ratios.
- March 2024: PhosAgro Group has launched a new production facility at its Volkhov production complex to meet the increasing demand from Russian farmers. The new construction will increase annual mineral fertilizer production by more than four times compared to 2019 levels. Additionally, phosphate rock processing will increase more than five times, while sulphuric acid production will reach 1.1 million metric tons per year, and phosphoric acid output will achieve 500 thousand metric tons per year.
Russia Specialty Fertilizer Market Report Scope
The Russia Specialty Fertilizer Market is Segmented by Speciality Type (CRF, Liquid Fertilizer, SRF, and Water Soluble), by Application Mode (Fertigation, Foliar, and Soil), and by Crop Type (Field Crops, Horticultural Crops, and Turf and Ornamental). The Report Offers Market Size in Both Market Value in USD and Market Volume in Metric Tons.
Specialty Type
| CRF | Polymer Coated |
| Polymer-Sulfur Coated | |
| Others | |
| Liquid Fertilizer | |
| SRF | |
| Water Soluble |
Application Mode
| Fertigation |
| Foliar |
| Soil |
Crop Type
| Field Crops |
| Horticultural Crops |
| Turf and Ornamental |
| Specialty Type | CRF | Polymer Coated |
| Polymer-Sulfur Coated | ||
| Others | ||
| Liquid Fertilizer | ||
| SRF | ||
| Water Soluble | ||
| Application Mode | Fertigation | |
| Foliar | ||
| Soil | ||
| Crop Type | Field Crops | |
| Horticultural Crops | ||
| Turf and Ornamental |
Need A Different Region or Segment?
Customize Now
Market Definition
- MARKET ESTIMATION LEVEL - Market Estimations for various types of fertilizers has been done at the product-level and not at the nutrient-level.
- NUTRIENT TYPES COVERED - Primary Nutrients: N, P and K, Secondary Macronutrients: Ca, Mg and S, Micronutients: Zn, Mn, Cu, Fe, Mo, B, and Others
- AVERAGE NUTRIENT APPLICATION RATE - This refers to the average volume of nutrient consumed per hectare of farmland in each country.
- CROP TYPES COVERED - Field Crops: Cereals, Pulses, Oilseeds, and Fiber Crops Horticulture: Fruits, Vegetables, Plantation Crops and Spices, Turf Grass and Ornamentals
| Keyword | Definition |
|---|---|
| Fertilizer | Chemical substance applied to crops to ensure nutritional requirements, available in various forms such as granules, powders, liquid, water soluble, etc. |
| Specialty Fertilizer | Used for enhanced efficiency and nutrient availability applied through soil, foliar, and fertigation. Includes CRF, SRF, liquid fertilizer, and water soluble fertilizers. |
| Controlled-Release Fertilizers (CRF) | Coated with materials such as polymer, polymer-sulfur, and other materials such as resins to ensure nutrient availability to the crop for its entire life cycle. |
| Slow-Release Fertilizers (SRF) | Coated with materials such as sulfur, neem, etc., to ensure nutrient availability to the crop for a longer period. |
| Foliar Fertilizers | Consist of both liquid and water soluble fertilizers applied through foliar application. |
| Water-Soluble Fertilizers | Available in various forms including liquid, powder, etc., used in foliar and fertigation mode of fertilizer application. |
| Fertigation | Fertilizers applied through different irrigation systems such as drip irrigation, micro irrigation, sprinkler irrigation, etc. |
| Anhydrous Ammonia | Used as fertilizer, directly injected into the soil, available in gaseous liquid form. |
| Single Super Phosphate (SSP) | Phosphorus fertilizer containing only phosphorus which has lesser than or equal to 35%. |
| Triple Super Phosphate (TSP) | Phosphorus fertilizer containing only phosphorus greater than 35%. |
| Enhanced Efficiency Fertilizers | Fertilizers coated or treated with additional layers of various ingredients to make it more efficient compared to other fertilizers. |
| Conventional Fertilizer | Fertilizers applied to crops through traditional methods including broadcasting, row placement, ploughing soil placement, etc. |
| Chelated Micronutrients | Micronutrient fertilizers coated with chelating agents such as EDTA, EDDHA, DTPA, HEDTA, etc. |
| Liquid Fertilizers | Available in liquid form, majorly used for application of fertilizers to crops through foliar and fertigation. |
Need More Details on Market Definition?
Ask a Question
Research Methodology
Mordor Intelligence follows a four-step methodology in all our reports.
- Step-1: IDENTIFY KEY VARIABLES: In order to build a robust forecasting methodology, the variables and factors identified in Step-1 are tested against available historical market numbers. Through an iterative process, the variables required for market forecast are set and the model is built on the basis of these variables.
- Step-2: Build a Market Model: Market-size estimations for the forecast years are in nominal terms. Inflation is not a part of the pricing, and the average selling price (ASP) is kept constant throughout the forecast period for each country.
- Step-3: Validate and Finalize: In this important step, all market numbers, variables and analyst calls are validated through an extensive network of primary research experts from the market studied. The respondents are selected across levels and functions to generate a holistic picture of the market studied.
- Step-4: Research Outputs: Syndicated Reports, Custom Consulting Assignments, Databases & Subscription Platforms

Get More Details On Research Methodology
Download PDF


